Computer Vision Based People Tracking for
Motivating Behavior in Public Spaces
by
Jacob A. Hyman
Submitted to the Department of Electrical Engineering and Computer
Science
in partial fulfillment of the requirements for the degree of
Master of Engineering in Electrical Engineering and Computer Science
at the
MASSACHUSETTS INSTITUTE OF TECHNOLOGY
August 2003
r ',.I
Cr@
Massachusetts Institute of Technology 2003. All rights reserved.
A uthor...
Department of Eleefical Engineerin'and Computer science
August 22, 2003
C ertified by ....
...
Stephen S. Intille
Changing Places
/
House-n Technology Director
Thesis Supervisor
Accepted by..
Arthur C. Smith
Chairman, Department Committee on Graduate Students
OF TECHNOLOGY
Computer Vision Based People Tracking for Motivating
Behavior in Public Spaces
by
Jacob A. Hyman
Submitted to the Department of Electrical Engineering and Computer Science on August 22, 2003, in partial fulfillment of the
requirements for the degree of
Master of Engineering in Electrical Engineering and Computer Science
Abstract
In this work a system that automates the process of people counting to determine what effects "just-in-time" messages have on motivating behavior is described. The system is designed to permit automatic study of the impact of motivational messages on people's stair use. A projector presents a point-of-decision message to passers-by choosing between a set of stairs and an escalator while a computer vision algorithm counts each type of traffic. Preliminary results of the effects of messages displayed in a Boston area subway station are discussed. The system is designed to be easily moved to different locations with minimal change to the setup and algorithm. Results from an initial trail showed a 4.3% increase in stair usage (p < .001), demonstrating both
the viability of the measurement technology and the potential of point-of-decision messaging to change behavior.
Thesis Supervisor: Stephen S. Intille
Acknowledgments
I would like to thank my advisor, Stephen Intille, for his support and guidance over
the last year and a half. Without his vision, this project would never have happened. Thank you for donating so much of your time and effort in helping me complete this thesis.
I would also like to thank my parents, Sandra and Derry, and my brother Aaron
for all that you have done for me over the last 23 years. You have always encouraged me in all of my pursuits, and it is because of you that I was able to make it through MIT. Any words I could think of would not reflect how much you have meant to me. Thanks for your continued love and support for the last 5 years I have been away from home.
House-n has provided a wonderful work environment for me over the last year and a half. Thank you to all the graduate students, undergrads, research staff, and support staff for providing such a great place to do research. Special thanks to TJ and Tyson for all your help with "The Box" and to John for annotating all those hours of video.
My time at MIT was defined by the friends I made along the way. Thank you for
making my stay here so much better.
I would also like to thank the Metro Boston Transit Authority for allowing us to
install counting systems in 3 of their stations.
This work was funded in part by the Robert Wood Johnson Foundation (Improving methods for measuring stair use in public spaces, #044256) and by the National Science Foundation (ITR/PE: Using context recognition for preventive medicine in the home, #0112900).
Contents
1 Introduction
1.1 The Need for Preventative Health Technologies . . . .
1.2 Measuring Behavior in Public Spaces . . . .
1.3 Contributions of This Work . . . .
2 The 2.1 2.2 2.3 2.4 Problem
Motivating Behavior Change in Public Spaces Scenarios for Proactive Messaging . . . .
A New Opportunity . . . .
Measuring the Impact of Technology on Behavior
3 Theory and Rationale
3.1 Point of Decision Messaging . . . .
3.2 Previous Stair Studies . . . .
3.2.1 Observations on Previous Stair Studies
3.3 People Counting Algorithms . . . .
3.3.1 Goals of Stairs/Escalator Counter . . . 4 Design and Implementation
4.1 System Overview . . . . 4.2 System Components . . . .
4.3 The People Counting Algorithm . . . . 4.3.1 Image Acquisition and Pre-Processing
17 17 18 19 21 . . . . 21 . . . . 23 . . . . 24 . . . . 26 27 27 28 33 33 38 39 . . . . . 39 . . . . . 40 . . . . . 43 . . . . . 43
4.3.2 Frame Differencing . . . . 4.3.3 Background Subtraction . . . . 4.3.4 Image Stacks . . . .
4.3.5 Analysis of Image Stacks . . . . 4.3.6 Tracking . . . . 4.3.7 Data Storage . . . . 4.3.8 General Performance Characteristics . . .
4.4 Presentation of Motivational Messages . . . .
5 Evaluation
5.1 Installation Sites . . . .
5.1.1 Kendall Inbound . . . .
5.1.2 Kendall Outbound . . . .
5.1.3 D avis. . . . .
5.2 Obtaining Test Data . . . .
5.3 People Counting Algorithm Performance . . . . . 5.4 Impact of Motivational Messages on Stair Usage .
5.5 Computing Significance of Results . . . .
5.6 Evaluation as a Cost-effective Measurement Tool.
6 Conclusion
A Enclosure Box Diagrams
B Camera Turret Diagram
C Projector Control
D Parts List
E Calibration
F Interesting Daily Graphs
. . . . 43 . . . . 44 . . . . 45 . . . . 47 . . . . 47 . . . . 49 . . . . 49 . . . . 51 53 . . . . 53 . . . . 53 . . . . 54 . . . . 56 . . . . 57 . . . . 57 . . . . 63 . . . . 69 . . . . 71 73 75 83 85 89 91 97
G People Count Data
H Annotation Software 107
I Data Collection Procedures 109
I.1 Communicating with the Laptop ... ... 109
1.2 Test Video ... ... 109
1.3 Daily Counts ... ... 110
J Letter from the MBTA 111 K Data Set Formats 113 K.1 Annotation Data Format . . . . 113
K.2 Escalator File Format - AVI . . . . 113
K.3 Escalator File Format - Live Video . . . . 114
K.4 Stair File Format - AVI . . . . 114
K.5 Stair File Format - Live Video . . . . 115 L Matlab Simulation Code 117 103
List of Figures
2-1 The motivational sign used by Brownell et al. in their original stair stu dy [81. . . . . 22 2-2 Results scanned from the Brownell et al. follow up study [8] showing
an increase in stair usage during intervention that returned to slightly above baseline in 3 months. . . . . 22
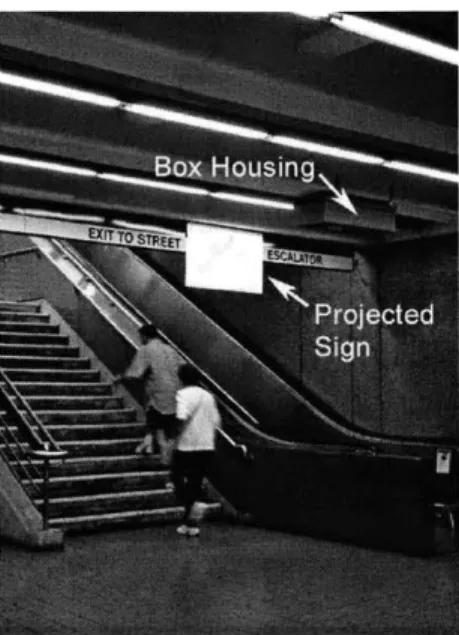
2-3 Everywhere Display providing information about energy use. . . . . . 24 4-1 The system in Kendall outbound station. The box has a projector
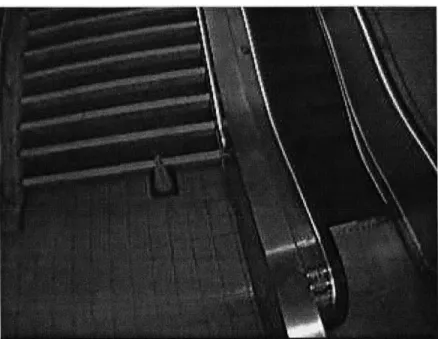
to display the sign and a camera directed at the stairs/escalator and connected to a laptop to count passers-by. . . . . 40 4-2 The view of the stairs and escalator from the Kendall inbound camera
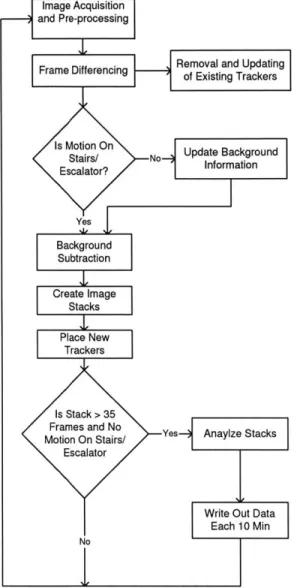
(320 x 240 resolution). . . . . 41 4-3 Flowchart describing people counting algorithm. . . . . 42 4-4 Images from Kendall inbound station with a crowd of people on the
stairs and escalator. . . . . 42 4-5 Real image and corresponding difference image. . . . . 44 4-6 Real image and corresponding background subtraction image. Note
that background subtraction is only performed in areas of interest that are highlighted. . . . . 44 4-7 Two image stacks. The left is created from the background subtraction
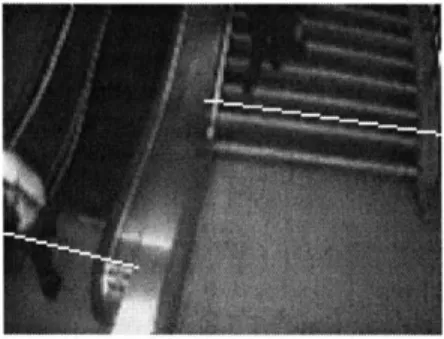
images, and the right is created from the difference images. . . . . 46 4-8 Scan lines places along the stairs and escalator during calibration of
4-9 Trackers tracking a person's movement down the stairs. Because of arm movement, some of the trackers move slightly up. A threshold is set on how far a tracker needs to move in either direction to avoid having these trackers count pixels moving in the wrong direction. . . 48 4-10 The algorithm must perform in conditions that can vary as much as
these images. The image on the left is from when the sun is shining directly into the station. The image on the right is from a dark evening. 50
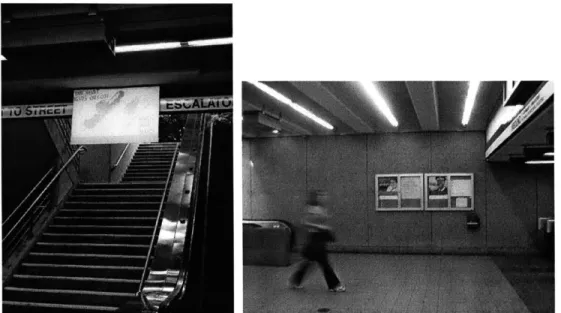
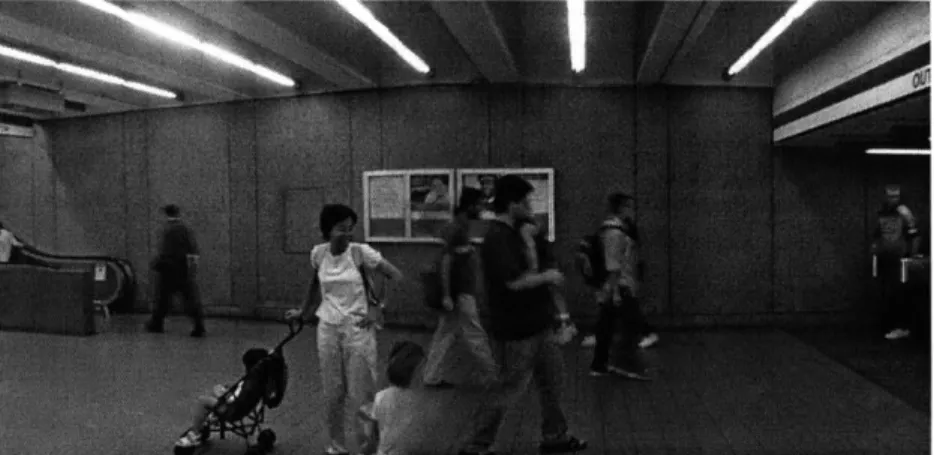
5-1 View of Kendall inbound system and projection. The second image shows the distance between the turnstiles and the stairs/escalator. . . 54
5-2 View of Kendall outbound system and projection. . . . . 55 5-3 Side view of the Kendall outbound station. . . . . 55
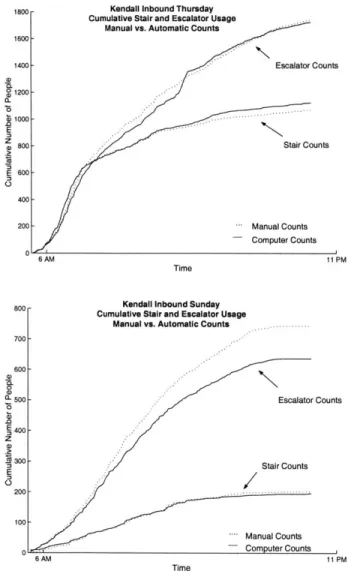
5-4 View of Davis system. The sign will be projected against the brick wall to the right of the escalators. . . . . 56 5-5 Graphs showing the typical traffic flow through Kendall inbound for
both the escalator and the stairs. The graphs also show how the algo-rithm estimated the number of people throughout the day. The graph on the left shows a weekday, and the graph on the right shows a weekend. 60
5-6 Graphs showing the typical traffic flow through Kendall outbound for both the escalator and the stairs. The graphs also show how the algo-rithm estimated the number of people throughout the day. The graph on the left shows a weekday, and the graph on the right shows a weekend. 62
5-7 Graphs showing the typical traffic flow through Davis for both the escalator and the stairs. The graphs also show how the algorithm estimated the number of people throughout the day. The graph on the left shows a weekday, and the graph on the right shows a weekend. . . 64
5-8 Intervention sign (original Brownell study [8] with escalator heart
5-9 Stair usage percentage for weekdays before and after the intervention in Kendall inbound. Stair usage increased from 39.3% to 43.7% (p < .0 0 1). . . . . 66
5-10 Stair usage percentage for weekend days before and after the
interven-tion in Kendall inbound. Stair usage increased from 23.0% to 26.0%
(p < .001) . . . . . 67 5-11 Stair usage percentage for weekdays before and after the intervention
in Kendall outbound. Stair usage increased from 38.8% to 39.6% (p < .0 15 5). . . . . 67
5-12 A comparison of the view of the signs from the turnstiles in both
Kendall inbound (left) and Kendall outbound (right). The top of the sign in Kendall outbound is obscured. . . . . 68 5-13 Stair usage percentage for weekend days before and after the
interven-tion in Kendall outbound. Stair usage increased from 21.8% to 24.6%
(p < .00 1). . . . . 69
F-i The cumulative traffic through Kendall inbound on 7/27/03. The es-calator has a barrier in front of it until 11:25 am. . . . . 98
F-2 A cone is placed in front of the escalator on 7/27/03 which is later replaced by a barrier. . . . . 98 F-3 The cone which replaced the barrier is eventually removed and people
resume using the escalator. . . . . 99
F-4 The cumulative traffic through Kendall inbound on 7/28/03. The es-calator was broken until 7 pm. . . . . 99 F-5 Workers arrive to fix a broken escalator and put a barrier in front of
the entrance on 7/28/03. . . . . 100 F-6 The barrier is removed, but the workers continue fixing the panel in
front of the escalator on 7/28/03. . . . . 100 F-7 The escalator is eventually fixed on 7/28/03. . . . . 100
H-1 Video annotating software. The control panel on the left has speed and position sliders, buttons to annotate people going up the escalator, down the stairs, and up the stairs, and a pause button. The panel on the right shows the video. . . . . 108 J-1 Letter from the MBTA giving permission to perform experiment in
List of Tables
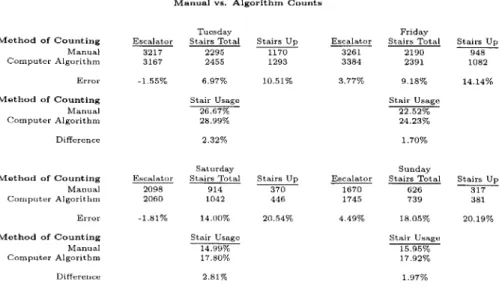
5.1 Table showing the manual vs. automatic counts for 4 days at Kendall inbound. For each day, the stair use percentage for manual counts and automatic counts is also shown. . . . . 58 5.2 Table showing the manual vs. automatic counts for 4 days at Kendall
outbound. For each day, the stair use percentage for manual counts and automatic counts is also shown. . . . . 59 5.3 Table showing the manual vs. automatic counts for 4 days at Davis.
For each day, the stair use percentage for manual counts and automatic counts is also shown. . . . . 61 E. 1 Table showing the threshold values used in both Kendall stations and
D av is. . . . . 95 G.1 Table showing the counts collected in Kendall inbound and outbound
during the intervention period. . . . 104
G.2 Table showing the counts collected in Kendall inbound and outbound
Chapter 1
Introduction
1.1
The Need for Preventative Health
Technolo-gies
As a result of the baby boom in the 1940's and 50's, the percentage of the world's population over 60 is projected to more than double in the next 50 years
[23].
An already overwhelmed health care system needs to prepare for the burden of an ex-panding elderly population. Encouraging healthy habits and investing in preventative health care could be a major factor in combating this problem.One way to contribute to the goal of creating healthier lifestyles is to encourage exercise in public spaces. The Surgeon General has endorsed a Centers for Disease Control recommendation of 30 minutes or more of moderate intensity exercise every day [32]. Incorporating exercise into daily routine makes achieving that level of daily exercise easier, because people do not have to build time specifically for exercise into their schedules. Point-of-decision messages can inform people of choices that lead to easy exercise and ecourage healthier behavior. Stair usage is a good example of this type of activity [8, 25, 20, 7, 6, 3]. Additionally, stairs are present in many public spaces, and climbing a set of stairs produces a similar expenditure of energy to aerobic dancing, bicycling, or in-line skating per unit time [1].
simple, static presentations of information. However, new technologies show promise to increase the relevance and effectiveness of "just-in-time" messaging by monitoring and responding to events as they occur [18]. The looming health care crisis is creating a need to study how to encourage healthier lifestyles and keep the aging population out of doctor's offices. Incorporating sensing and display technology into environments potentially provides an inexpensive way to positively affect the behavior of large numbers of people.
1.2
Measuring Behavior in Public Spaces
By creating artificial environments to perform behavioral experiments, an element of
bias is introduced to any experiment. Brownell et al. ran one of the first studies to examine the impact of "just-in-time" messages on physical activity in real environ-ments [8]. In many situations, it is possible to discreetly observe people's decisions in a natural environment. For example, when an escalator and staircase are placed side by side, people have the option of two methods of ascent. By observing this choice, a researcher can determine patterns of physical activity in a non-laboratory setting. This type of experimental design allows a researcher to observe thousands of subjects at intervention points to collect statistically significant data on point of behavior messaging and motivation of physical activities.
Brownell et al. [8] determined that an intervention in the form of a small sign encouraging stair use placed at the base of stair/escalator pairs in a commuter station, bus-terminal, and shopping mall led to an increase of nearly 7% in the number of people taking the stairs during the intervention period. Additionally, this increase in stair usage lasted up to three months after the intervention had been removed. These results inspired many similar experiments that studied the effects of interventions on stair usage because of the potential for a cost-effective way to make a large impact in people's behavior. Studies using signs [25, 26, 6, 3, 9], stair-riser banners [20], and artwork and music [7] as interventions all found increases in stair usage from 2% to
While these studies have shown new ways of generating behavior change in public spaces, none of them have demonstrated new ways to measure this change. Even though the interventions in these experiments are cost effective, the actual exper-iments are expensive to perform. In nearly all experexper-iments human observers have manually counted each person's decision on choosing the stair or escalator. Conse-quently, research that attempts to study behavior changes over long time periods or in multiple locations becomes difficult. When measurement requires a human observer, examining how the impact of an intervention wears off and the long-term habituation of healthier behavior becomes costly. However, in this work, technology is developed that can replace direct observation with automated monitoring. The flat cost of an automated system for observation means longer studies are only marginally more ex-pensive in both time and money than short studies. Additionally, a well designed system could easily be moved to a different location to make future experimenta-tion easy. Most importantly, automated monitoring creates the opportunity to study context-sensitive and dynamic interventions.
1.3
Contributions of This Work
This work uses computer-vision based people counting and video projection to au-tomate the process of behavior change experimentation in public spaces. With this system, the impact of multiple motivational messages on influencing active behavior
in public spaces can be compared. Further, studies can run for any length of time with little incremental cost in dollars or labor. A computer vision algorithm for counting people crossing a line is presented that has been tested in 3 public transit locations. The algorithm does not rely on a specific camera angle and has shown consistent performance in the presence of natural lighting and multiple occlusions. This system can be easily installed in different public spaces with little to no modification required in the hardware or software. This technology will enable new public health studies on the impact of "just-in-time" messaging on behavior in public spaces.
Chapter 2
The Problem
2.1
Motivating Behavior Change in Public Spaces
The study that inspired this project and all preceding stair studies was performed over 20 years ago by Brownell et al
[8].
The original experiment was designed to monitor physical activity in natural settings and see what effect a small sign might have on this activity. Subjects were observed making a choice between adjacent stairwells and escalators in a Philadelphia area shopping mall, train station, and bus station. This first study found that a .9 by 1.1 meter poster encouraging stair use placed on an easel at the base of the stairs/escalator (see Fig. 2-1) increased stair usage from 5.3% to 13.7% in the first trial and from 7.1% to 15% during the second trial. A location specific effect was also seen in the trials. A larger number of people used the stairs at a shopping mall location than at two commuter stations (train and bus) during the baseline phase. Additionally, the increase in stair usage at the shopping mall was higher (10.2%) than at the train station (7.1%) and the bus station (4.7%).These results led to a follow-up study examining the effects of repeated exposure and long term effects of an intervention. 24,603 total observations were made at a commuter station in downtown Philadelphia on weekdays from 7:30am to 9:00am. First, a baseline observation was made for 5 days, followed by 15 days of intervention. Afterwards the intervention was removed and observation remained for a 10-day pe-riod. There was then a 5 day follow up with no intervention one month and three
Figure 2-1: The motivational sign used by Brownell et al. in their original stair study
[8].
Or ftqI;
rk i5 14MMMV
Figure 2-2: Results scanned from the Brownell et al. follow up study [8] showing an increase in stair usage during intervention that returned to slightly above baseline in
months later. Stair use was observed to have increased 11.6% to 18.3% from the base-line to intervention period. In the week after intervention, the usage level remained elevated at 15.5% and one month later was still at 15.6%. After 3 months, stair usage had returned to near baseline at 11.9% (see Fig. 2-2).
This experiment showed that an inexpensive sign can significantly increase the amount of physical activity performed in public spaces. Brownell et al. observed that past research has shown 30-50% of persons starting a rigorous exercise program stop before finishing. An even larger number do not completely adhere to the exercise program
([4,
33] as reported in [8]). Large scale changes in behavior are hard toinstitute, but Brownell's study has shown that small changes are easy to initiate and maintain by minor modifications to public spaces. Simple, clearly-stated messages can be added to environments without creating disruption in traffic flow. When properly placed, the messages present information about an upcoming decision at the moment of choice. People moving through the station are alerted to the decision they can make and given an incentive to take the stairs (it is healthier), and a small behavior change is created. Over time an attitude change can occur leading people to identify other small changes they can make towards a healthier lifestyle. More research on point-of-decision messaging in public spaces may lead to environments that encourage healthy behavior.
2.2
Scenarios for Proactive Messaging
In the near future, distributed computing techniques combined with smaller and more prevalent sensing technology will enable both public and private spaces to be outfitted with proactive messaging technologies.
For example, suppose an office worker is on a bus commuting to work. He pulls out his PDA/cellualar phone device and makes a call. After he finishes his call, the device immediately vibrates, and he glances at the screen. "Take the stairs when you get to the office" is displayed on the screen. Because the worker has just finished a phone call, he is not interrupted from another task. The PDA determined that based on
Figure 2-3: Everywhere Display providing information about energy use. the time, GPS location information, and the worker's typical schedule that he would likely arrive at work in the next few minutes. The ability to present information without creating an interruption is exploited to present a "just-in-time" reminder to motivate physical activity.
In addition to personal devices being able to recognize behavior and provide feed-back, display technologies embedded in environments will be able to better convey these messages. For example, the Everywhere Display [22] is a device that can project information onto any flat surface in a small room without perspective distortion. This technology can be used to provide messages in the home environment intended to modify behavior. For example, many people do not know the amount of energy used
by common electrical devices such as lamps or how much money they could save by
switching to energy efficient bulbs. With the Everywhere Display, when a homeowner turns on a lamp, he can be informed of this information in an unobtrusive way (see Fig. 2-3) that may gradually help the homeowner learn the consequences of small decisions. By presenting messages with useful information at appropriate times, the computer system may encourage the occupant to adjust behaviors, such as switching to energy efficient bulbs.
2.3
A New Opportunity
Using computers and technology presents a new opportunity to motivate behavior change in an effective and inexpensive manner. Previous studies have already shown that simple messages displayed at the right time and place can influence behavior in public spaces [25, 26, 6, 3, 9]. However, this research has focused on static messages
that do not change based on the surroundings. The scenarios previously described suggest that using current (or soon to be available) technology, computer systems will have the capability to present "just-in-time" context-sensitive feedback to users with the goal of motivating behavior change. The ability for computers to persuade is a new research area. BJ Fogg has identified seven topics that further research on captology 1 needs to explore, five of which are directly examined by the work in this thesis [11]:
* Interactive technologies that change behavior
* Adapting theories and frameworks from other fields
" Using interactive technologies that are specialized, distributed, or embedded
" Using technologies where the designer's goal is to persuade
* Focusing on "what is" and "what could be." This means not only focusing on potential persuasive methods, but also exploring technology with respect to current persuasive techniques.
Using sensors to detect context and new display technologies (whether built into PDA/phone-like devices or embedded into the environment), researchers can study "point of decision" messaging where interventions are personalized to individuals and their activities. For example, if a system notices that the escalator has become very crowded but the stairs remain empty, it can change the message that is displayed to passers-by. Instead of a 'Take the Stairs" message, a new message stating "Save time, don't wait for the escalator, take the stairs" can be displayed. This ability to tailor messages to decisions as they occur is what makes "just-in-time" messaging so potentially powerful for affecting behavior.
1
2.4
Measuring the Impact of Technology on
Be-havior
Most previous studies on "just-in-time" messaging to motivate physical activity have used large amounts of man power to observe behavioral choices in real environments. Sensing technologies can greatly reduce the man power required and enable context-sensitive interventions. The ability to tailor messages to specific situations as they occur has the potential to significantly increase the impact of a behavior change message presented in a public space.
In past stair studies, a person had to be physically present to count each usage of the stairs or escalator. For a transit station that is open 20 hours a day, that would require 140 hours of labor to collect data for just one week. This type of comprehensive measurement is prohibitively expensive. Many previous stair studies only observed stair usage for 1-2 hours a day [6, 8, 9, 19, 20, 25], while a few made observations up to 5 hours a day [7, 26].
The system described in this thesis allows for studies that explore some of the currently unknown attributes of point of decision interventions. Because the system contains a computer that, in conjunction with sensors, can monitor the environment, the effect of altering messages based on an environmental situation can be observed. Studies can cost-effectively examine the effects of messaging over periods of time longer than a year. The effects of different types of messages can be examined without manual intervention in the study.
Chapter 3
Theory and Rationale
3.1
Point of Decision Messaging
Studies involving point of decision messaging have primarily focused on workplace production or preventative health. Regardless of the target population, the research shares a common goal of providing information to people at the proper time to influ-ence their behavior. In both areas of application, point of decision information has been shown to be a useful tool.
For a system to be effective in motivating behavior change, it needs to present messages that are easy to understand at the right time and place in a non-annoying way. Display technologies such as the Everywhere Display [22], portable displays on cell phones, and embedded LCDs can be used to display the messages. Conveying appropriate messages at the right time requires sensing technology that can deter-mine the context of how the user's actions or activity in the environment may effect behavior. By combining sensing and display technology, the full potential of "just-in-time" messaging can be achieved. Advanced technology is not a necessity for point of decision messaging. Studies using simple technology have created an improvement in safety in the workplace [21, 14], encouraged seat belt use [12], increased public recycling [12, 13], and reduced electricity consumption [38, 29].
For example, in an attempt to improve healthy decisions at grocery stores, the Pawtucket Heart Health Program attempted to use point-of-purchase labels as part
of a larger community interaction designed to prevent cardiovascular disease [17]. Over four years from 1984 to 1988, they placed labels in four different supermarkets identifying foods as "low-fat," "low-sodium," "low-fat, low-sodium," and "fat ratio OK." Once a year, exiting shoppers were randomly selected and those that had made a purchase were asked if they had seen one of four sets of labels in the store. Those that correctly identified the labels were asked if they were encouraged to purchase the labelled foods. Awareness of the labels increased from 11% to 24% over the course of the study and the percentage of people who said they were motivated to purchase labelled foods increased from 36% to 54%. From these results, the authors of the study estimated that 636 people per week were encouraged to purchase the labelled products.
3.2
Previous Stair Studies
As a follow up to Brownell, Stunkard, and Albaum's [8] original study involving point-of-decision intervention for stair usage, researchers have studied the impact of other types of motivational messages. Blamey, Mutrie, and Aitchison performed a similar study that produced comparable results overall [6]. In their study, conducted in a Scottish underground station, an increase from 8% baseline stair use to 15-17% stair use during intervention was seen. Multiple signs saying "Stay Healthy, Save Time, Use the Stairs" were posted for 3 weeks. Observations were made for an additional 2 weeks and then again after 4 weeks and 12 weeks. The researchers used stepwise logistic regression with stair/escalator usage as the response variable and subject sex, week of study, and their interactions as explanatory factors. The results showed that men were more likely to take the stairs at all times (12% baseline and 21% intervention vs. 5% and 12% respectively for women) and stair usage still remained elevated 12 weeks after the intervention. A downward trend over the weeks after the intervention suggest that stair usage my eventually reach baseline levels again. The overall trends seen in this study match the results of Brownell et al. [8]
in the predominantly Hispanic community of El Paso, Texas [9]. Their results did not show a significant improvement in stair usage when using an image promoting health "for the life of your family" compared to a promotional image targeted at individuals. They did find a wide variety of variance across their intervention sites. While stair usage increased among women at all sites, stair usage by men actually decreased at a public library and office building. At both these sites, subjects were choosing between an elevator and stairs (leaving more time for those planning on taking the elevator to make a decision). Additionally, a larger percentage of people were already taking the stairs during baseline. This indicates future exploration might be needed when determining how baseline stair usage and the time available to make a decision affect the results of point of decision motivation. The study noted similar increases in stair usage to other prior work [3, 6, 8, 7].
In a study conducted in a Baltimore/Washington D.C. area shopping mall, Ander-sen et al. examined if messages targeted at health-promotion or weight-control had a differing impact on the stair/escalator choice [3]. Overall, they did not determine a significant difference between the two signs because stair usage increased from 4.8% at baseline to 6.9% and 7.2% respectively for the health and weight-control signs. However, they did notice a difference in stair usage among ethnic groups. The signs did not cause any significant increase in stair usage for black shoppers.1 Additionally, in contrast to Brownell et al. [8], they found baseline stair usage for those under and over 40 was equivalent. They did find that stair usage increased more for the older group than the younger group. For those over 40, stair usage increased from 5.1% to 8.1% with the health-benefits sign and 8.7% with the weight-control sign. For those under 40, usage increased from 4.6% to 6.0% with the health-benefits sign and
6.1% with the weight control sign. While this study confirmed the observation that
obese persons take the stairs less during the baseline phase noted in [8], it showed no difference between the two groups during intervention phase. The study also found that obese subjects increased their usage of the stairs slightly more with the weight control sign (7.7%) as compared to the health-benefits sign (6.3%) from a baseline of
3.8%. These results indicate that for certain groups, targeted messages may improve
stair usage compared to more general messages.
Russell, Dzewaltowski, and Ryan decided to use messages that discourage the use of an elevator instead of encouraging the use of the stairs in their research [25]. During their intervention, they placed a 20cm x 20cm sign reading "Elevator for physically challenged and staff use only, others use stairs please" near the elevator. Over the 5-week intervention phase, stair usage increased from 39.7% at baseline to 41.9% during the intervention. When the results were examined by sex, men had a significant increase in stair usage (42.4% to 45.9%) while women did not show a significant increase (35.1% to 36.7%). Additionally, stair usage actually decreased on Fridays (36.1% to 28.7%) during the intervention phase. This anomaly is potentially explained by a larger number of staff in the library on Fridays relative to students. Unlike the prior study of Anderson et al. [3], subjects over 30 years of age did not show significant increase in stair usage. However, more staff members fit into the above 30 category, and the intervention was not directed at staff.
Russell and Hutchinson continued the previous study by comparing the impact of deterrent to health-promotion prompts in a regional airport in the mid-western United States [26]. The health promotion sign had an image of a fit looking heart and the text "Save time, keep your heath healthy, use the stairs," while the the deterrent sign featured the text "Please limit escalator use to staff and those individuals unable to use the stairs" and a picture of a businessman using the stairs. In this study there was no significant difference between the types of interventions with an increase from 8.2% at baseline to 14.9% and 14.4% with an encouraging sign and deterrent sign respectively. When broken down by sex, they found that both younger and older women exhibited higher stair usage than their male counterparts (although young males used the stairs more than older females) contrary to the results of their prior study.
Kerr et al. examined the effects of stair-riser banners over a six-month period in a United Kingdom shopping mall [20]. The banners contained the phrases "Keep fit,"
"Be active," and "Exercise your heart." The message "Take the stairs" appeared on
3 banners. A previous study by the same authors had shown banners placed all the
way up the stairs to be be more effective than a simple sign placed at the base of the stairs [19]. In the six-month study, results similar to Brownell et al. [8] were noted. Stair usage increased during the intervention phase from 5-12% (depending on the group) and then gradually declined to a level that was 2-5% above baseline after the intervention was removed. The effects of the intervention were not the same across different age and sex groups. In the initial six weeks of intervention, women's stair usage increased more than men's usage. In the second six weeks of intervention, men under 60 years of age maintained their increased stair usage, while women under
60 years of age showed a decrease in stair usage (although still elevated compared to
baseline). For both men and women over 60, stair usage continued to increase over the second six week intervention period. Across all groups, stair usage remained elevated compared to baseline over the entire ten week follow-up period. These results suggest the importance of long-term studies examining how people change their responses to interventions. The researchers also determined that stair usage increased as the overall traffic over the stairs/escalators increased. This effect was taken into account in the results of their study.
Titze et al. utilized both manual counts and automated counts over six office buildings in Switzerland [36]. The manual counts were done by an observer known to subjects, and the automatic measurements were recorded by a break-beam sensor on the stairs and an open/close counter on the elevator doors. Two of the buildings had to be removed from the study: one because of automated counting malfunction, and one because of abnormally high percentage of people taking the stairs during baseline
(95%). The study utilized a wide variety of interventions including offering fruit and
games of chance to those who took the stairs. The intervention period lasted for four months. Overall, the study found an increase from 61.8% baseline stair usage to
67.1% stair usage when using manual counting. The automatic counting saw a small
increase from 68.8% to 71.4%, but this was not statistically significant. Additionally, the pattern of stair usage recorded by automatic sensors was not consistent with
manual counts. Possible reasons for the poor results of the automatic counting include observational bias (the subjects were aware of the manual counts), people testing the stair sensor during baseline, and the inaccuracy of both the stair and escalator counting systems. For instance, the escalator sensor could not count how many people were in the elevator, but simply door openings and closings. The break beam sensor had an occlusion problem where multiple people could walk through only breaking the beam once, or one person could walk through breaking the beam several times. Two important issues were raised by this study. First, inexpensive interventions were shown to have a significant impact on stair usage. Additionally, simple methods of automatic counting using mechanical means were shown to be ineffective in practice.
A well-designed computer vision algorithm could perform much better than a break
beam sensor or open/close door counter. Finally, a large difference was noted in the baseline stair usage among the four buildings. Baseline stair usage was highest in the newest buildings which contained well lit, attractive, and short sets of stairs. The lowest baseline usage occurred in an older building with poorly lit staircases and a large number of stairs between landings. These results indicate that the visual appeal of stairs can impact their usage.
Another study by Boutelle et al. examined the effects of making the stairs more aesthetically attractive in an 8-story building on the University of Minnesota campus
[7]. There were two intervention phases in this study. The first consisted of signs
encouraging people to "take the stairs for your health," while the second consisted of artwork placed in the stairwells and music that was audible throughout the entire stairwell. Signs alone encouraged an increase in stair usage to 12.7% from a baseline level of 11.1%. The music and artwork in addition to the signs led to even a higher percentage of stair usage at 15.5%. Because the music and art in the stairwell were regularly changed, the increase may have partially been from an interest in the change, not the actual aesthetic appeal of the modified stairs.
3.2.1
Observations on Previous Stair Studies
Many of the studies discussed previously saw the effects of signs vary over different age groups, different sexes, and different ethnic groups. For the purpose of this thesis, only the overall effects of the sign are being examined. In all of these studies an overall increase in stair usage ranging from 2.1% to 9% was seen. An overall increase in stair usage within that range was expected in the Boston area subway stations.
3.3
People Counting Algorithms
Work on the problem of counting people using computer technology ranges from prototype systems tested only in labs to systems that are used in real-world environ-ments. The Spanish Railway Company did a market survey of several methods of people counting, as reported by Albiol, Mora, and Naranja [2]. Mechanical counters such as turnstiles are very accurate. However they create a barrier to traffic flow. In most places, such barriers are impractical. For instance, the Metro Boston Transit Authority (MBTA) did not want the counting method to obstruct people as they exited the station. Break-beam sensors do not impede exiting passengers, but they have an occlusion problem. If the break-beam is broken while multiple people walk through, there is no way to determine how many people passed during that time. Ad-ditionally without a complicated multiple beam setup, there is no way to determine the direction of passing. Differential weight systems and sensitive carpets can be accu-rate, but they require heavy modification of the environment and significant amounts of maintenance. They also do not provide an easy way of determining directionality of passers-by. None of these systems provide the accuracy necessary for experimentation without requiring heavy modification to the environment or impeding traffic.
Computer-vision based people counting offers an alternative to these other meth-ods. One of the common problems all computer vision systems face is having to separate people from a background scene. Several proposed counting systems use multiple cameras to help with this process. Using stereo differencing and an overhead camera view, Terada et al. [34] created a system that can count people and determine
direction of movement as they cross a measurement line. The top-down view avoids the problem of occlusion as groups of people pass through the camera's field of view. Their system also uses a space-time image to help determine directionality. However, the system was only tested with 43 people in a controlled environment (lobby of an office building). No error rates were given. Additionally, occlusion is dealt with by requiring a specific camera angle.
Beymer and Konolige also use stereo vision in people tracking, but they relax the camera position restrictions of Terada et al [5]. Their system uses continuous tracking and detection to handle occlusion. Template based tracking is able to drop detection of people as they become occluded, eliminating false positives in tracking. However, when a person is no longer occluded, they are detected as a new instance. This method of handling occlusions would lead to double counting in the stair/escalator application. Additionally, the performance level quickly drops as the number of people and occlusions in a scene increase. With a small test set of 5 people and 28 occlusions a tracking rate of 70% was achieved.
Hashimoto et al. tackle the problem of people counting using a specialized imaging system of their own design [16]. Using IR sensitive ceramics, mechanical chopping parts, and IR-transparent lenses, they developed an array based system that could accurately count passers-by at a rate of 95%. The system uses background subtraction to create thermal images that are then analyzed. This system was not considered appropriate for the stair/escalator counting because it requires a direct overhead view of the point of passing that cannot be obtained in locations with typical ceiling heights. Additionally, the system requires a distance of at least 10cm between passing individuals to properly count them as two separate people, and large movements from arms and legs were seen to create problems in counting. The high density traffic that occurs when a mass of people exit a rush hour train would likely lead to significant counting error in this setup.
Tesei et al. use image segmentation and "long-memory" to track people and handle occlusions [35]. Background subtraction is used to highlight areas of interest (blobs)
Using features such as blob area, perimeter, bounding box area, height and width, mean gray level, and center position, the blobs are tracked from frame to frame. By keeping track of this information over time, the algorithm handles the merging and separation of blobs that occurs from occlusion. By storing information about what blobs combined to form a new blob during occlusion, the blobs can be assigned to their original labels when they separate. While some of the ideas from Tesei et al. are used in the people counting system described in this thesis, the algorithm would not be able to handle the occlusion that occurs in the transit station. Many times an people enter the field of view occluded and stay partially obscured until they leave the field of view. The system would have no way of accurately counting when a large number of people exit the station at once.
To improve on background segmentation algorithms, Shio and Sklanksy use extra cues to simulate the perceptual grouping that occurs in the human vision system
[31]. They first calculate motion estimations from consecutive frames and use that
information to help segment people from the background and determine the boundary between people in cases where there is occlusion. They observe that while parts of peo-ple move in different directions, over a few seconds time, all the parts of a person move as a group. The actual segmentation uses a probabilistic object model that incorpo-rates width, height, and direction of difference motion and a merging/splitting step to segment individual people in a moving picture sequence. The paper demonstrates that using extra information such as an object model can improve segmentation and provide a possible way to deal with occlusion. However, this system would likely not perform well for stairs/escalator counting because using motion as a "perceptual-grouping" cue would not help with occlusion when a large group of people are all moving in the same direction at the same speed.
Schofield et al. utilize yet another method for separating people from a background image to determine a count [27]. They train RAM-based neural networks to perform background segmentation and then pass the processed images off to be analyzed. To deal with occlusions and overlapping blobs, the system uses a dynamically adjusted spacing threshold. While the neural network based background segmentation enabled
the algorithm to deal with varying lighting conditions, the algorithm only dealt with counting people within a specific image. Tracking or counting people over time was not considered.
As an alternative approach, Sexton et al. use a simplified segmentation algorithm and manage to get error rates ranging from 1% to 20% in their trials in a Parisian railway station [30]. They use background subtraction with a constantly updated reference frame to isolate people from the background. The resulting blobs are then tracked frame to frame by simply matching blobs with the closest centroids. Much like the previous systems, they use an overhead camera angle to reduce occlusions. Counting performance ranged from 1.5% error to 21% error. Also, larger crowds caused a frame-rate drop while processing leading to a higher error. With much faster processors in use today than those available at the time of this study, frame-rate problems could likely be minimized.
Like Sexton et al., Segen and Pingali concentrate on image processing after seg-mentation
[28].
They use standard background segmentation techniques to isolate areas of interest, and then identify and track features in those areas between frames. The paths of these features are then merged into clusters that represent the motion of a person over time. The paths could be used to determine how many people crossed a particular line in the scene, and in what direction the people were passing. However, their implementation is only tested to run in real-time with up to 8 people in the scene and makes no attempt to deal with occlusions.Haritaoglu and Flickner approach the problem of real time tracking of people to determine shopping groups in stores by using temporal information to improve segmentation and tracking [15]. To segment silhouettes from the background, they adopted a background subtraction model that utilizes color and intensity of pixel values over time to classify pixels as foreground, background, or shadow. The pixels are also filtered over time to remove moving pixels from the background model. Fore-ground groups are then segmented into individual people using temporal and global motion constraints, and individuals are tracked using an appearance model based on color and edge densities. Experimentation using this system was focused on
deter-mining shopping groups and how many individuals make up the shopping groups. Much like other systems that use motion to help with identifying people, a situation in a transit station where a large number of people are moving in the same direction at the same speed will likely give the algorithm trouble.
Conrad and Johnsonbaugh attempt to simplify segmentation and the entire people counting process using an overhead camera. Instead of using background subtraction, they use consecutive frame differencing to avoid the problems of changing illumina-tion. Their algorithm also only examines a small window of the full scene that is perpendicular to the flow of traffic. The window is broken into gates. Using assump-tions about the minimum/maximum width of people and the amount of noise in their images, they are able to determine the number of people in the window at a given time. Using the center of mass of the images in the window over time, they are able to determine direction of travel. They achieved a 95.6% accuracy rate over 7491 people with a quick and simple algorithm. However, they rely on an overhead camera view to reduce occlusion problems, and the accuracy of the algorithm as described would decrease with constant streams of people moving through the window.
Finally, Albiol et al. developed a system to count people in high density traffic exiting and entering a Spanish public transportation train
[2].
Their system uses a camera in a fixed position above the door mechanism on the train itself. While people enter and exit the train, the images that the camera captures are reduced to image stacks (also known as space-time images). Using scan lines, three image stacks are created. The image stacks are images themselves, where each row corresponds to the image data from one of the scan lines on the original image. The horizontal axis of the stack image is the same as the horizontal dimension in the original images and the vertical axis corresponds to increasing time. Instead of background subtraction, a gradient function is used to perform segmentation from the background. Once the train doors close, the image stacks are then processed by a computer as the train moves towards another station.As people move into and out of the train, they leave distinctive "prints" behind in the image stacks. The researchers were able to train a computer algorithm to analyze
these stacks and determine how many people crossed the threshold of the door. To complete the counting, an optical flow algorithm was used to determine direction of passing. Over 149 test stops this system counted 318 incoming passengers and
379 outgoing passengers when the real numbers were 321 and 385 respectively for an
overall accuracy of 98.7%.
3.3.1
Goals of Stairs/Escalator Counter
In the context of creating an automatic people counting system to use in stair/escalator studies, several restrictions were placed on the experimental setup. An algorithm that could handle the large crowds moving through a subway station was the most im-portant goal. Since the algorithm was designed to count people exiting a station, being able to work properly with natural lighting changes was also very important. Additionally, because the system was intended to be placed in several locations it was not possible to require a specific top-down view for the camera to minimize oc-clusion (which requires unusually high ceilings). Finally, while accuracy in counting raw numbers of people on the stairs or escalator was desirable, the ratio of people taking the stairs compared to people taking the escalator was the number the system was most concerned with determining. Stereo camera heads were avoided because the additional depth information they might provide would be unlikely to significantly improve segmentation of large clusters of people.
The idea of training an algorithm to identify prints in a image stack used by Albiol et al. [2] was initially tried in the Boston area subway station. However, the lack of an overhead camera view and occlusion problems created difficulties with this technique. Still, the image stacks were maintained in the final algorithm. The algorithm described in Albiol et al. processes the image stacks as the train travels between stations. The algorithm described in this thesis has to process image stacks while still continually capturing video data. The area of interest also ranges over the entire width of a stair/escalator combination. Additionally, for this work, it was not possible to install equipment on all trains. A device at a fixed location was necessary.
Chapter 4
Design and Implementation
With the preceding goals in mind, a self-contained people counting/message project-ing system was created.
4.1
System Overview
The system is designed to be low profile and easily adaptable to many situations. A housing box was built to protect the equipment inside from the various hazards in a transit station (see Appendix A). The box containing all the system parts is mounted above the base of the stairs and escalator. Passengers leaving a train and walking towards the main exit of the station see a projection of the intervention message on a im x .66m piece of foam core directly above the stairs/escalator (see Fig 4-1). The enclosure was designed to be as discrete as possible and not obstruct the view of the projected sign to passengers exiting a train. As the persons exiting the station choose which method of exit to use, their decision is recorded by a computer vision algorithm running on a laptop connected to a webcam. The counts are aggregated over 10 minute time periods and written to a file on the laptop's hard drive that can later be downloaded via a wireless connection and analyzed off-site. A more complete description of each component follows.
Figure 4-1: The system in Kendall outbound station. The box has a projector to display the sign and a camera directed at the stairs/escalator and connected to a laptop to count passers-by.
4.2
System Components
The first component of the system is a modified Orange Micro Ibot2 USB2.0 webcam. The camera has been removed from its plastic housing and mounted in a turret that allows it to be rotated and moved up or down in viewing angle to accommodate different installation sites (see Appendix B). Additionally, the camera has been fitted with a wide angle lens to allow a complete view of the stairs and escalator (see Fig. 4-2). The camera captures images in YUV format with a resolution of 160x120 at 15fps for processing by the laptop. All autogain and autoexposure features are turned off. The next component is a ViewSonic PJ500 projector that is used to display mo-tivational messages on a foam board sign or wall. The foam board is suspended from the ceiling just above the center of the bottom of the stairs and escalator. The pro-jector displays images at 800x600 resolution with an intensity of 1200 lumens. This is bright enough for good visibility even in a well-lit transit station. The projector also has a serial input that allows it to be controlled by a computer.
Figure 4-2: The view of the stairs and escalator from the Kendall inbound camera
(320 x 240 resolution).
and projector. The computer receives input from the webcam and determines how many people are using the stairs and escalator. The computer stores each day's counts in text files that record how many people pass in each 10 minute period. For each period, the computer also records an image as seen from the camera in jpeg format for future analysis if any inconsistencies are noticed in the count data (see Appendix F for examples). The computer also provides a video source for the motivational messages that are displayed. By connecting the computer to the projector's control port, the projector can be periodically monitored and restarted if it turns off for any reason. The computer is equipped with an 802.11 wireless card which is set up to use an ad-hoc network. This allows a researcher to use another laptop with a wireless card to download data, upload new messages, and debug problems. WinVNC [24] was used to provide remote control of the laptop in the transit station.
Image Acquisition and Pre-processing
Frame Differencing Remo and Upating
Is Motion On Update Background Stairs/ No notin Escalator? Ys Background Subtraction WiCreate Image Stacks Place New Trackers Is Stack > 35
Motior On Stairs/ YsAaleSak Escalator
Write Out Data No Each 10 Min
Figure 4-3: Flowchart describing people counting algorithm.
Figure 4-4: Images from Kendall inbound station with a crowd of people on the stairs and escalator.
4.3
The People Counting Algorithm
Prior work illustrates the difficulty of tracking individual people in the transit station due to the large number of occlusions that occur as high-density groups of people exit the station (see Fig. 4-4). The occlusion problems become even worse when a directly overhead camera view is not available. Therefore, in this work an algorithm is developed that operates on the assumption that each person moving through the frame generates a measurable amount of activity in a difference image. By dynam-ically determining the average activity per person, the total amount of activity can be converted to an estimate of the number of people that have passed through the image. Over the course of a full day with thousands of observations, people who generate more activity and people who generate less activity average out to a number that approaches the actual count.
Fig. 4-3 shows a flowchart view of the algorithm. The individual steps are de-scribed in the following sections.
4.3.1
Image Acquisition and Pre-Processing
Images are acquired in RGB24 format at 160x120 pixels. The camera grabs a new image buffer 15 times per second, and the algorithm requests a new frame whenever it can start processing another frame. The pre-processing consists of convolving a 2x2 averaging matrix with the image to blur the image slightly and help eliminate noise from the background segmentation process.
4.3.2
Frame Differencing
The first step in the people counting algorithm is frame by frame differencing. Con-secutive frames are compared pixel by pixel in the Y, U, and V channels. Differences greater than a threshold (determined at each location by trial and error) are high-lighted as areas of interest in the frame (see Appendix E for details on how to calibrate the system). Frame differencing is useful because areas that have motion from frame to frame are identified, but global lighting changes only show up very briefly. People
Figure 4-5: Real image and corresponding difference image.
Figure 4-6: Real image and corresponding background subtraction image. Note that background subtraction is only performed in areas of interest that are highlighted. moving through the frame typically show up in the difference image as outlines (see
Fig. 4-5).
4.3.3
Background Subtraction
While frame differencing is effective in determining motion, it is not effective in high-lighting foreground objects that are stationary from frame to frame. Additionally, frame differencing has a tendency to only highlight the edges of objects in the fore-ground, which can make image analysis more difficult. Consequently, the algorithm uses a background subtraction [37] step as a supplement to frame differencing.
By examining the stair and escalator area of the difference images over time, the
algorithm can determine when there is no activity in one or both of these regions. Allowance is made for the periodic motion of the escalator by ignoring small amounts of pixels that are highlighted by the differencing. When there has been no activity detected from frame differencing, the current captured image is likely to contain only
![Figure 2-1: The motivational sign used by Brownell et al. in their original stair study [8].](https://thumb-eu.123doks.com/thumbv2/123doknet/14444218.517477/22.918.260.723.147.471/figure-motivational-sign-used-brownell-original-stair-study.webp)