HAL Id: hal-03045541
https://hal.archives-ouvertes.fr/hal-03045541
Submitted on 8 Dec 2020
HAL is a multi-disciplinary open access archive for the deposit and dissemination of sci-entific research documents, whether they are pub-lished or not. The documents may come from teaching and research institutions in France or abroad, or from public or private research centers.
L’archive ouverte pluridisciplinaire HAL, est destinée au dépôt et à la diffusion de documents scientifiques de niveau recherche, publiés ou non, émanant des établissements d’enseignement et de recherche français ou étrangers, des laboratoires publics ou privés.
Relocating single-molecules in super-resolved
fluorescence lifetime images near a plasmonic
nanostructure
Guillaume Blanquer, Bart van Dam, Angelo Gulinatti, Giulia Acconcia,
Yannick de Wilde, Ignacio Izeddin, Valentina Krachmalnicoff
To cite this version:
Guillaume Blanquer, Bart van Dam, Angelo Gulinatti, Giulia Acconcia, Yannick de Wilde, et al.. Relo-cating single-molecules in super-resolved fluorescence lifetime images near a plasmonic nanostructure. ACS photonics, American Chemical Society„ 2020. �hal-03045541�
Relocating single-molecules in super-resolved fluorescence lifetime images near a
plasmonic nanostructure
Guillaume Blanquer1, Bart van Dam1, Angelo Gulinatti2, Giulia Acconcia2, Yannick De Wilde1, Ignacio Izeddin1*, Valentina Krachmalnicoff1*
1
ESPCI Paris, PSL University, CNRS, Institut Langevin, 1 rue Jussieu, F-75005, Paris, France
2
Politecnico di Milano, Dipartimento di Elettronica, Informazione e Bioingegneria, piazza Leonardo da Vinci 32, 20133 Milano, Italy
* [email protected], [email protected]
Keywords: Single-molecule localization microscopy (SMLM), single-molecule fluorescence lifetime imaging microscopy (smFLIM), point spread function (PSF), decay rate, local density of optical states (LDOS), mislocalization
ABSTRACT:
Single-molecule localization microscopy is a powerful technique with vast potential to study light-matter interactions at the nanoscale. Nanostructured environments can modify the fluorescence emission of single molecules and the induced decay-rate modification can be retrieved to map the local density of optical states (LDOS). However, the modification of the emitter’s point spread function (PSF) can lead to its mislocalization, setting a major limitation to the reliability of this approach. In this paper, we ad-dress this by simultaneously mapping the position and decay rate of single-molecules and by sorting events by their decay rate and PSF size. With the help of numerical simulations, we are able to infer the dipole orientation and to retrieve the real position of mislocalized emitters. We have applied our ap-proach of single-molecule fluorescence lifetime imaging microscopy (smFLIM) to study the LDOS modification of a silver nanowire over a field of view of ~10 µm2 with a single-molecule localization precision of ~15 nm. This is possible thanks to the combined use of an EMCCD camera and an array of single-photon avalanche diodes, enabling multiplexed and super-resolved fluorescence lifetime imaging.
Recently, there has been an increasing interest in the use of single-molecule localization-based micros-copy approaches to map light-matter interactions at the nanometer scale.(1), (2), (3), (4), (5), (6), (7), (8), (9) These techniques, initially developed for bioimaging applications,(10), (11), (12) make use of the possibility to precisely localize individual fluorescent emitters based on their far-field point spread function (PSF) and can achieve spatial resolutions in the order of tens of nanometers. In the field of nanophotonics, they are applied to the study of the directionality, rate, and brightness of the lumines-cence of nano-emitters positioned in the near field of metallic or semiconductor nanostructures.(1), (2), (3), (4), (5) ,(6), (7), (8), (9) In particular, measuring the decay rate enables the direct extraction of the local density of optical states (LDOS), which is a quantity crucial for the characterization of light-matter interaction because it depends on the number of optical modes for the decay of a fluorescent emitter enabled by the surrounding environment.(13) The interactions strongly depend on the position of the emitters relative to the nanostructures and the orientation of their dipole moment, making single mole-cules indeed the preferred probes for accurate super-resolved mapping. The downside is that the cou-pling of the emitter to a resonant nanostructure can be accompanied by a strong deformation of the PSF (9),(14) as a result of the joint radiation of the molecule and the structure.(2),(3),(15) The conjugated emission complicates the estimation of the position of the molecule and conventional localization meth-ods can lead to mislocalization of its actual position.(3),(15) Further complexity arises when considering the dipole orientation of the fluorescent probes, which is difficult to control in experiments, but critical-ly affects the interaction strength with the studied nanostructure. To retrieve more accurate information on the molecule’s real position and orientation there is a need for more elaborate approaches, e.g. by considering the polarization of the fluorescence,(2),(16) by deterministic positioning of the emitters by microfluidic flow control,(1) through their attachment to molecular motors,(17) or with fluorescent scanning probe microscopes.(18)–(23)
In this work, we show that by selecting single-molecule detections based on their fluorescence decay rate and the size of the recorded PSF we can separate the contributions of molecules with different di-pole orientations and positions around a densely-labeled silver nanowire (NW). This enables one to probe light-matter interactions for selected dipole orientations and locate their emission in the far field. Importantly, we show that the comparison of the size of the measured PSF with simulations enables one to infer the molecules’ real position. Our method of single-molecule fluorescence lifetime imaging croscopy (smFLIM) constitutes a crucial step towards a general use of super-resolved fluorescence mi-croscopy in the study of light-matter interaction at the nanoscale, and to probe the optical properties of any type of nanostructured environment.
We employ a dual-mode super-resolved fluorescence microscopy method similar to the one which we have described in detail in Reference (8). Importantly, the smFLIM set-up includes now an array of sin-gle photon avalanche diodes (SPADs) allowing multiplexed fluorescence lifetime measurements of up to eight single fluorescent molecules at a time,(24) synchronized with an electron-multiplying charge-coupled device (EMCCD) camera. Inspired by single-molecule localization microscopy (SMLM) tech-niques like photoactivated localization microscopy (PALM)(10),(11) and stochastic optical reconstruc-tion microscopy (STORM),(12) the smFLIM allows the superlocalizareconstruc-tion of individual fluorescent mol-ecules on a nanostructured sample and to simultaneously measure their decay rate. We prepared our samples by spin-coating silver NWs with a mean diameter of 115 nm (Supplementary figure S1) on a glass cover slip and subsequently labeled it with a dense monolayer of Alexa 647 fluorophores. This is done by functionalizing the substrate and NW with biotin, to which streptavidin-Alexa 647 conjugates are attached inside a microfluidic chamber. The sample is then mounted on an inverted microscope and excited through a 100 X, 1.49 numerical aperture (NA) microscope objective in a total internal reflec-tion fluorescence (TIRF) geometry, using a pulsed 638 nm wavelength laser polarized perpendicularly to the NW axis. The fluorescence is collected through the same objective and filtered through an emis-sion filter. The emisemis-sion light is then separated by a 50:50 beamsplitter into a localization path and a fluorescence decay rate path. In that way, we can simultaneously image the PSF of the emitter and ex-tract the associated decay rate (or equivalently its lifetime, which is the inverse of the decay rate). To ensure single-molecule emission in the dense layer of fluorophores, we use a reducing agent in com-bination with an excitation laser to bring the molecules into a photo-inactive state(25) before the start of the measurement. The photoactive state can be temporarily recovered by irradiation with UV light and reaction with molecular oxygen,(26) adjustment of which enables control over the fraction of emissive fluorophores. To properly correlate position and lifetime information, we ensure that only one fluorophore is active in the region conjugated with each SPAD.(8) A major novelty in our setup is the use of a prototype linear array of SPADs. The array has 8 circular pixels with an active diameter of 50 µm and a center-to-center spacing of 250 µm.(24) An array of micro-lenses allows us to effectively collect the photons impinging on a ~240 µm diameter area around each pixel. A crucial aspect is the use of a custom fabrication technology for the SPAD array,(27) which allowed us to attain an excellent combination of high detection efficiency (>30% at 650 nm) and a low timing jitter (< 60ps full-width at half-maximum, FWHM). The use of a SPAD array instead of a single-pixel detector has the advantage of extending the field of view (FOV) to ~10 µm2, making this single-molecule lifetime imaging ap-proach compatible with extended nanostructured samples, complex distributions of nanoparticles or biological systems. The fully parallel readout electronics associated with the array,(24) allows us to
per-form a time-correlated measurement simultaneously on each SPAD. By correlating the intensity bursts recorded by the SPADs with the events detected by the EMCCD camera, the fluorescence decay rate can be associated with the spatial position of the fluorescent event with a subwavelength spatial resolution.(8)
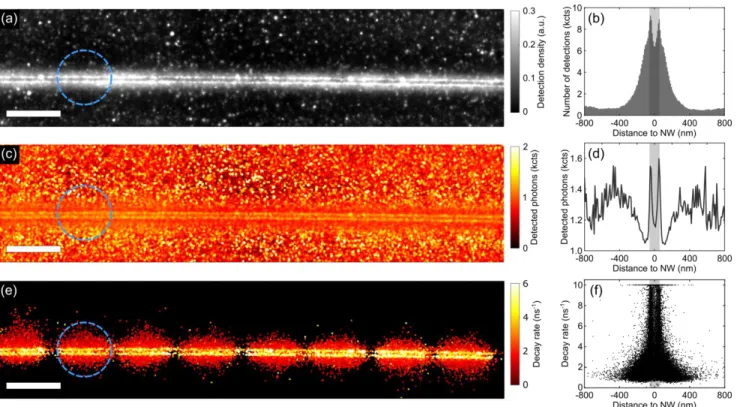
In a typical experiment, we acquire ~37∙104 images with on average ~14∙103 single molecule fluores-cence events per μm2. About 7∙103 events per μm2 are associated to their fluorescence decay rate on the sample area seen by the SPADs. The position of each single-molecule event is estimated by fitting the corresponding PSF with a 2D normal distribution, as is commonly done in SMLM. From the position coordinates of each event and the associated decay rate, we can reconstruct a series of subwavelength maps. We first reconstruct a detection density map around a selected silver NW as shown in Figure 1a. The NW is clearly distinguishable as it is characterized by a ~10 times larger density of detections than on the substrate. Interestingly, the NW seems split along its axis by an area of low detection density compared to the sides of the wire.(8),(9) This is more apparent when we plot the number of detections as a function of their distance, d, to the NW axis in Figure 1b, with d>0 (d<0) corresponding to events detected on the upper (lower) half of the super-resolved maps. Around the expected edges of the NW (shaded area), two sharp features are clearly visible, separated by an area of lower density on top of the NW. This results from the excitation field enhancement by the NW, which is primarily confined to the sides when the excitation polarization is perpendicular to the NW (see supplementary Figure S2a). Upon rotation of the excitation polarization direction by 90°, resulting in a field enhancement confined to the top of the wire, the splitting of the density profile disappears (see supplementary Figure S2b). Besides the sharp features around the sides of the NW, we also observe a broader feature in the density profile extending up to |d|~300 nm outside of the NW. This could be related to the enhanced excitation of di-poles located next to the NW on the substrate, or to mislocalization of the molecules’ emission on the NW due to coupling to the plasmonic structure, as has been observed for silver NWs previously(2),(9),(14). Further analysis of the decay rate information and PSF will allow us to separate the different contributions to this profile shape.
Figure 1c shows the map of the detected number of photons for each molecule before photobleaching. Molecules on the NW are characterized by a slightly enhanced photon number per molecule (~1200-1600 counts) with respect to its direct vicinity (~1050 counts), and are not significantly enhanced with respect to the substrate, far away from the NW. The profile of the number of detected photons shown in Figure 1d, obtained by averaging Figure 1c along the wire axis, also shows two sharp features around the expected edges of the NW. Interestingly, the broad feature observed in the density profile further away from the NW (Figure 1b) coincides with a decreased number of emitted photons per molecule
compared to the substrate (Figure 1d). The shape of this distribution is the result of a subtle interplay between non-radiative effects, spatial variations of the local excitation field, modification of the far-field radiation pattern for different dipole orientations of the detected molecules, and their consequent mislocalization. Disentangling the contribution of each phenomenon can result in a cumbersome task requiring a number of hypotheses. Conveniently, our approach gives us direct access to the decay rate of each emitter, providing additional valuable information for the characterization of the electromagnetic environment of the NW.
Figure 1. Super-resolved images of single-molecule fluorescence lifetime imaging microscopy (smFLIM) around a silver
nanowire: Reconstructed super-resolved (a) density; (c) fluorescence photon count per molecules and (e) fluorescence decay rate maps (scale bar represents 1 µm). The images are reconstructed from ~5.105 single-molecule detections, where each pixel in the map represents the weighted average value obtained over nearby detections. For a typical single-molecule detec-tion, the localization precision is ~15 nm, with ~620 photons detected on the SPAD, leading to a precision of the decay rate estimate of ~8% (Figure S3), as given by Fisher information theory (28). The smaller area in which events are observed in panel (e) results from the fact that the FOV associated with the SPADs in the SPAD array is smaller than the EMCCD’s FOV, as indicated for one SPAD by the blue dashed circle. (b) Histogram of the number of single-molecule detections aged along the NW axis vs. distance to NW axis; (d) Number of detected photons per molecule vs. distance to NW axis aver-aged along the NW axis; (f) Distribution of the single-molecule decay rate against the distance to the NW axis. The gray shaded area in each panel indicates the NW diameter (~115 nm) estimated from SEM measurements.
To directly access the LDOS induced by the wire, we use the decay rate information obtained from the SPADs. This is done by correlating the events detected simultaneously on the EMCCD and SPADs de-tectors to reconstruct a decay rate map, shown in Figure 1e. Here, the color of each pixel indicates the
weighted average of the decay rate of nearby events, each represented by a 2D normal distribution with a standard deviation given by the typical localization precision of a single molecule detection of ~15 nm. By making use of an array of SPADs we are able to significantly extend the field of view (FOV) with respect to a single point detector (dashed circle), enabling the decay rate mapping of the NW over ~10 µm2. The sample areas seen by each of the 8 detectors are visible in Figure 1e, with one of them highlighted by a dashed blue circle. The majority of molecules close to the NW are characterized by a decay rate enhancement with respect to the molecules far away from the NW, as expected for emitters in close proximity of a metallic structure. The distribution of the decay rate versus the distance to the NW is shown in Figure 1f. Close to the NW, we observe a large spread in the decay rate, with values ranging from 1 ns-1, i.e. the decay rate in the absence of the NW (Figure S4), to 10 ns-1, which is imposed pre-dominantly by the laser pulse duration preventing us from measuring higher decay rates. Events occur-ring further away from the NW, 60 nm < |d| < 300 nm, are characterized by a lower decay rate with a median value of 1.6 ns-1, suggesting that molecules contributing in this area do not experience a signifi-cant LDOS modification. Far away from the wire (|d|>300 nm) we obtain the decay rate distribution in the absence of the NW with a median value of 1.3 ns-1 (Figure S4).
Numerical simulations We consider the sample labeled with an isotropic distribution of fixed dipoles
(9). As it will be shown in the following discussion, the good agreement between data and simulations supports the validity of this hypothesis.
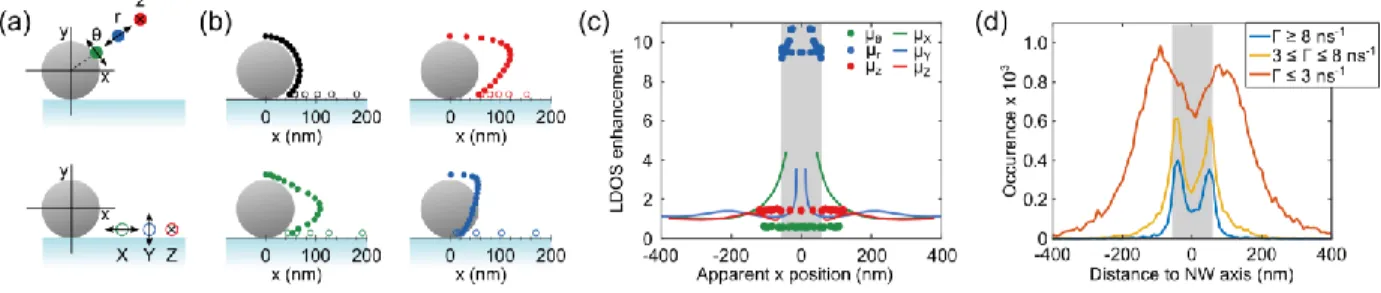
To separate the different dipole contributions in our smFLIM measurements, we carried out finite-difference time-domain (FDTD) simulations using the numerical solver Lumerical. We simulated the radiated field for dipoles placed at different positions around the NW at a separation of 10 nm from the wire, corresponding to the estimated length of the biotin-streptavidin conjugate. The simulations are performed for any xy position of the emitters around the NW (see Figure 2a,b), with y in the direction of the optical axis and x parallel to the substrate. Due to the 4 potential binding sites of streptavidin to bio-tin,(29) our labeling method is unlikely to yield a preferential orientation of the Alexa 647 fluorophores. Hence, we consider all the 3 principal cylindrical dipole orientations for molecules attached to the NW, i.e. radial , azimuthal and coaxial (Figure 2a, closed symbols) and the 3 principal Cartesian dipole orientations on the substrate next to the NW: , and (Figure 2a, open symbols). Interestingly, our simulations reveal that the excitation intensity of azimuthally oriented dipoles is more than 2 orders of magnitude lower than that of coaxially and radially oriented dipoles (Figure S5) and the emitted intensity captured by the microscope objective a factor ~5 and ~50 times lower, respectively (Figure S6). It is thus reasonable to expect that the molecules on the NW with their
dipole moment azimuthally oriented will not significantly contribute to our measurements as they fall well below our detection threshold. As such, we will not further consider them in the analysis of our experimental data.
Next, we simulated the far-field emission pattern reconstructed in real space as collected by a NA=1.49 lens. The resulting PSFs can be strongly asymmetric depending on the dipole position in the local envi-ronment (9),(14), orientation (30),(31) and position relative to the focal plane of the detection system (32). This shifts the center of mass of the PSF away from the real position of the dipole, leading to its mislocalization. More elaborate fitting models have been suggested to extract positional information beyond the PSF’s center of mass (e.g. for bimodal PSFs (14), but a universal and computationally effi-cient model accounting for all effects and the interplay between them is lacking so far. Therefore, we again used a 2D normal distribution to estimate the center of mass of the obtained PSFs, in the same way as in the analysis of our experimental data. The apparent dipole position obtained in this way is compared to the simulated dipole position in Figure 2b. Here we considered the sample labeled with an isotropic distribution of fixed dipoles (9). As it will be shown in the following discussion, the good agreement between data and simulations supports the validity of this hypothesis. Radially oriented di-poles on top of the wire appear slightly outwards from their real position, whereas they appear more inward when located at the bottom half of the NW (blue points Figure 2b). The mislocalization of the molecule’s position for radially oriented dipoles is limited to below 25 nm. Both the tangential dipole orientations experience a larger shift and appear further away from the NW axis up to d~120 nm. When projecting the NW profile onto the substrate plane, the apparent density of molecules is largest around
d~110 nm and d~120 nm for the and orientations, respectively, compared to around d~60 nm for the
radially oriented dipoles, which remain confined to the actual NW’s dimensions. The dipoles located on glass show a small apparent shift either towards or away from the NW depending on the dipole orienta-tion.
Figure 2. Orientation dependent LDOS: (a) Schematic of the used coordinates system with the three principal dipole
orienta-tions on the NW (closed symbols) and on the substrate (open symbols). The same color code is used in (b) and (c). (b) Di-pole positions used for simulations (black) and the simulated apparent position of the coupled diDi-pole-NW emission as ob-served in the far field (colors). (c) Simulated normalized LDOS as a function of the position of the dipole around and on the
NW. (d) Measured number of detections versus the distance to the NW axis for events with a different decay rate (inset). The decay rate limit of 3 ns-1 is chosen as the maximum decay rate found in the absence of the NW (Figure S4) so that for only molecules are detected that experience an enhancement of the LDOS due to proximity of the NW. The gray shaded area indicates the NW diameter.
To further quantify the orientation-dependent coupling of the molecules, we simulated the LDOS nor-malized with respect to a homogenous medium with a refractive index of n = 1.33. These results are shown in Figure 2c as a function of the apparent position of the dipole. For and orientations, the LDOS modification is close to 1, with even a small inhibition for azimuthally oriented dipoles, due to destructive interference between the dipole and its mirror image in the NW. The LDOS is roughly inde-pendent of the position of the dipole around the NW. Radially oriented dipoles show a stronger cou-pling, as expected for a dipole oriented normal to a metallic interface, with a LDOS enhancement be-tween 9 and 11. Dipoles on glass show oscillations of the LDOS around the value of a homogeneous medium, but with a significant LDOS enhancement only in close proximity of the NW for dipoles ori-ented along the x-axis.
Discussion
The simulations can be used to pinpoint the different dipole contributions in our single-molecule meas-urements. By selecting only the events characterized by a high decay rate, we probe exclusively the di-poles which are radially oriented and are attached to the NW (Figure 2c). For lower decay rates, mole-cules attached to the NW with a coaxially oriented dipole moment are preferentially detected, as well as molecules attached to the substrate next to it. This is shown in Figure 2d, where we plot the number of detections for different ranges of the fluorescence decay rate. Molecules with a high decay rate ( , blue curve) appear mainly within two narrow peaks on both sides of the NW around |d|~50 nm.
Here again, the dip between the two peaks is mainly an effect of the distribution of the excitation field around the NW and disappears upon changing the excitation polarization (Figure S2d). Importantly, the position of these peaks is in very good agreement with the apparent position of the radially oriented di-poles attached to the NW, indicating that we indeed probe the radially oriented molecules. The obtained density profile provides a good characterization of the NW’s size (~115 nm), as the apparent position of the radially oriented dipoles is not significantly affected (mislocalization <25 nm) by the presence of the NW (Figure 2b).
When we select the events with a lower decay rate ( , yellow curve) we observe in
addi-tion to the sharp peaks a broader contribuaddi-tion ranging up to |d|~200 nm. This contribuaddi-tion can be at-tributed to molecules on the NW which appear further away as a result of the mislocalization of their
distorted PSF (Figure 2b) or to molecules further away from the NW on glass, oriented primarily along x-direction, which also experience a LDOS enhancement due to the proximity of the NW and appear around the same x position (Figure 2b,c). For events with a lower decay rate ( , orange curve) the situation is more complex. Most events are observed around |d| ~90 nm, but the distribution is fur-ther broadened, as now also ofur-ther molecular orientations are included, on the NW and substrate, with a decay rate similar to the value in the absence of the NW.
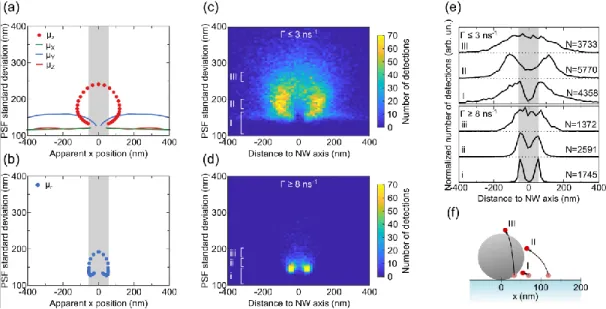
To distinguish the contributions from molecules on glass and on the wire that appear in the region be-tween 60<|d|<300 nm, we finally look at the PSF associated with each detection, which contains infor-mation on the molecular orientation(14) and xyz position of each emitter. In particular, we look at the width of the detected PSF, given by the standard deviation, , of the normal distribution used to localize
the single-molecule detections. For this we simulated the far field emission for every detected dipole orientation and fit the obtained PSFs with a 2D normal distribution in the same manner as our experi-mental data. The PSF standard deviation as a function of the apparent position is shown in Figure 3a,b. Since we are able to isolate the contribution of radially oriented dipoles in our experimental data by selecting events with , we chose to plot the simulation results for radially oriented dipoles in a separate panel (Figure 3b). For radially oriented dipoles, the PSF ranges from 125 to 190 nm, with the largest values found for molecules located on top of the NW. Figure 3a shows that dipoles with an X or Z orientation have the narrowest PSFs with a standard deviation of ~120 nm, while the coaxially oriented dipoles (red closed points in Figure 3a) on the NW have a ranging from 130 nm at the bottom of the NW, to ~240 nm on the top of the NW. The Y-oriented dipoles on the glass have a between 130 and 155 nm. The simulations reveal that the PSF width is intimately linked to the dipole’s orienta-tion and posiorienta-tion, i.e. X and Y coordinates, on the NW. For dipoles attached to the NW, a larger PSF is typically associated with dipoles appearing more towards the top.
Figure 3. Dipole selection via the size of the point spread function (PSF): (a,b) Simulated standard deviation of the PSF for
different dipole orientations around a silver NW for dipole orientations with a LDOS modification smaller than 8 (a), and larger than 8 (b), plotted against the apparent position of the dipole when observed in the far field. (c,d) Experimentally measured standard deviation of the PSF for events with a decay rate (c) and (d). (e) Distribution of the detected events for (I, II, III) and (i, ii, iii) and different ranges of sigma: I, ; II, ; III, ; i, ; ii, ; iii, . Curves are shifted vertically for clarity. Numbers indicate the total number of detected events in each cross-section and the gray shaded areas indicate the NW diameter. (f) Sketch of the real position associated to events with and sigma in the ranges indicated in Figure 3c,e.
The distribution of the standard deviation of the experimentally observed PSFs is shown for low ( ) and high ( ) decay rate events in Figure 3c,d. We observe an excellent agree-ment between experiagree-mental data and numerical simulations. The small offset of ~25 nm in the standard deviation of the PSF can be related to aberrations introduced by the experimental setup, which lead to a slight broadening of the ideal diffraction limited PSF.(33) A similar shift is observed for molecules on glass in the absence of the NW.
It is thus possible to use the strong dependence of the molecules’ PSF and decay rate on the dipole ori-entation and position to selectively study different populations of mislocalized molecules. Moreover, by comparison with simulations the apparent position can be associated with the actual one. To demonstrate this, we plot a histogram of the number of detections for different ranges of in Figure 3e for events with (plots I, II, III) and events with (plots i, ii, iii). To separate the emission of coaxially oriented molecules on the NW from that of X- and Z-oriented molecules on glass, we select the smallest PSFs, by taking the events for which (Figure 3e, I). The highest density of detections is found at the sides of the NW, decaying towards zero for larger separations, as expected for
the decreasing excitation field further away from the NW. At the position of the NW we observe very few events as the substrate underneath is not labeled with molecules. By comparing with numerical simulations, we can retrieve the real position of the molecules that contribute to the two peaks of the distribution, which are shifted by ~10 nm along the X axis. By the same reasoning, for and (Figure 3e, II), we select coaxially oriented molecules with an apparent
posi-tion |d| ~ 115 nm. The comparison with numerical simulaposi-tions allows us to associate with this class of molecules a real position distributed around x 50 nm and y 70 nm. Finally, for and (Figure 3e, III), the distribution of detections changes from a bimodal distribution to a bell-shaped distribution on top of the NW, in good agreement with the profile expected for the coaxially oriented dipoles (Figure 3a). We can state that such events are generated from molecules located on the top of the NW. Figure 3f is a sketch summarizing these findings.
By the same token, we can analyze the events with and associate the real and the apparent position of radially oriented molecules. The distributions for and different ranges of sigma (i-iii) are reported in Figure 3e. For , we observe two sharp contributions at |d|= 55 nm sep-arated by a valley which goes almost to zero in the center of the NW, demonstrating that can be uti-lized to successfully filter out events occurring on top of the NW with |d|~0 nm. For , the peaks appear slightly closer to the NW axis, congruent with our numerical simulations. For we retrieve the detection density profile of radially oriented molecules on top of the NW, which appear around d=0 nm. As before, by comparison of the apparent position with the real nu-merically simulated position, we can relocate the events also for , selecting different dipoles positions via their value of .
These findings show that using both the fluorescence decay rate and the size of the PSF of fluorescent single-molecules and comparing those to numerical simulations, one can deduce their dipole orientation and position around the NW and locate their emission in the far field. This enables the study of light-matter interactions at specific positions along the NW, even when the sample is labeled with randomly oriented fluorescent probes. In much the same way as one can encode the axial position of single emit-ters with a cylindrical lens in classical 3D SMLM experiments,(34),(35) numerical simulations in the presence of the NW predict the PSF shape and decay rate for emitters in any position of the sample. Our experimental approach and data analysis methodology tackles thus the major limitation in the use of molecule microscopy to study light-matter interactions, namely 3D positioning of single-molecules close to a resonant nanostructure. It is important to emphasize that, besides relocation issues, our method offers good statistical information, without needing to know the position of the molecules,
combining decay rates and spatial distribution of radiative modes, since tens of thousands of molecules on different sites are probed within one experimental run. Future developments of our technique might take advantage of machine-learning algorithms, trained with numerical simulations of the emission of single dipoles close to combinations of simple nanophotonic structures (36), and thus to infer the struc-tural information from the recorded PSFs and decay rates. Furthermore, we foresee that with the devel-opment of brighter, better controllable photoactivatable probes and the subsequent improvement on PSF sampling and fitting models, the full potential of our method will be exploited, clearing the way to smFLIM as a standard technique for the study of light-matter interaction at the nanoscale. Importantly, in the case of arbitrary nanostructures, our method can give access to the position of each molecule in three dimensions.
Conclusions
In conclusion, we demonstrate that by using both the information retrieved from the decay rate and the PSF of single emitters on a densely-labeled silver NW, we are able with smFLIM to not only obtain an LDOS map at the nanometer scale but also distinguish their different dipole orientations and positions. This is critical to fully develop the potential of single-molecule techniques in the fields of plasmonics and nanophotonics. We have achieved this by categorizing the events in respect to their measured decay rate and PSF shape, both containing crucial information about the emitter interaction and orientation with the metallic nanostructure.
To this end, we have employed an innovative single-molecule lifetime imaging approach of smFLIM that measures simultaneously the PSF of the molecule with an EMCCD camera and the fluorescence decay rate using an array of SPADs, effectively covering time scales ranging from picoseconds to milli-seconds. Importantly, the use of a SPAD array significantly extends the FOV to ~10 μm2, with a filling fraction close to 100 % and state-of-the-art specifications in terms of detection efficiency, time resolu-tion, jitter and dark count. This allows to measure the fluorescence decay rate of up to 8 single quantum emitters simultaneously, or to measure high-order correlations of their photon emission over a range of several micrometers in a single measurement without scanning parts. With the large variety of photoactivatable molecules commercially available our method enables mapping of the LDOS at differ-ent wavelengths, for the study of optical modes in the near-field of spectrally broadband nanostructures. Moreover, the stochastic, wide-field character of the measurement with dense sample labeling allows the application of the technique to various types of materials, both deterministic and disordered nanostructures, with spatial features on the nanometer scale and spatial extensions ranging from hun-dreds of nanometers to micrometers.
Besides the application demonstrated in this paper, this novel type of array detector with single photon counting capabilities and ps temporal resolution implemented in our setup should also find important applications in other fields such as quantum nanotechnologies, bioimaging, and chemical science. We anticipate that the unique span in temporal (~ps to ~ms) and spatial (~10 nm to ~10 μm) scales of our method will be key to unlock the study of complex multiscale dynamic processes.
MATERIALS AND METHODS
Sample preparation: The sample was prepared by spin-coating a dilute solution of silver NWs (Sigma Aldrich) in isopropyl alcohol on a cleaned glass coverslip. A microfluidic chamber was created by sandwiching a parafilm spacer between the NW coverslip containing the NWs and a second glass cover slip. The NWs and glass were functionalized by introducing consecutively a solution of biotin-conjugated bovine serum albumin in phosphate-buffered saline (PBS) (1 mg/mL) for ~2 hours and streptavidin-conjugated Alexa 647 Fluor in PBS (ThermoFisher Scientific, 0.005 g/L) for ~2 hours. In addition, we added polystyrene fluorescent beads dispersed in PBS (Crimson FluoSpheres 200 nm, ThermoFisher Scientific) for use as fiducial markers. The chamber was flushed with PBS between each step. Finally, the microfluidic chamber was filled with an oxygen-reducing buffer solution,(25),(37) containing glucose (~100 mg/mL), cysteamine (~4 mg/mL), glucose oxidase (~0.5 mg/mL) and catalase in aqueous solution (1.18 μL/mL) dissolved in PBS.
Optical setup: Single-molecule experiments of smFLIM were carried out on an inverted microscope (X71, Olympus) equipped with a NA=1.49 microscope objective (UApoN 100X, Olympus) in a wide-field TIRF geometry. The fluorescent molecules were excited through the microscope objective with a pulsed diode laser emitting at a wavelength of 638 nm (LDH-P-C-640B, PicoQuant), a repetition rate of 80 MHz at ~0.5 kW/cm2. The plane of incidence of the excitation beam was set perpendicular to the NW axis and the excitation polarization was set parallel to the plane of incidence (p-polarized). Mole-cules were photoactivated by a continuous wave diode laser (Oxxius), coupled into the same excitation path.
The fluorescence was collected by the same objective and filtered through an emission filter. Using a 50:50 beam-splitter, 50% the collected photons were imaged on an EMCCD camera (iXon Ultra, Andor), while the remaining half was guided on to a prototype of a linear array of SPADs(24) connected to a time-correlated single photon counting module (TCSPC). During the measurements, we corrected for sample drift by imaging a fiducial marker and maintaining it at a fixed position using a piezoelectric stage (PInano XYZ, Physik Instrumente). To calibrate the SPAD detectors in the array, we determined the photon detection efficiency (PDE) and FOV of each separate SPAD compared to that of the PDE
and FOV of the EMCCD camera by scanning a bright fluorescence bead in the sample plane. Moreover, we accounted for the time response of each SPAD detector by measuring the instrument response func-tion (IRF), used for the fitting of the fluorescence decay rate histogram.
Data analysis: Localization of single-molecule emission was performed using the ThunderSTORM(38) plugin in ImageJ(39). The obtained location estimates were further processed using a home-built script, in which events that appear in multiple consecutive frames are merged and associated with the time-resolved data recorded by the TCSPC. In instances in which multiple events in a single frame on the EMCCD camera were associated with a single SPAD, these events were omitted from further data anal-ysis to prevent the mixing of decay rate information from different molecules. The typical localization precision was estimated by the median localization precision ( ) of all the events that were detected both on the SPAD and EMCCD. Decay rate estimates were obtained by fitting the decay rate histogram with a mono-exponential decaying function convoluted with the IRF. To correct for back-ground luminescence and dark counts of the SPADs, which varies between the SPADs in the array, a background signal was added to the fitting model, obtained for each SPAD individually in time periods without single-molecule events. For reconstruction of the decay rate map, each detection is represented by a 2D normal distribution with a standard deviation of , truncated at the full-width at half-maximum, i.e . For locations where multiple events overlap, the weighted aver-age of the decay rate is taken. More detailed information can be found in Reference (8).
Supporting Information:
Scanning electron microscopy images of the silver NWs; simulations of the excitation field around the NW; Cramér-Rao analysis of the decay rate estimates; distribution of the single-molecule decay rates, simulations of the orientation-dependent number of detected photons. .
AUTHOR INFORMATION
Corresponding Author
Correspondence can be addressed to [email protected] and [email protected]
Author Contributions
G.B. and B.v.D. performed the experiments; G.B. set up the experiment and carried out the data analysis and numerical simulations; A.G. and G.A. developed and provided the SPAD array; Y.D.W., I.I. and
V.K. supervised the project. I.I. and V.K. conceived the project. B.v.D. drafted the manuscript, which was revised through the contributions of all authors.
Acknowledgement
The authors acknowledge funding by Ville de Paris (Emergences 2015), Agence Nationale de la Recher-che (ANR) (ANR-10_LABX-24, ANR- 10- IDEX-0001-02 PSL*, ANR-17-CE09-0006) and thank S. Bidault and E. Gayet for help with the sample preparation.
REFERENCES
(1) Ropp, C.; Cummins, Z.; Nah, S.; Fourkas, J. T.; Shapiro, B.; Waks, E. Nanoscale Imaging and Spontaneous Emission Control with a Single Nano-Positioned Quantum Dot. Nat. Commun.
2013, 4, 1447.
(2) Ropp, C.; Cummins, Z.; Nah, S.; Fourkas, J. T.; Shapiro, B.; Waks, E. Nanoscale Probing of Image-Dipole Interactions in a Metallic Nanostructure. Nat. Commun. 2015, 6, 6558.
(3) Wertz, E.; Isaacoff, B. P.; Flynn, J. D.; Biteen, J. S. Single-Molecule Super-Resolution Microscopy Reveals How Light Couples to a Plasmonic Nanoantenna on the Nanometer Scale.
Nano Lett. 2015, 15, 2662–2670.
(4) Guo, K.; Verschuuren, M. A.; Koenderink, F. A. Superresolution Imaging of the Local Density of States in Plasmon Lattices. Optica 2016, 3, 289–298.
(5) Johlin, E.; Solari, J.; Mann, S. A.; Wang, J.; Shimizu, T. S.; Garnett, E. C. Super-Resolution Imaging of Light-Matter Interactions near Single Semiconductor Nanowires. Nat. Commun.
2016, 7, 13950.
(6) Mack, D. L.; Cortés, E.; Giannini, V.; Török, P.; Roschuk, T.; Maier, S. A. Decoupling Absorption and Emission Processes in Super-Resolution Localization of Emitters in a Plasmonic Hotspot. Nat. Commun. 2017, 8, 14513.
(7) Taylor, A.; Verhoef, R.; Beuwer, M.; Wang, Y.; Zijlstra, P. All-Optical Imaging of Gold Nanoparticle Geometry Using Super-Resolution Microscopy. J. Phys. Chem. C 2018, 122, 2336– 2342.
(8) Bouchet, D.; Scholler, J.; Blanquer, G.; De Wilde, Y.; Izeddin, I.; Krachmalnicoff, V. Probing Near-Field Light–Matter Interactions with Single-Molecule Lifetime Imaging. Optica 2019, 6, 135.
(9) Su, L.; Lu, G.; Kenens, B.; Rocha, S.; Fron, E.; Yuan, H.; Chen, C.; Van Dorpe, P.; Roeffaers, M. B. J.; Mizuno, H.; et al. Visualization of Molecular Fluorescence Point Spread Functions via Remote Excitation Switching Fluorescence Microscopy. Nat. Commun. 2015, 6, 6287.
(10) Betzig, E.; Patterson, G. H.; Sougrat, R.; Lindwasser, O. W.; Olenych, S.; Bonifacino, J. S.; Davidson, M. W.; Lippincott-schwartz, J.; Hess, H. F. Imaging Intracellular Fluorescent Proteins at Nanometer Resolution. Science (80-. ). 2006, 313, 1642–1646.
(11) Hess, S. T.; Girirajan, T. P. K.; Mason, M. D. Ultra-High Resolution Imaging by Fluorescence Photoactivation Localization Microscopy. Biophys. J. 2006, 91, 4258–4272.
(12) Rust, M. J.; Bates, M.; Zhuang, X. Sub-Diffraction-Limit Imaging by Stochastic Optical Reconstruction Microscopy (STORM). Nat. Methods 2006, 3, 793–795.
(13) Carminati, R.; Cazé, A.; Cao, D.; Peragut, F.; Krachmalnicoff, V.; Pierrat, R.; De Wilde, Y. Electromagnetic Density of States in Complex Plasmonic Systems. Surf. Sci. Rep. 2015, 70, 1– 41.
(14) Baiyasi, R.; Jebeli, S. A. H.; Zhang, Q.; Su, L.; Hofkens, J.; Uji-i, H.; Link, S.; Landes, C. F. PSF Distortion in Dye-Plasmonic Nanomaterial Interactions: Friend or Foe? ACS Photonics 2019, 6, 699–708.
(15) Raab, M.; Vietz, C.; Stefani, F. D.; Acuna, G. P.; Tinnefeld, P. Shifting Molecular Localization by Plasmonic Coupling in a Single-Molecule Mirage. Nat. Commun. 2017, 8, 13966.
(16) Saemisch, L.; Liebel, M.; van Hulst, N. Statistically Analysis of Many Single-Molecule Encounters Reveals Plasmonic Resonance Dependent Nanoantenna-Molecule Interactions.
arXiv:1904.08883 [physics.chem-ph] 2019.
(17) Groß, H.; Heil, H. S.; Ehrig, J.; Schwarz, F. W.; Hecht, B.; Diez, S. Parallel Mapping of Optical Near-Field Interactions by Molecular Motor-Driven Quantum Dots. Nat. Nanotechnol. 2018, 13, 691–695.
(18) Frimmer, M.; Chen, Y.; Koenderink, A. F. Scanning Emitter Lifetime Imaging Microscopy for Spontaneous Emission Control. Phys. Rev. Lett. 2011, 107, 123602.
(19) Krachmalnicoff, V.; Cao, D.; Cazé, A.; Castanié, E.; Pierrat, R.; Bardou, N.; Collin, S.; Carminati, R.; De Wilde, Y. Towards a Full Characterization of a Plasmonic Nanostructure with a Fluorescent Near-Field Probe. Opt. Express 2013, 21, 11536–11545.
(20) Beams, R.; Smith, D.; Johnson, T. W.; Oh, S.-H.; Novotny, L.; Vamivakas, A. N. Nanoscale Fluorescence Lifetime Imaging of an Optical Antenna with a Single Diamond NV Center. Nano
Lett. 2013, 13, 3807–3811.
(21) Schell, A. W.; Engel, P.; Werra, J. F. M.; Wolff, C.; Busch, K.; Benson, O. Scanning Single Quantum Emitter Fluorescence Lifetime Imaging: Quantitative Analysis of the Local Density of Photonic States. Nano Lett. 2014, 14, 2623–2627.
(22) Singh, A.; Calbris, G.; Van Hulst, N. F. Vectorial Nanoscale Mapping of Optical Antenna Fields by Single Molecule Dipoles. Nano Lett. 2014, 14, 4715–4723.
(23) Bouchet, D.; Mivelle, M.; Proust, J.; Gallas, B.; Ozerov, I.; Garcia-Parajo, M. F.; Gulinatti, A.; Rech, I.; De Wilde, Y.; Bonod, N.; et al. Enhancement and Inhibition of Spontaneous Photon Emission by Resonant Silicon Nanoantennas. Phys. Rev. Appl. 2016, 6, 064016.
(24) Cuccato, A.; Antonioli, S.; Crotti, M.; Labanca, I.; Gulinatti, A.; Rech, I.; Ghioni, M. Complete and Compact 32-Channel System for Time-Correlated Single-Photon Counting Measurements.
IEEE Photonics J. 2013, 5, 6801514.
(25) van de Linde, S.; Löschberger, A.; Klein, T.; Heidbreder, M.; Wolter, S.; Heilemann, M.; Sauer, M. Direct Stochastic Optical Reconstruction Microscopy with Standard Fluorescent Probes. Nat.
Protoc. 2011, 6, 991–1009.
(26) van de Linde, S.; Krstić, I.; Prisner, T.; Doose, S.; Heilemann, M.; Sauer, M. Photoinduced Formation of Reversible Dye Radicals and Their Impact on Super-Resolution Imaging.
Photochem. Photobiol. Sci. 2011, 10, 499–506.
(27) Ghioni, M.; Gulinatti, A.; Rech, I.; Zappa, F.; Cova, S. Progress in Silicon Single-Photon Avalanche Diodes. IEEE J. Sel. Top. Quantum Electron. 2007, 13, 852–862.
(28) Bouchet, D.; Krachmalnicoff, V.; Izeddin, I. Cramér-Rao Analysis of Lifetime Estimations in Time-Resolved Fluorescence Microscopy. Opt. Express 2019, 27, 21239.
(29) Hendrickson, W. A.; Pähler, A.; Smith, J. L.; Satow, Y.; Merritt, E. A.; Phizackerley, R. P. Crystal Structure of Core Streptavidin Determined from Multiwavelength Anomalous Diffraction of Synchrotron Radiation. PNAS 1989, 86, 2190–2194.
(30) Enderlein, J.; Toprak, E.; Selvin, P. R. Polarization Effect on Position Accuracy of Fluorophore Localization. Opt. Express 2006, 14, 8111.
(31) Lew, M. D.; Backlund, M. P.; Moerner, W. E. Rotational Mobility of Single Molecules Affects Localization Accuracy in Super-Resolution Fluorescence Microscopy. Nano Lett. 2013, 13, 3967–3972.
(32) Engelhardt, J.; Keller, J.; Hoyer, P.; Reuss, M.; Staudt, T.; Hell, S. W. Molecular Orientation Affects Localization Accuracy in Superresolution Far-Field Fluorescence Microscopy. Nano Lett.
2011, 11, 209–213.
(33) Hell, S.; Reiner, G.; Cremer, C.; Stelzer, E. H. K. Aberrations in Confocal Fluorescence Microscopy Induced by Mismatches in Refractive Index. J. Microsc. 1993, 169, 391–405.
(34) Pin Kao, H.; Verkman, A. S. Tracking of Single Fluorescent Particles in Three Dimensions: Use of Cylindrical Optics to Encode Particle Position. Biophys. J. 1994, 67, 1291–1300.
(35) Huang, B.; Wang, W.; Bates, M.; Zhuang, X. Three-Dimensional Super-Resolution Imaging by Stochastic Optical Reconstruction Microscopy. Science (80-. ). 2008, 319, 810–813.
(36) Bertrand, M.; Devilez, A.; Hugonin, J.-P.; Lalanne, P.; Vynck, K. Global Polarizability Matrix Method for Efficient Modelling of Light Scattering by Dense Ensembles of Non-Spherical Particles in Stratified Media. arXiv:1907.12823v1 [physics.optics] 2019.
(37) Heilemann, M.; van de Linde, S.; Schüttpelz, M.; Kasper, R.; Seefeldt, B.; Mukherjee, A.; Tinnefeld, P.; Sauer, M. Subdiffraction-Resolution Fluorescence Imaging with Conventional Fluorescent Probes. Angew. Chemie - Int. Ed. 2008, 47, 6172–6176.
(38) Ovesný, M.; Křížek, P.; Borkovec, J.; Švindrych, Z.; Hagen, G. M. ThunderSTORM: A Comprehensive ImageJ Plug-in for PALM and STORM Data Analysis and Super-Resolution
Imaging. Bioinformatics 2014, 30, 2389–2390.
(39) Schneider, C. A.; Rasband, W. S.; Eliceiri, K. W. NIH Image to ImageJ: 25 Years of Image Analysis. Nat. Methods 2012, 9, 671–675.
For Table of Contents Use Only
Super-resolved fluorescence decay rate map around a silver nanowire with a diameter of ~115 nm. The blue dashed circle indicates the field of view associated with one of the single-photon avalanche diode