Received: 10 June 2002 Revised: 20 March 2003 Accepted: 2 May 2003 Published online: 25 June 2003 © Springer-Verlag 2003
Abstract Perfusion-weighted mag-netic resonance imaging (PWI) has been proposed as an attractive non-invasive tool for evaluating cerebral haemodynamics. Quantitative maps of cerebral blood flow (CBF), cere-bral blood volume (CBV), mean transit time (MTT), time to peak (TTP) and various other haemody-namic parameters can be obtained. Recent advances in hard- and soft-ware made PWI available for clinical routine. Although PWI became common in adult neuroradiology, it remains challenging in pediatric neuroradiology. In this article, the different PWI techniques that render haemodynamic maps of the brain are presented and discussed. The normal
developmental changes of the cere-bral haemodynamics in children as measured by PWI are presented as well as the application of PWI in cerebral ischaemia, primary and secondary cerebral vasculopathies and in cerebral tumours.
Keywords Perfusion-weighted imaging · Dynamic susceptibility contrast imaging · Haemodynamic parameter · Children
Thierry A. G. M. Huisman
A. Gregory Sorensen
Perfusion-weighted magnetic resonance
imaging of the brain:
techniques and application in children
Introduction
The cerebral circulation relies on a dynamic vascular system that maintains a steady state delivery of blood to the brain. Autoregulatory mechanisms are designed to preserve an adequate, stable cerebral perfusion. The close relationship between cerebral perfusion, metabo-lism and neuronal function was described as early as 1890 by Roy and Sherrington [1].
Cerebral perfusion is typically measured as the quan-tity of blood (ml) perfusing a volume of brain (100 g) per unit of time (min), also known as cerebral blood flow (CBF). Several additional, closely linked parameters, in-cluding cerebral blood volume (CBV) and blood circula-tion time, are used to characterise cerebral haemodynam-ics. The CBV is the amount of blood in a given amount of brain while the mean transit time (MTT) represents the time the blood takes to pass the brain tissue. These
haemodynamic parameters are linked by the following relationship:
(1) Cerebral blood flow is influenced by multiple, complex interacting factors including arterial perfusion pressure, intracranial pressure, blood viscosity, arterial pCO2and pO2. Cerebral autoregulation mechanisms preserve CBF within a narrow range to guarantee brain tissue integrity and function. The CBF and CBV are tightly coupled [2].
Many disease processes are known to alter cerebral perfusion. These changes can be in either direction. Ce-rebral perfusion can be reduced (ceCe-rebral ischaemia) or increased (arterio-venous malformations). In addition, in many disease processes CBF and CBV can be decou-pled. In acute cerebral ischaemia, for example, a cerebral vasodilatation can occur in compensation to a decreased T. A. G. M. Huisman (
✉
) · A. G. SorensenDepartment of Radiology, Neuroradiology Section and MGH-NMR Center, Massachusetts General Hospital and Harvard Medical School, Boston, Massachusetts, USA
e-mail: [email protected] Tel.: +41-1-2667111 Fax: +41-1-2667158 Present address: T. A. G. M. Huisman, Department of Radiology,
University Children’s Hospital Zurich, Steinwiesstrasse 75, 8032 Zurich, Switzerland
perfusion pressure. This vasodilatation increases CBV, whereas CBF remains below normal [3, 4, 5, 6].
Neuro-anatomical imaging techniques, including CT and MRI, represent important diagnostic tools in the evaluation of cerebrovascular disease (CVD). A major limitation is that these techniques identify only the se-quelae from CVD without giving detailed information about the underlying cerebral haemodynamics. In addi-tion, conventional CT and MRI often detect injury too late, i.e. after injury has become irreversible. An alterna-tive technique that gives functional, haemodynamic in-formation is therefore desirable. This technique should identify the aetiology and severity of the vascular pathol-ogy, estimate the risk of future tissue injury, direct the correct treatment, evaluate and monitor the results of treatment and finally give insight in the pathophysiology of disorders involving the cerebrovascular system and haemodynamics in general.
Multiple techniques have been proposed to investi-gate the cerebrovascular system. Some provide non-tomographic, regional data, whereas others provide pro-jectional or tomographic images. Imaging includes X-ray angiography, CT angiography, MR angiography and Doppler ultrasonography. These techniques are, howev-er, focused on detecting blood flow in the macroscopic vasculature, whereas most cerebrovascular diseases be-gin at the microvascular or capillary level. The macro-scopic vasculature is seldom involved in the early stages of disease. Detection of pathology at the microvascular level is consequently favourable because treatment could be started at an earlier stage of the disease, possibly even before irreversible clinical symptoms develop.
Techniques that provide haemodynamic information at the capillary level include positron emission phy (PET), single photon emission computed tomogra-phy (SPECT) and dynamic 133xenon CT. These methods are, however, expensive, time-consuming and require the administration of ionizing radiation: a distinct disadvan-tage in children.
Perfusion-weighted MRI is a tomographic imaging technique that combines unique features in assessing brain perfusion. PWI is relatively sensitive to the micro-vasculature, is minimally invasive, has a higher spatial resolution than PET/SPECT, does not use ionizing radia-tion and has a better contrast-to-noise per unit of time compared with X-ray CT. In addition, MRI scanners are more widely available than PET/SPECT scanners, PWI can easily be added to conventional MRI (short acquisi-tion time), and finally the faster heart rate and smaller perfusion cross-sectional area of the child’s brain in-crease the quality of PWI.
How is tissue perfusion measured by MRI
There are currently two fundamentally different ap-proaches to measure brain perfusion by MRI. The first, most widely applied method is referred to as the “dy-namic susceptibility contrast technique”. This approach uses long-established principles of indicator dilution methods in which a decrease of T2 or T2* MR signal in-tensity is related to the passage of paramagnetic contrast materials through the capillary bed [7, 8, 9]. The drop in MR signal intensity gives information about multiple haemodynamic parameters.
The second, currently less often applied method relies on the use of inversion or saturation pulses that label blood spins before flowing into the brain slice of inter-est. In this technique, also known as “arterial spin label-ling” (ASL), the consequent MR signal changes are di-rectly related to the local haemodynamics.
A third MRI technique that uses phasensitive se-quences to capture MR signal changes due to perfusion-induced intravoxel incoherent motion (IVIM) is present-ly mainpresent-ly of historical importance and is consequentpresent-ly only mentioned for completeness but is not discussed in this paper [10].
Dynamic susceptibility contrast imaging
Dynamic susceptibility contrast imaging relies on T2 or T2* signal changes within the brain tissue due to suscep-tibility effects of high doses of paramagnetic contrast material flowing through the brain vasculature (Figs. 1, 2). Unlike conventional MRI, the basis of PWI does not rely on relaxivity (dipole–dipole) effects but primarily on magnetic susceptibility effects.
The short range at which dipole–dipole effects of para-magnetic contrast agents (e.g. gadolinium chelates) act, re-strict their effects upon those spins which are in direct con-tact with the contrast agent. Because most routinely used paramagnetic contrast agents do not cross the blood-brain barrier (BBB), these dipole–dipole effects are consequently limited to the intravascular space or cerebral blood pool. This compartmentalization means that if we would rely on these dipole–dipole effects haemodynamic maps would be calculated from maximal 4% of the cerebral spins.
T2 and T2* weighted dynamic susceptibility contrast imaging takes advantage of the compartmentalization. The accumulation of high magnetic susceptibility con-trast agents within the approximately randomly oriented capillary network of the brain results in localized varia-tions in tissue magnetic fields. This microscopic hetero-geneity of magnetic field induces a loss of transverse phase coherence with T2/T2* signal loss in the surround-ing brain tissue (outside of the vascular compartment; Figs. 1, 2). Magnetic susceptibility effects act on a lon-ger range than the previously described dipole–dipole
in-teractions; magnetic susceptibility phenomena extend outside of the vessels for a distance roughly equal to the radius of the blood vessels. This means that these effects are not just limited to the blood pool but involve the en-tire brain; more spins are affected by the passage of para-magnetic contrast agents. By affecting more spins, a big-ger signal change is achieved. The improved signal re-sults in more reliable PWI maps. In addition, the haemo-dynamic information supplied by magnetic susceptibility PWI is more tissue perfusion weighted than T1-weighted dipole–dipole imaging.
Basic principles of dynamic magnetic
susceptibility imaging
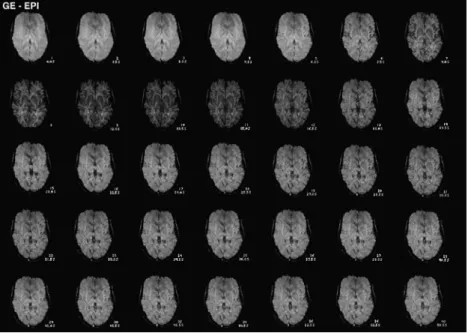
Dynamic magnetic susceptibility imaging relies on the rapid acquisition of as many images as possible during the passage of contrast media through the brain to mea-sure the degree of T2/T2* signal changes over time (Figs. 1, 2, 3). Rapid and well-timed imaging is neces-sary because magnetic susceptibility effects rely on high concentrations of Gd, which are typically present during the first passage of contrast agents through the capillary Fig. 1 Gradient-echo,
echo-pla-nar (EPI) dynamic susceptibility contrast imaging. A series of raw images after the injection of a bolus of gadolinium is dis-played. The first four images show the precontrast baseline signal intensity. The arrival of the gadolinium is first seen within branches of the middle cerebral artery, 6 s after contrast injection, followed by a marked parenchymal signal loss during the first passage of the gadolini-um (9–16.5 s). A phase of rapid signal recovery is then followed by a discrete second signal drop due to the first recirculation of the gadolinium (27–31.5 s). At the end of the series, a discrete residual signal loss compared with the initial baseline images is seen due to remaining circu-lating contrast agent
Fig. 2 Spin-echo EPI dynamic susceptibility contrast imaging. A series of raw images during the passage of a bolus of gado-linium is displayed. The signal drop is identical in the temporal evolution; the degree of signal drop is, however, less pronounced compared to Fig. 1 (gradient-echo)
bed. Recirculation phenomena rapidly dilute the passing Gd bolus. The measured MR signal intensity change vs time curve is converted into a contrast agent tissue con-centration vs time curve (Fig. 3). Both empirical and the-oretical studies have shown that the degree of signal drop in a voxel is directly related to the amount of con-trast agent in that voxel [9, 11]. This relationship be-tween the measured signal change over time and the con-centration of contrast agent in a voxel over time is the key link that allows calculations of cerebral haemody-namics. This non-invasive technique for measuring cere-bral perfusion was first used by Villringer et al. in 1988 [12]. The mathematical algorithms used to calculate the haemodynamic data are similar to the indicator or tracer dilution methods developed at the end of the nineteenth century [13, 14]. PWI uses a simple extension of this principle: if one compares the signal intensity of voxels before and after the injection of a known amount of con-trast agent, the signal change can only be due to the ad-dition of the contrast agent. Because the signal drop is directly related to the concentration of the Gd in the blood pool, CBV can be calculated by knowing the amount of Gd that was injected.
MR sequences in dynamic susceptibility
contrast imaging
The primary goal of susceptibility MRI is to generate a T2/T2* signal vs time graph by measuring a maximum of data points during the first passage of the contrast agent. Echo-planar (EPI) sequences are typically used because the short acquisition time (<100 ms) per slice al-lows acquiring a large number of images per time period at multiple locations.
Echo-planar techniques can be combined both with T2-weighted spin-echo (SE) and T2*-weighted gradient-echo (GE) sequences (Figs. 1, 2). The SE sequences have been proven to be more advantageous than GE se-Fig. 3 Normal signal-vs-time graph in a voxel within the central
grey matter. Each data point represents the signal intensity mea-sured within the voxel in time. Error bars indicate the standard deviation. The curve is characterized by a baseline region that is ended by the arrival point of contrast agent with a sharp decline of the signal intensity. The signal drop recovers quickly after a peak signal change as the bolus washes out of the brain. A second, small signal drop results from the first bolus recirculation. The post-injection signal intensity remains somewhat lower compared with the initial baseline signal intensity due to residual, recirculat-ing contrast agent. The signal-vs-time curve is then transformed into a concentration-vs-time curve or ∆R2-vs-time curve by taking the negative log of the signal change. Cerebral blood volume (CBV) is calculated from the area underneath the ∆R2 curve. If the arterial input function is known, cerebral blood flow (CBF) maps can be calculated. Mean transit time (MTT) maps are calcu-lated by dividing CBV by CBF. Additional maps are created rely-ing on different characteristics of this curve, e.g. time-to-peak (TTP) signal change or full width half maximum (FWHM)
Fig. 4a, b The CBF and CBV maps in a 16-year-old boy. The maps are calculated on a voxel-by-voxel basis from a GE EPI sequence and an SE EPI sequence. Both sequences show a good discrimination between grey and white matter. In both maps the CBF and CBV of the grey matter is higher than that of the white matter. In the normal brain the CBF image appears similar to the CBV image
quences because of their higher sensitivity for the micro-vascular perfusion [11, 15]. The micromicro-vascular image weighting brings PWI into a biologically relevant range. Subtle differences between the blood volume of grey and white matter (4 vs 2% blood volume) can consequently be resolved (Figs. 4, 5, 6). The increased specificity for the microvascular perfusion is, however, accompanied by a small decrease in the signal-to-noise ratio (SNR). Increasing doses of Gd can compensate for the SNR re-duction.
In clinical practice the patient is examined in a stan-dard head coil with a sequential multislice single-shot SE or GE EPI acquisition. Images are typically obtained for 1 min to include precontrast baseline images, to
cap-ture the first passage of the contrast agent and the postin-jection phase which includes the second signal drop due to the recirculation of the contrast bolus as well as the slow recovery of the signal to baseline due to the pro-gressing dilution of the contrast agent (Fig. 3). Since the CBV is calculated on the basis of the signal drop relative to the precontrast baseline, an adequate estimation of the baseline (signal) is essential. A reliable baseline signal is best defined by as many images as possible. Depending on the MRI hardware, each slice is measured up to 80 times. The first passage is usually visible on 10–12 im-ages (Fig. 3). One simulation study found that 50 or more images (per slice) increase the SNR substantially [16]. The number of slices usually ranges between 5 and 20.
Depending on the performance of the MR gradient systems, the number of slices is limited by the repetition time (TR). By increasing the number of slices, the TR will inevitably increase. Long TRs are, however, disad-vantageous because the SNR will drop and secondly the passage of the contrast bolus is sampled by fewer imag-es. On the other hand, to avoid T1-weighting, the TR should not be too short (e.g. TR <500 ms). Currently, a TR of 1500 ms is thought to be a good compromise. The echo time (TE) should be a balance between an adequate T2-weighting and sufficient T2 signal. Currently, a TE is advised between 60 and 75 ms. The slice thickness may vary between 5 and 10 mm, the field of view between 200 and 240 mm and the acquisition matrix between 128×128 and 256×256. As with any parameter, the ap-propriate value is a balance or compromise between ad-vantages and disadad-vantages. The parameter should be optimized for the available field strength, gradient per-Fig. 5a, b The MTT, TTP, bolus arrival time and FWHM maps in
a 16-year-old boy. These maps are calculated from different char-acteristics from the ∆R2-vs-time curve. The MTT and TTP maps are most frequently used next to CBF and CBV maps. The advan-tage of these maps is their uniform signal intensity. Small changes are easily identified, which can go undetected on CBF and CBV maps
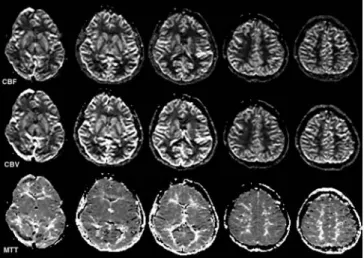
Fig. 6 The CBF, CBV and MTT maps in a healthy 8-year-old child. The CBF and CBV is larger in the grey matter than in the white matter. The internal capsule is easily differentiated from the adjacent basal ganglia. The cortex is well perfused. The CBF and CBV maps should be symmetrical and identical
formance, region of interest, suspected pathology, and patient characteristics (young child vs adult). In young children, for instance, the slice thickness should be re-duced as much as possible (3–4 mm). In addition, the smaller brain size allows to reduce the field of view (160–180 mm), consequently increasing the spatial reso-lution. Currently, no age-specific TR and TE times have been determined or published.
High field strengths are desirable (1.5 T and higher) because the SNR will increase and consequently the haemodynamic maps will be more reliable. The in-creased SNR is especially favourable in young children.
Perfusion-weighted MRI should always be performed along with conventional MRI. The short acquisition times easily allow an integration of PWI in most routine departmental imaging protocols. PWI should, however, be performed before contrast-enhanced conventional MRI sequences are measured. Postcontrast T1-weighted images can usually follow PWI, as the acquisition times of PWI are short.
Rationale on magnetic susceptibility
contrast agents
Susceptibility effects can be induced by using intrinsic or extrinsic contrast agents. Intrinsic contrast agents are used in functional MRI to examine brain function [17, 18]. Intrinsic contrast agents can also be used in PWI (e.g. ASL). A major advantage is that no contrast agents have to be injected and that the measurements can be re-peated as often as necessary within the same examina-tion. A major limitation is that the signal changes are small (for ASL: of the order of 1–2% at 1.5 T).
The rationale of using an extrinsic contrast agent is to take advantage of the much larger susceptibility effects of Gd. The injection of a single dose of Gd (0.1 mmol/kg body weight) results in an average signal drop of 10–15% at 1.5 T (SE EPI sequences; Fig. 3). The signal drop can even be enhanced to 20–30% by increasing the dose to 0.2 mmol/kg (Fig. 7). This greater signal drop will increase the discrimination between grey and white matter and will show subtle changes of the cerebral haemodynamics in early stages of vascular disease. There is, however, also an upper limit. If the signal crease is greater than 40–50%, additional Gd will de-crease the quality of the perfusion maps [16].
Magnetic susceptibility contrast agents should be in-jected as a narrow bolus by a power injector for two rea-sons. First of all, T2-weighted magnetic susceptibility ef-fects dominate image contrast only if high intravascular concentrations of Gd are achieved. Secondly, CBF is cal-culated from the shape and size of the peak signal drop vs time curve. A wide bolus might blur slight differences in arrival time between voxels. By using a bolus as nar-row as possible, the information extracted from the
sig-nal-vs-time curve can be more accurately translated in a CBF map. Methods to narrow the bolus of contrast agent include the use of a power injector with high injection rates (5 ml/s) and the use of more concentrated contrast agents or contrast agents with higher magnetic suscepti-bility effects (e.g. Dysprosium-based agents). In addi-tion, a fully automated contrast injector allows flushing the system with a bolus of saline after the Gd injection. This will advance the remaining Gd within the tubes and within the patient’s venous system towards the heart. The use of power injections is not yet established in very young children. Limited experience is currently avail-able; most paediatric neuroradiologists favour a manual injection. The smaller volume of contrast to be injected in young children and the higher heart rate and faster cir-culation time are advantageous in children because they narrow the contrast bolus. This will increases the reli-ability of the haemodynamic maps.
Dynamic susceptibility contrast imaging relies on an intact blood-brain barrier (BBB) to keep the contrast Fig. 7 Signal-vs-time graphs for different doses of gadolinium. The larger doses of contrast agent provide a greater signal change; greater signal changes typically increase the quality of the perfu-sion maps. Note that the numbers along the y-axis are arbitrary units displaying the change (loss) in signal intensity during the passage of the gadolinium
agent intravascularly compartmentalized. In disease pro-cesses where the BBB is disrupted, the contrast agent leaks into the brain tissue. The decrease of the compart-mentalization reduces local field inhomogeneities. In ad-dition, the extravascular accumulation of contrast agents causes a local T1 shortening. Both phenomena counter-act T2-signal decreases from susceptibility effects. Post-processing algorithms can compensate for moderate de-grees of BBB leakage [11]. Alternatively, a pre-dose of 0.0025 or 0.005 mmol/kg of Gd can be given 5 min be-fore the bolus injection. In areas of a disrupted BBB, the Gd will shorten the T1 relaxation. By using a 5-min de-lay, the baseline images will already incorporate the sig-nal change due to the T1 shortening. The passing bolus of Gd will subsequently reduce the signal proportionally to T2 susceptibility effects. The predose of Gd compen-sates for the T1 shortening effects of the leaking Gd, but cannot, however, overcome the decrease in compartmen-talization. Finally, the use of Dysprosium chelates, which display less T1 relaxivity effects while the T2 magnetic susceptibility effects are more pronounced, partially compensate for a leaking BBB [19].
Computation of haemodynamic maps
The measured T2 signal intensity–time curve is the start-ing point of all haemodynamic map calculations (CBV, CBF, MTT). This curve is available for each voxel with-in the imagwith-ing plane (Fig. 3). The MR signal with-intensity curve is converted into a change in 1/T2, or ∆R2-vs-time curve (Fig. 3). Because ∆R2 and the tissue contrast agent (e.g. Gd) concentration show a linear relationship (∆R2=k2 [Gd]), this curve equals a contrast-agent-vs-time curve. (k2is a constant that depends on tissue mag-netic field strength, and MR pulse sequence; [Gd] is the tissue concentration of gadolinium.)
Maps of CBV (Fig. 4) are calculated by integrating the area under the ∆R2 curve or concentration–time curve over time for each pixel. The CBV parameters are no absolute values but represent relative scalars because the proportional constant k2 between ∆R2 and absolute contrast agent concentration cannot be determined with-out sampling the blood.
The calculation of CBF maps (Fig. 4) require an addi-tional step. An arterial input function (AIF) has to be specified which provides information about the timing of the contrast agent. Typically, another tissue-vs-time curve within voxels next to the major artery that feeds the tissue of interest is used as AIF (Fig. 8). In analogy to CBV, CBF values are relative rather than absolute. Maps of the mean transit time are rendered by dividing CBV into CBF (Fig. 5). A number of other “time” maps can be useful, de-pending on the pathology. These maps are usually simple to calculate and include maps of the arrival time of the bo-lus and the time to the peak signal change (TTP; Fig. 5).
All haemodynamic parameters are calculated on a voxel-by-voxel basis and can be displayed as a grey-scale map (Figs. 4, 5, 6). The CBV and CBF maps show a cortico-medullary differentiation due to the differences in CBV and CBF between grey and white matter. The MTT maps can be helpful as lesion conspicuity is in-creased due to the more uniform appearance.
There are a number of potential difficulties related to the AIF of which one should be aware. The AIF can be in-fluenced by variations in injection conditions and patient physiology. Delays and dispersion of the contrast bolus that occur during the passage of the bolus from the site of AIF measurement to the tissue of interest as well as partial-volume effects at the site of AIF measurement can intro-duce an error in the calculation of CBF. Furthermore, the tracer kinetic model assumptions of perfusion that are used for normal perfused brain tissue may be invalid in cerebral ischaemia. Consequently, perfusion maps should always be encountered with caution, in particular when absolute quantification is attempted. The reliability of absolute quantifications is determined by the quality of the AIF. De-convolution methods are currently under investigation to circumvent these limitations to provide reliable absolute quantifications [20, 21]. PWI is, however, very effective in the identification of regions with abnormal perfusion.
Arterial spin labelling
Arterial spin labelling (ASL) generates absolute haemo-dynamic parameter by labelling or tagging arterial spins. Inflowing blood water magnetization is inverted or satu-rated by a radio-frequency pulse before entering the brain slice of interest. After waiting an appropriate time Fig. 8 Normal signal-vs-time graph in voxels along the right mid-dle cerebral artery (MCA) for a GE EPI and SE EPI sequence. These curves are used as arterial input function to calculate CBF. The signal drop is larger for GE EPI sequences compared with SE EPI sequences
interval, the labelled, inverted or saturated arterial blood spins enter the brain slice of interest and decrease the overall magnetization of this slice. The inflow of la-belled spins generally produces a signal change of 1–2%. The degree of signal change is directly related to the CBV and CBF [22, 23].
Fig. 9a–c A 1-day-old male (39 weeks of gestation) with acute neonatal stroke. The child presented with tonic clonic seizures at 24 h of age. a An extensive, wedge-shaped left MCA stroke is seen on T2-weighted fast-spin-echo (FSE) images. The lesion is barely seen on the fluid-attenuated inversion recovery (Flair) se-quence. b The lesion is markedly hyperintense on isotropic diffu-sion-weighted images (DWI) and hypointense on the apparent dif-fusion coefficient (ADC) maps indicating acute neonatal stroke with decreased diffusion. The left posterolateral thalamus is also involved. c The perfusion maps show a decreased CBF, slightly increased CBV and a prolonged MTT/TTP matching the area of diffusion abnormality. No additional areas of perfusion abnormali-ties are encountered
Arterial spin labelling techniques measure steady-state tracer levels by using the T1 magnetization steady-state of the arterial spins themselves as a freely diffusible tracer. This has two advantages. First of all, steady-state meth-ods allow multiple measurements or averaging perimeth-ods to boost the SNR. Secondly, the free diffusion characteris-tics of the “tracer” give us in analogy to the magnetic susceptibility contrast techniques microvascular-weight-ed information. As soon as the labellmicrovascular-weight-ed spins reach the brain slice of interest, the labelled spins diffuse into the extracellular space and interact with tissue spins or basi-cally the tissue water.
The signal changes can be displayed by subtracting the image after spin labelling from a control image be-fore spin labelling. The recorded signal changes are di-rectly related to the CBF and CBV. Consequently, abso-lute CBV and CBF parameters are calculated. Additional advantages of ASL are the insensitivity to susceptibility artefacts which enhances the reliability of measurements near the skull base and the possibility to selectively label arteries by unilateral or localized labelling coils. This al-lows examination of different vascular territories inde-pendently which can be used to evaluate the functional efficiency of collateral vascular supplies. A major disad-vantage is the low signal change (1–2%) and conse-quently the low SNR that requires long acquisition times (up to 10 min), making the technique susceptible for mo-tion artefacts. This can be especially troublesome in chil-dren. Only few reports are available on the use of ASL in children [24].
Perfusion-weighted imaging in children
Cerebrovascular disease (CVD) in children includes pri-mary (e.g. acute embolic stroke, pripri-mary vasculopathies, arteriovenous malformations) and secondary vascular disorders (e.g. sickle cell disease, metabolic diseases, collagen vascular disorders, inflammatory/para-inflam-matory conditions). In secondary disorders, the cerebro-vascular system is not the primary site of pathology but
gets affected during the disease course. Secondary CVD in children tend to be more often thrombotic than embol-ic [25].
Because CVD is more prevalent in children than pre-viously thought, [25] and represents a significant source of morbidity and mortality [25], the need for a minimally invasive and reliable haemodynamic imaging tool is ob-vious. The non-invasive character of PWI, the suscepti-bility for microvascular haemodynamic alterations, the short acquisition times, the lack of ionizing radiation and the presently widespread availability of MRI scanners make PWI ideally suited for children. In addition, the faster heart rate, the smaller total blood volume and the smaller size of the brain in children are advantageous. PWI can easily be added to conventional MRI integrat-ing conventional–anatomical and functional–haemody-namic data (Figs. 9, 10, 11, 12, 13).
The indications for PWI in children are similar to those in adults. Most experience has thus far been col-lected for cerebrovascular occlusive diseases (cerebral ischaemia) and for intracranial neoplasm (e.g. tumour grading, differentiation between tumour recurrence and radiation necrosis). Other potential applications include hypoxic ischaemic encephalopathy or perinatal asphyxia, near drowning, intoxications, metabolic diseases, head trauma, migraine, epilepsy and any kind of cerebral dis-ease that is accompanied by changes in the cerebral haemodynamics.
Perfusion-weighted MRI studies can possibly provide more insight into the understanding of the normal and pathological development and maturation of the brain. Furthermore, PWI could give important data about
mour angiogenesis allowing a better understanding of tu-mour growth and the presumed relation between perfu-sion and malignancy grade. PWI can also be used to guide and monitor treatment.
Developmental changes
of cerebral haemodynamics in children
Knowledge about the normal pattern of brain perfusion as well as normal values of brain perfusion in the devel-oping brain are essential for interpreting disease-related changes in cerebral perfusion. Because the child’s brain is subject to a continuous maturation, perfusion values are expected to change during the progressing myelin-ation/maturation. Currently, limited PWI results are available; most information has been extracted from PET and SPECT studies [26, 27].
Tokumaru et al. [26] studied the 123I-IMP uptake in the developing brain by SPECT. Their study showed that changes in 123I-IMP uptake parallel both temporally and topographically the changes in T1 and T2 relaxation times due to progressing myelination confirming the tight relation between cerebral perfusion and myelination as postulated by von Monakow at the beginning of the past century [28].
The change in the regional distribution and magnitude of perfusion in the maturing brain likely reflects the ana-tomic evolution of the cerebral vasculature. This process appears to be markedly influenced by the brain’s func-tional and metabolic status. As neurons or neuronal cen-ters approach maturity, they recruit an increasingly rich Fig. 10a–c A 19-month-old
boy with severe anoxic brain injury due to prolonged cardiac arrest. a Conventional MRI shows a discrete T2-hyperin-tensity within the posterior as-pects of both lentiform nuclei and thalami. b The lesions are DWI hyperintense with associ-ated ADC hypointensity indi-cating decreased diffusion. c Haemodynamic imaging re-veals an increased CBV and CBF (MTT consequently un-changed) related to post-isch-aemic hyperaemia
capillary network [29]. High blood flow is seen in my-elinating and myelinated areas of the brain during the neonatal period that may reflect the increased energy de-mands of the biosynthetic processes associated with pro-gressing myelination [30, 31]. Blood flow to the white matter has been shown to be much higher during matura-tion than at completed maturamatura-tion. These findings support the theory that progressing myelination increases the met-abolic demand and consequently the CBF [30]. Another explanation is that myelination, CBF and cerebral meta-bolic rates are all related to increasing activity in specific regions of the brain that are functionally important during specific developmental periods [26]. Takahashi et al. [27]
found that CBF is lower in the neonatal period than in older children and adults, increases significantly during early childhood with a peak around 7 years and finally gradually reaches adult values during adolescence. They also showed age-dependent regional differences in cere-bral perfusion. The last area in which the cerecere-bral perfu-sion increases appeared to be the frontal association cor-tex, whereas the cerebral perfusion was prominent in the occipital lobe in every age group. The dynamic changes in cerebral perfusion parallel the physiological develop-mental state within the different brain areas.
Ball and Holland [25] evaluated more than 1000 PWI examinations performed in children between 6 days and 18 years. The normal grey-to-white-matter CBV ratio ranged between 3 and 4:1. Higher ratios were seen in children under 2–3 years of age. In healthy children, CBV, CBF and MTT maps should always be symmetri-cal for both hemispheres (Fig. 6).
PWI in cerebral ischaemia
Perfusion-weighted MRI has proved its value in acute cerebral ischaemia [6]. Diffusion-weighted MRI (DWI) identifies tissue injury (cytotoxic oedema) within min-utes after ischaemia [32]. PWI in combination with DWI can detect critical cerebral hypoperfusion before neuro-nal cell injury becomes irreversible and can identify tis-Fig. 11a–d A 12-year-old boy with sickle cell disease. On the day
of MRI a third stroke event occurred with mild right-sided weak-ness and severe language defects. a Conventional MRI including T2 FSE and contrast-enhanced T1 SE imaging showed a discrete T2 FSE hyperintensity within the left frontal, parietal and insular cortical regions as well as a discrete leptomeningeal, sulcal en-hancement. b The DWI shows multiple hyperintense, ischaemic lesions with decreased diffusion in the previously mentioned loca-tions. c The CBF and CBV maps reveal a large area of hypoperfu-sion involving the left ACA and MCA territories. The MTT is markedly prolonged. The mismatch between DWI and PWI abnor-mality indicates tissue at risk for future infarction. d Follow-up imaging several months later showed a new, subacute T2 FSE hy-perintense ischaemia within the area of initial hypoperfusion de-spite several blood transfusions
sue at risk for future infarction. The combination of DWI and PWI allows discrimination between the core of in-farction and the ischaemic penumbra. The core most probably represents irreversibly injured tissue, whereas the penumbra is believed to represent ischaemic but via-ble brain tissue [33]. Schlaug et al. [34] hypothesized that the ischaemic penumbra can be defined operational-ly by correlating the area of initial diffusion abnormality with the area of hypoperfusion on PWI. Matching areas of DWI and PWI abnormalities are considered as a pos-sible imaging correlate to the core of the infarction, whereas a DWI/PWI mismatch (PWI>DWI) is consid-ered to correlate with the ischaemic penumbra (Figs. 9, 10, 11) [34]. Major advantages are that treatment can be started before tissue injury is irreversible, infarct pro-gression can be limited, and possible preventive treat-ments for tissue at risk for infarction can be considered.
Perfusion-weighted MRI can also be of importance to identify spontaneous reperfusion [6]. Reperfusion can save ischaemic but viable, temporarily hypoperfused brain tissue. Reperfusion is, however, also thought to be associated with secondary injury to the brain [35]. So-called reperfusion injury with decoupling of CBV, CBF and metabolic rate can be the target of neuroprotective
treatments. Reperfusion injury is believed to be related to secondary injury in perinatal asphyxia [35].
One of the most important contributions of PWI in the management of children with acute neurological def-icits is to rule out cerebral ischaemia. In most cases of acute neurological symptoms, cerebral ischaemia is in-cluded in the differential diagnosis despite the fact that many other diseases can present with acute deficits. Be-cause conventional MRI can be misleading in the early stages of ischaemia and a possible delay in starting treat-ment can have far-reaching consequences, the exclusion of acute cerebral ischaemia by PWI/DWI is as valuable as the identification of cerebral ischaemia.
Finally, PWI may also be helpful in differentiating ve-nous from arterial infarction. In veve-nous infarction, an ar-terial deficit may be absent, whereas in arar-terial occlusion an arterial deficit is always present. In addition, the sig-nal recovery due to the passage of Gd is markedly de-layed in venous infarction, whereas this delay can be ab-sent in arterial infarction [25, 36].
PWI in primary or secondary cerebral
vasculopathies
Moya-Moya disease is one of the most frequent and best-known primary cerebral vasculopathy in children with chronic progressive, large vessel obstructive disease. Sec-ondary vasculopathies in children include homozygous sickle cell disease (Fig. 11), idiopathic vasculitis, second-ary vasculitis and various metabolic diseases.
Perfusion-weighted MRI is very important in evaluat-ing the cerebral haemodynamics especially concernevaluat-ing possible collateral circulations. PWI may reveal the col-lateral perfusion, give information about the significance of this collateral supply and possibly predict the likeli-hood of the haemodynamic success of a bypass.
Perfusion-weighted MRI has been proven to be useful in the diagnosis and follow-up of children with Moya-Moya disease [37, 38, 39]. In the initial presentation, an increased flow in the basal ganglia next to perfusion defi-cits and altered transit times within the cortex are ob-served. In the late stadium, PWI is helpful in assessing the chronic hypoperfusion. In contrast to SPECT, PWI allows to determine if the remaining cerebral perfusion results from the great cerebral arteries or from collaterals. The re-construction of perfusion maps, especially CBF maps, can be difficult. The progressive stenosis of the great cerebral arteries makes it difficult to find a reliable AIF.
PWI in cerebral tumours
Several studies in adult patients have linked tumour grade with changes in CBF. One study indicated that tu-mours with any regional CBV value over twice that of Fig. 12a, b An 11-year-old girl with a low-grade astrocytoma.
a Conventional MRI revealed a hypothalamic/chiasmatic astrocy-toma. The lesion is slightly T1 hyperintense due to an intra-lesio-nal haemorrhage. b The lesion is both DWI and ADC hyperin-tense with a hypoinhyperin-tense peripheral ring that results from suscepti-bility effects related to the intra-lesional haemorrhage. The low CBV and CBF map values are consistent with the low malignancy grade of the tumour. The haemodynamic maps have been correct-ed for a possible leaky blood-brain barrier
the white matter have a high likelihood of having high-grade components, whereas tumours with maximum CBV values less that of 1.5 times white matter are usual-ly low grade [40]. Since maps of CBF have become available only recently, few studies have focused on cor-relating CBF with tumour grade. Initial results indicate a similar relation between CBF and tumour grade [41]. These links between tumour grade and cerebral haemo-dynamics could, however, not yet be reproduced for pae-diatric brain tumours (Figs. 12, 13). Ball and Holland re-Fig. 13a–c A 16-year-old girl with a fourth ventricle haemangio-blastoma. a Conventional MRI shows a T2-hyperintense, contrast-enhancing midline tumour within the region of the foramen of Magendie. Multiple, enlarged tumour vessels within the tumour and within the adjacent cerebro-pontine cisterns are seen. b The tumour is DWI hypointense and ADC slightly hyperintense. c The CBV and CBF values are markedly increased due to the high vas-cularity of the tumour. The MTT is also increased
ported similar CBF values for pilocytic astrocytomas and medulloblastomas [25].
Most authors agree over the value of PWI in differen-tiating tumour recurrence from complications of radia-tion therapy or chemotherapy. Imaging findings can be indistinguishable on conventional MRI [42]. PWI can, however, distinguish between radiation necrosis and via-ble tumour. Tumour tissue will show normal or increased haemodynamic parameter (CBV), whereas radiation ne-crosis is characterized by decreased CBV values [43]. Similar reductions in CBV are encountered in tissue in-jury and necrosis related to chemotherapy [44].
Brain tumours often display different grades of malig-nancy in different areas of the tumour bulk. Correct tu-mour grading relies on the biopsy of the tutu-mour compo-nents with the highest grade of malignancy. Haemody-namic maps can be helpful in directing biopsies to the areas of highest malignancy (increased CBV) [45]. Cur-rently, no prospective studies have been published in paediatric brain tumours.
One of the most exciting fields of active research in haemodynamic imaging of brain tumours is focused on characterizing tumour angiogenesis. Angiogenesis refers to the ability of tumours to induce the proliferation of new blood vessels (neovascularization). Angiogenesis is believed to play an important role in the growth and spread of cancer. Once a malignant cell transformation has occurred, every increase in tumour cell population must be preceded by an increase in new capillaries con-verging to the tumour [46, 47].
Tumour vessels differ from vessels in normal tissue both qualitatively and quantitatively. Tumour vessels are usually disorderly and often large, dilated and tortuous with increased distances between the separate vessels. In addition, average tumour vessels have diameters two to three times that of normal tissue. Furthermore, during the initial formation of the tumour vascular bed, capillary sprouts and blind-ended microaneurysm-like saccular ves-sels are observed at the tumour margins. With the
progress-ing evolution of the vascular bed and progressprogress-ing tumour size, these buds anastomose to other new vessels with con-tinuous increase of vessel size [48, 49]. The microvascular architecture and the disorganization of neovascularity with multiple blind-ending vessels and other morphological changes are believed to be responsible for significant matches between CBF and CBV in tumours. These mis-matches can represent a biomarker of disorganization and tumour malignancy. The CBF–CBV mismatch possibly correlates with how many angiogenic vessels are present, since many angiogenic vessels are blind ending.
Techniques which could serially evaluate angiogene-sis non-invasively would be extremely valuable to better understand tumour growth, tumour expansion, and pro-gressing tumour vascularization. In addition, the results from anti-angiogenic therapeutic agents or treatments could be monitored, thereby providing insight into why anti-angiogenic therapy succeeds or fails.
Few angiogenesis-specific imaging tools are currently available. Preliminary data suggest that the distribution of
capillary size can be extracted from PWI techniques. Spin-echo PWI sequences show a significant degree of microvascular weighting compared with a more uniform vessel size dependence seen on GE PWI sequences. In other words, the degree of flow-related signal changes on SE EPI sequences depends on the vessel size, whereas sig-nal changes on GE sequences are less dependent on the vessel size [50]. This difference in signal decay can be used to determine average capillary diameter in a voxel [51]. The ratio of the change in T2* and T2 relaxation rate increases nearly linearly with vessel size and therefore may provide an indication of the average vessel size with-in a voxel allowwith-ing to measure the degree of angiogenesis. This information can be achieved by interleaving a SE with a GE sequence during a single injection of contrast agent. Next to the possibility of mapping vessel size distri-bution, CBV and CBF can easily be measured by PWI. Consequently, PWI could serve as a promising technique to visualize tumour angiogenesis, and can consequently be used to monitor anti-angiogenic therapies in the future.
References
1. Roy CS, Sherrington CS (1890) J Physiol (Lond) 11:85–108
2. Grubb RL Jr, Raichle ME, Eichling JO, Ter-Pogossian MM (1974) The effects of changes in PaCO2on cerebral blood volume, blood flow, and vascular mean transit time. Stroke 5:630–639 3. Powers WJ (1991) Cerebral
hemody-namics in ischemic cerebrovascular disease. Ann Neurol 29:231–240 4. Powers WJ, Grubb RL, Raichle ME
(1984) Physiological responses to focal cerebral ischemia in humans. Ann Neurol 16:546–552
5. Zaharchuk G, Mandeville JB, Bogdonov AA Jr, Weissleder R, Rosen BR, Marota JJ (1999) Cerebrovascular dynamics of autoregulation and hypo-perfusion: an MRI study of CBF and changes in total and microvascular ce-rebral blood volume during hemorrhag-ic hypotension. Stroke 30:2197–2203 6. Sorensen AG, Copen WA, Ostergaard
L, Buonanno FS, Gonzalez RG, Rordorf G, Rosen BR, Schwamm LH, Weiskoff RM, Koroshetz WJ (1999) Hyperacute stroke: simultaneous mea-surement of relative cerebral blood volume, relative cerebral blood flow, and mean tissue transit time. Radiology 210:519–527
7. Belliveau JW, Rosen BR, Kantor HL, Rzedzian RR, Kennedy DN,
McKinstry RC, Vevea JM, Cohen MS, Pykett IL, Brady TJ (1990) Functional cerebral imaging by susceptibility-contrast NMR. Magn Reson Med 14:538–546
8. Rosen BR, Belliveau JW, Buchbinder BR, McKinstry RC, Porkka LM, Kennedy DN, Neuder MS, Fisel CR, Aronen HJ, Kwong KK, Brady TJ (1991) Contrast agents and cerebral hemodynamics. Magn Reson Med 19:285–292
9. Rosen BR, Belliveau JW, Vevea JM, Brady TJ (1990) Perfusion imaging with NMR contrast agents. Magn Reson Med 14:249–265
10. Le Bihan D, Breton E, Lallemand D, Grenier P, Cabanis E, Laval-Jeantet M (1986) MR imaging of intravoxel inco-herent motions: application to diffusion and perfusion in neurologic disorders. Radiology 161:401–407
11. Boxerman JL, Hamberg LM, Rosen BR, Weisskoff RM (1995) MR contrast due to intravascular magnetic suscepti-bility perturbations. Magn Reson Med 34:555–566
12. Villringer A, Rosen BR, Belliveau JW, Ackerman JL, Lauffer RB, Buxton RB, Chao YS, Wedeen VJ, Brady TJ (1988) Dynamic imaging with lanthanide chelates in normal brain: contrast due to magnetic susceptibility effects. Magn Reson Med 6:164–174 13. Stewart GN (1893) Research on the
circulation time in organs and on the influences which affect it. J Physiol 15:1–89
14. Meier P, Zierler KL (1954) On theory of indicator-dilution method for mea-surement of blood flow and volume. J Appl Physiol 6:731–744
15. Weisskoff RM, Zuo CS, Boxerman JL, Rosen BR (1994) Microscopic suscep-tibility variation and transverse relax-ation: theory and experiment. Magn Reson Med 31:601–610 16. Boxerman JL, Rosen BR, Weisskoff
RM (1997) Signal-to-noise analysis of cerebral blood volume maps from dynamic NMR imaging studies. J Magn Reson Imaging 7:528–537 17. Ogawa S, Lee TM, Kay AR, Tank DW
(1990) Brain magnetic resonance imag-ing with contrast dependent on blood oxygenation. Proc Natl Acad Sci USA 87:9868–9872
18. Ogawa S, Lee TM, Nayak AS, Glynn P (1990) Oxygenation-sensitive contrast in magnetic resonance image of rodent brain at high magnetic fields. Magn Reson Med 14:68–78
19. Lev MH, Kulke SF, Sorensen AG, Boxerman JL, Brady TJ, Rosen BR, Buchbinder BR, Weisskoff RM (1997) Contrast-to-noise ratio in functional MRI of relative cerebral blood volume with sprodiamide injection. J Magn Reson Imaging 7:523–527
20. Perthen JE, Calamante F, Gadian DG, Connelly A (2002) Is quantification of bolus tracking MRI reliable without deconvolution? Magn Reson Med 47:61–67
21. Calamante F, Gadian DG, Connelly A (2002) Quantification of perfusion us-ing bolus trackus-ing magnetic resonance imaging in stroke: assumptions, imita-tions, and potential implications for clinical use. Stroke 33:1146–1151 22. Detre JA, Leigh JS, Williams DS,
Koretsky AP (1992) Perfusion Imag-ing. Magn Reson Med 23:37–45 23. Detre JA, Alsop DC, Vives LR, Maccotta L, Teener JW, Raps EC (1998) Noninvasive MRI evaluation of cerebral blood flow in cerebrovascular disease. Neurology 50:633–641 24. Born AP, Rostrup E, Miranda MJ,
Larsson HBW, Lou HC (2002) Visual cortex reactivity in sedated children examined with perfusion MRI (FAIR). Magn Reson Imaging 20:199–205 25. Ball WS Jr, Holland SK (2001)
Perfusion imaging in the pediatric patient. Magn Reson Imaging Clin N Am 9:207–230
26. Tokumaru AM, Barkovich AJ, O uchi T, Matsuo T, Kusano S (1999) The evolution of cerebral blood flow in the developing brain: evaluation with iodine-123 iodoamphetamine SPECT and correlation with MR imaging. Am J Neuroradiol 20:845–852 27. Takahashi T, Shirane R, Sato S,
Yoshimoto T (1999) Developmental changes of cerebral blood flow and oxygen metabolism in children. Am J Neuroradiol 20:917–922 28. Monakow C von (1900) Uber die
pro-jektions und die assoziationszentren im grosshirn. Monatsschr Psychiatrie 8:405–420
29. Craigie EH (1924) Changes in the vascularity in the brain stem and cerebellum of the albino rat between birth and maturity. J Comp Neurol 38:27–48
30. Kennedy C, Grave GD, Jehle JW, Sokoloff L (1970) Blood flow to white matter during maturation of the brain. Neurology 20:613–618
31. Kennedy C, Grave GD, Jehle JW, Sokoloff L (1972) Changes in blood flow in the component structures of the dog brain during postnatal maturation. J Neurochem 19:2423–2433
32. Gonzalez RG, Schaefer PW, Buonanno FS, Shwamm LH, Budzik RF, Rordorf G, Wang B, Sorensen AG, Koroshetz WJ (1999) Diffusion-weighted MR im-aging: diagnostic accuracy in patients imaged within 6 hours of stroke symp-tom onset. Radiology 210:155–162 33. Kaufmann AM, Firlik AD, Fukui MB,
Wechsler LR, Jungries CA, Yonas H (1999) Ischemic core and penumbra in human stroke. Stroke 30:93–99 34. Schlaug G, Benfield A, Baird AE,
Siewert B, Lovblad KO, Parker RA, Edelman RR, Warach S (1999) The ischemic penumbra: operationally de-fined by diffusion and perfusion MRI. Neurology 53:1528–1537
35. Davis R, Bulkley G, Traystman R (1988) Role of oxygen free radicals in focal brain ischemia. In: Tomita M, Sawada T, Naritomi H, Weiss W-D (eds) Cerebral hyperemia and isch-emia: from the standpoint of cerebral blood volume. Excerpta Medica, Amsterdam, pp 151–156
36. Keller E, Flacke S, Urbach H, Schild HH (1999) Diffusion- and perfusion-weighted magnetic resonance imaging in deep cerebral venous thrombosis. Stroke 30:1144–1146
37. Tzika AA, Robertson RL, Barnes PD, Vajapeyam S, Burrows PE, Treves ST, Scott RM (1997) Childhood Moya-moya disease: hemodynamic MRI. Pediatr Radiol 27:727–735 38. Tsuchiya K, Inaoka S, Mitzutani Y,
Hachiya J (1998) Echo-planar perfu-sion MR of Moyamoya disease. Am J Neuroradiol 19:211–216 39. Calamante F, Ganesan V, Kirkham FJ,
Jan W, Chong WK, Gadian DG, Connelly A (2001) MR perfusion im-aging in Moyamoya syndrome: poten-tial implications for clinical evaluation of occlusive cerebrovascular disease. Stroke 32:2810–2816
40. Aronen HJ, Gazit IE, Louis DN, Buchbinder BR, Pardo FS, Weisskoff RM, Harsh GR, Cosgrove GR, Halpern EF, Hochberg FH, Rosen BR (1994) Cerebral blood volume maps of gliomas: comparison with tumor grade and histologic findings. Radiology 191:41–51
41. Knopp EA, Cha S, Johnson G, Mazumdar A, Golfinos JG, Zagzag D, Miller DC, Kelly PJ, Kricheff II (1999) Glial neoplasms: dynamic contrast-enhanced T2*-weighted MR imaging. Radiology 211:791–798
42. Taylor JS, Tofts PS, Port R, Evelhoch JL, Knopp M, Reddick WE, Runge VM, Mayr N (1999) MR imaging of tumor microcirculation: promise for the new millenium. J Magn Reson Im-aging 10:903–907
43. Aronen HJ, Glass J, Pardo FS, Belliveau JW, Gruber ML, Buchbinder BR, Gazit IE, Linggood RM, Fischman AJ, Rosen BR (1995) Echo-planar MR cerebral blood volume mapping of gliomas. Clinical utility. Acta Radiol 36:520–528
44. Rempp KA, Brix G, Wenz F, Becker CR, Gückel F, Lorenz WJ (1994) Quantification of regional cerebral blood flow and volume with dynamic susceptibility contrast-enhanced MR imaging. Radiology 193:637–641
45. Sorensen AG, Rosen BR (1996) Func-tional MRI of the brain. In: Atlas-Scott W (ed) Magnetic resonance imaging of the brain and spine. Lippincott-Raven, Philadelphia, pp 1501–1545
46. Folkman J (1971) Tumor angiogenesis: therapeutic implications. N Engl J Med 285:1182–1186
47. Folkman J, Klagsbrun M (1987) Angiogenic factors. Science 235:442–447
48. Wesseling P, van der Laak JA, Link M, Teepen HL, Ruiter DJ (1998) Quantita-tive analysis of microvascular changes in diffuse astrocytic neoplasms with in-creasing grade of malignancy. Human Pathol 29:352–358
49. Zama A, Tamura M, Inoue HK (1991) Three-dimensional observations on microvascular growth in rat glioma using a vascular casting method. J Cancer Res Clin Oncol 117:396–402 50. Weisskoff RM, Zuo CS, Boxerman JL,
Rosen BR (1994) Microscopic susceptibility variation and transverse relaxation: theory and experiment. Magn Reson Med 31:601–610 51. Dennie J, Mandeville JB, Boxerman
JL, Packard SD, Rosen BR, Weisskoff RM (1998) NMR imaging of changes in vascular morphology due to tumor angiogenesis. Magn Reson Med 40:793–799