ORIGINAL PAPER
Towards chemical analysis of nanostructures in biofilms I:
imaging of biological nanostructures
Thomas Schmid&Johannes Burkhard&
Boon-Siang Yeo&Weihua Zhang&Renato Zenobi
Received: 23 December 2007 / Revised: 20 March 2008 / Accepted: 25 March 2008 / Published online: 22 April 2008 # Springer-Verlag 2008
Abstract Due to their direct influence on the stability of bacterial biofilms, a better insight into the nanoscopic spatial arrangement of the different extracellular polymeric substances (EPS), e.g., polysaccharides and proteins, is important for the improvement of biocides and for process optimization in wastewater treatment and biofiltration. Here, the first application of a combination of confocal laser-scanning microscopy (CLSM) and atomic force microscopy (AFM) to the investigation of river-water biofilms and related biopolymers is presented. AFM images collected at selected areas of CLS micrographs dramatically demonstrate the heterogeneity of biofilms at the nanometer scale and the need for a chemical imaging method with nanoscale resolution. The nanostructures (e.g., pili, flagella, hydrocolloids, and EPS) found in the extracellular matrix are classified according to shape and size, which is typically 50–150 nm in width and 1–10 nm in thickness, and sets the demands regarding spatial resolution of a potential chemical imaging method. Additionally, thin layers of the polysaccharide alginate were investigated. We demonstrate that calcium alginate is a good model for the EPS architecture at the nanometer scale, because of its similar network-like structure.
Keywords Biofilm . Extracellular polymeric substances (EPS) . Alginate . Confocal laser-scanning microscopy (CLSM) . Atomic force microscopy (AFM)
Introduction
Biofilms are the predominant life form of bacteria in natural environments and play important roles in medicine, industry, and biotechnology [1–3]. In natural systems few bacteria live as isolated cells; most cells colonize solid surfaces by attachment via nanometer-sized structures on their cell wall, i.e., pili and flagella. Subsequently, the attached cells form clusters, microcolonies, and finally biofilms [4, 5]. Biofilms are aggregates of bacteria and other microorganisms that are embedded in a hydrogel matrix consisting of water and extracellular polymeric substances (EPS), which are microbially generated biopoly-mers, such as polysaccharides, proteins, humic substances, and DNA [2, 6, 7]. Inside biofilms, bacteria can form microconsortia with relatively high mechanical stability and cell density. The EPS matrix can adsorb nutrients and is a protective barrier against biocides, changes of the physico-chemical conditions, and phagocytosis [8]. In wastewater treatment plants, immobilized microorganisms and sus-pended biofilm flocs are used to degrade contaminants [9]. In other technical processes, biofilm formation causes many problems, which are referred to as ‘biofouling’ [8]. As biofilms can provide a habitat for pathogenic microorgan-isms, they can be the cause of persistent infections [10,11]. Biofilm formation is governed by nanometer-sized struc-tures with different chemical compositions. A detailed knowledge of structure and composition of the EPS hydrogel is necessary for optimization of biocides and wastewater treatment, but the role and arrangement of the different biopolymers are largely unknown due to the lack of chemical information or insufficient spatial resolution provided by the microscopy techniques used so far.
Confocal laser-scanning microscopy (CLSM) is one of the standard techniques used for biofilm analysis [12]. For exam-DOI 10.1007/s00216-008-2100-2
T. Schmid
:
J. Burkhard:
B.-S. Yeo:
W. Zhang:
R. Zenobi (*) Department of Chemistry and Applied Biosciences, ETH Zurich, 8093 Zurich, Switzerlandple, fluorescently labeled lectins, which can bind selectively to carbohydrate monomers of the EPS polysaccharides, were employed for investigation of the biofilm matrix by CLSM [13]. However, as EPS are a highly complex mixture of different biopolymers, which provide a high number of potential binding sites, detection of lectins inside the biofilm matrix is not necessarily due to the presence of specific targets, since nonspecific binding always has to be considered in the staining of biofilms [2]. In general, labeling requires prior knowledge of the target’s presence and the modifica-tion of the sample by incorporamodifica-tion of the label. Besides the necessity of staining the sample, the limited spatial resolu-tion is another drawback of CLSM. The diffracresolu-tion barrier limits the lateral resolution of an optical microscope to approximately half the wavelength of light, i.e., λ/2. Thus, the determination of the distribution of nanometer-sized bundles and clusters of biopolymers in the EPS matrix is not possible by CLSM analysis. Wet chemical analysis of microtome cuts allows label-free depth-resolved analysis of biofilms, but the depth resolution is restricted to approx. 200μm [14]. On the other hand, atomic force microscopy (AFM) has been successfully applied for nanometer-scale imaging of bacteria. AFM images reveal bacteria and extracellular nanostructures [15–17]. The main drawback of AFM in this context is the lack of chemical information.
In this study we present a new strategy for nanometer-scale investigation of biofilms and related biopolymers. A combination of CLSM with AFM gives enhanced insight by providing high-resolution AFM images of selected areas of a CLS micrograph. The combination of CLSM with AFM has already been described in the literature [18–20]. For example, a comparison of CLSM and AFM images taken independently on similar (but not identical) areas of neuron samples has demonstrated the potential of combin-ing the information obtained by both techniques [21]. One of the key innovations shown in the present study is to apply CLSM and AFM on exactly the same part of biofilm samples. Additionally, our setup can be combined with a Raman spectrograph and used for tip-enhanced Raman spectroscopy (TERS), a promising technique to obtain chemical information of nanostructures in biofilms as described in a companion paper, where we present the application of TERS to a model system for EPS poly-saccharides composed of alginate [22]. In order to demonstrate the imaging capability of this system, samples of river-water bacteria and biofilms as well as alginate hydrogel samples were investigated. Alginates are poly-saccharides, which play an important role as EPS compo-nents in certain biofilms [23] and were already used as a biofilm model in former studies [24]. In our experiments, alginates were investigated in the form of thin layers and calcium alginate hydrogels. Strategies for preparation of biofilm and biopolymer samples for AFM are described.
The AFM images demonstrate the heterogeneity of the extracellular fraction of biofilms at the nanometer scale. For the first time, extracellular nanostructures in biofilms from a natural environment were studied by AFM and classified according to size and shape. In contrast to laboratory cultures, these samples contain EPS generated by the bacteria under investigation as well as hydrocolloids from other sources. The nanostructures present on the AFM images were assigned to pili, flagella, river-water hydro-colloids, and EPS network structures. The results show the necessity for chemical imaging of such and similar samples with nanometer-scale resolution. Only by coupling this imaging technique with a spectroscopic method can one study the chemical identity of the different nanostructures as well as the distribution of different biopolymers inside the EPS network and their interactions. A promising tool in this field is tip-enhanced Raman spectroscopy (TERS) [25,
26], which can be realized by combining this CLSM-AFM setup with a Raman spectrometer. Metal-coated AFM tips in the laser focus can locally enhance the Raman signals and provide vibrational fingerprint spectra from submi-crometer squared areas, which allow a qualitative analysis of the molecular composition of the sample. The lateral resolution of a TERS experiment is typically 20–50 nm [27]. The size of the nanostructures found in biofilms is thus compatible with the resolution of TERS.
As described in the literature, alginates are a good model system for biofilm EPS owing to their similar macroscopic physicochemical properties [23,24,28]. Here, we demon-strate the similarity of biofilm EPS and calcium alginate hydrogel at the nanoscale. In a companion paper, the capa-bility of TERS for collecting Raman spectra of biopolymer nanostructures will be demonstrated by the analysis of nanometer-sized calcium alginate fiber bundles [22].
Experimental Apparatus
A homebuilt combination of an AFM (Explorer, Veeco Instruments, Santa Barbara, CA, controlled by SPMLab software, Veeco Instruments) and an inverted CLSM (FluoView FV500, Olympus, Melville, NY) was employed in this study [29]. Figure 1 shows the measurement principle of the apparatus. Samples were coated onto transparent glass slides and placed on top of the inverted CLSM. For optical imaging, a continuous-wave laser beam was coupled into the CLSM and focused onto the sample by a ×60/1.4 N.A. oil immersion objective. For excitation, a compact diode-pumped solid-state laser with a wavelength of 488 nm (Chromalase, Blue Sky Research, Milpitas, CA) was used. The light backscattered (or emitted) by the
sample was collected by the same objective and detected by a photomultiplier tube (PMT). The AFM head can be mounted on top of the inverted CLSM by means of a custom-designed kinematic mount. Two set screws allow the rough alignment of the AFM tip with respect to the laser focus. In this way, an overlap between the x–y scan ranges of AFM (100 μm×100 μm maximum scan range) and CLSM (approx. 210μm×210 μm in the lowest magnifica-tion with this objective) can be achieved. AFM images with different contrast modes, such as topography, phase, and lateral force, were recorded simultaneously. For each biofilm image presented in this paper, the mode that showed the best contrast for bacteria and nanometer-sized extracellular struc-tures was chosen. Dimensions of different strucstruc-tures given in the text were derived from topography images. For image processing and analysis the software SPIP 4.2 (Image Metrology, Lyngby, Denmark) was employed.
Glass slides
All samples in this study were investigated in the form of thin layers on glass cover slips (Marienfeld, Lauda-Königshofen, Germany). Prior to usage, glass slides were cleaned by treatment with a 1:3 (v/v) mixture of 30% hydrogen peroxide and concentrated sulfuric acid (‘piranha solution’) at approx. 50 °C for 5 min, then rinsed with deionized water, and stored in methanol for 3 days at most. Before coating a cleaned cover slip with a sample, the slide was rinsed with methanol and dried under a continuous nitrogen gas flow.
Preparation of bacteria and biofilm samples
For optimization of sample preparation and AFM imaging parameters as well as for the AFM and CLSM measure-ments presented here, a mixture of river-water bacteria was
grown in a nutrient medium. This sample was chosen as a compromise between natural mixed-culture biofilms and highly reproducible bacteria samples grown under labora-tory conditions. In this way, extracellular substances such as river-water colloids were present in the samples, which are missing in laboratory cultures. A 200-mL sample of river water (river Limmat, Zurich, Switzerland; sample taken in the outflow region of a wastewater treatment plant) was collected in a wash bottle with a glass frit and mixed with the following nutrient salts: 8.4 mM sodium acetate, 0.44 mM potassium dihydrogenphosphate, 3.8 mM ammo-nium chloride, and 1.9 mM sodium sulfate. This nutrient medium has been used already in former biofilm studies [30, 31]. A continuous flow of approx. 0.5 L min−1 compressed air was fed into the wash bottle to achieve aerobic conditions and to continuously mix the culture medium. After 1 week of cultivation at room temperature, a significant increase in turbidity was observed and first samples were taken for AFM investigation (see below). Once a week, the mixture of nutrients described above was predissolved in a small amount of deionized water and added to the content of the wash bottle.
Alginate
An alginate stock solution was prepared by dissolving 2% (w/v) sodium alginate (Lancaster Synthesis, Alfa Aesar, Heysham, UK) in deionized water. For complete dissolu-tion, the alginate powder had to be hydrated overnight resulting in a clear, yellowish and highly viscous solution.
Results and discussion
Simultaneous CLSM and AFM imaging of bacteria samples In preliminary experiments we found that bacteria can be conveniently immobilized on cover slips by placing them upright onto the frit inside the wash bottle containing the nutrient medium. After approx. 20 h, the cover slips were taken out, rinsed with deionized water to remove nutrient salts and weakly bound material, and finally dried with a stream of nitrogen gas. After approx. 10 min of additional air-drying, the samples were investigated by AFM and/or CLSM. This sample preparation method yielded approx. 20–30 bacteria on a surface area of 100 μm2
.
The setup presented here allows combined investigation of the samples by AFM and CLSM. Imaging of selected parts of a CLS micrograph by AFM can provide detailed information on nanometer-sized structures, which cannot be resolved by CLSM. Figure 2 shows the feasibility of imaging the exact same part of a bacteria sample by using both techniques. It should be pointed out that no optical Fig. 1 Schematic of the
instru-mental setup (see text for details): PF plasma filter, BS beam splitter, PMT photomulti-plier tube
filters were used in front of the detector of the CLSM. Thus, the CLS micrograph is mainly based on backscatter-ing of the 488-nm excitation light and only to a minor degree on fluorescence emission. Nevertheless, the CLSM can be equipped with different sets of filters and allows— after staining of the samples—fluorescence imaging, which is one of the standard tools for biofilm analysis nowadays
[32]. Additionally, the CLSM can be coupled to a Raman spectrograph as described in a companion paper [22]. Collection of Raman spectra of selected parts of a biofilm sample with this setup was already shown in Ref. [33].
An appropriate overlap of the AFM and CLSM scan ranges can be achieved rapidly by means of two alignment screws. When the AFM tip is brought close to the sample (to within a few micrometers of the sample surface) and the z-plane of the CLSM is aligned slightly above the sample, the tip can be imaged while turning the two alignment screws, and can be easily placed on a specific part of the sample, thanks to the rapidly scanning galvanic mirrors of the CLSM. This is not possible with the AFM alone, since optical imaging systems that are usually integrated into AFM heads do not provide a sufficiently high magnifica-tion to visualize, for example, individual cells. Imaging of the tip and exact alignment of the laser focus on the tip end are important for TERS, whose application to alginates is described in a companion paper [22].
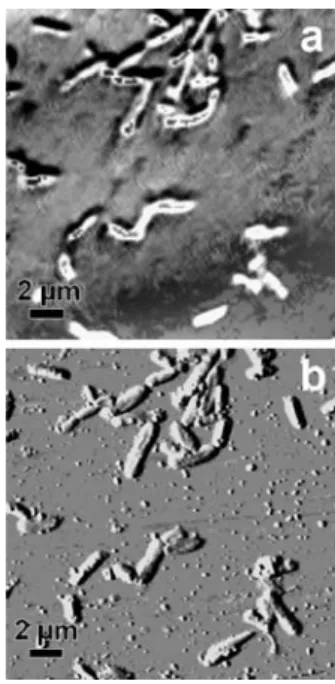
As can be seen, owing to the higher spatial resolution more details are visible on the AFM image, in particular nanometer-sized colloids, which lead only to a faint light-scattering pattern in the CLS micrograph. In Fig. 2b the gradient (i.e., the first-order derivative) of the AFM topog-raphy image is given, because it provides high contrast for bacteria and nanometer-sized extracellular structures. Typ-ical dimensions of the bacteria in this study varied between 1.5 and 2μm in length, 0.5 and 1 μm in width, and 100 and 200 nm in height. Similar results were obtained when the more selective MacConkey broth was employed instead of the nutrient medium described in the Experimental. This indicates that the main fraction of these samples were enterobacteriaceae.
Fig. 3 Tapping mode AFM images of extracellular structures: pili and flagella at one pole of a bacterium (a), flagella and hydrocolloids (b, c), and bacterial cells coated by an EPS layer (d). a–c are phase images, d is the gradient of a topography image. Structures indicated by arrows are mentioned in the text: flagella (1, 3, and 4), pili (2), and hydrocolloids (5)
Fig. 2 Imaging of the exact same part of a river-water bac-teria sample by CLSM (a) and AFM (b). The AFM measure-ment was performed in tapping mode and is based on the gra-dient of the topography image
Fig. 4 Contact mode AFM to-pography images of alginate samples: sodium alginate (a) and calcium alginate (b) networks
AFM imaging of extracellular structures
Figure 3a is a tapping mode phase image of a bacteria sample, which clearly shows flagella (indicated by arrow 1) and pili (arrow 2) on one pole of a bacterium. Pili are used by bacteria to attach to surfaces and can be identified in this case as several rigid rods that are spread out in a fan-like manner. The pili observed in this study usually had a length of <1.2 μm, a thickness of 1–2 nm, and a width of 50– 100 nm, which are typical dimensions of such structures [34]. Flagella could be distinguished from pili based on rigidity, size, and number. They are used by bacteria for moving in the liquid phase. On one bacterium, a maximum number of three flagella was observed. As can be seen on the structure indicated by arrow 1 in Fig. 3a, flagella are more flexible than the straight pili. More detailed pictures of flagella are shown in Fig.3b (arrow 3) and c (arrow 4). Typical dimensions of flagella were >2 μm in length, <4 nm in thickness, and 50–150 nm in width. Besides these linear structures on many samples, small spherical-shaped objects were found (see, for example, Fig.3a–c). Shape and
dimensions (50–150 nm in diameter and ca. 3 nm in thickness) let us assume that these structures are river-water colloids consisting of humic substances. Humic acids are the major organic fraction in aquatic systems and form spherically shaped colloids and aggregates similar to the structure indicated by arrow 5 in Fig.3c as shown by other AFM studies [35,36]. In order to confirm this assumption, a chemical analysis by TERS is the aim of further experiments. As several hydrocolloids on our AFM images were attached to flagella and pili, they probably have an influence on the bacterial adhesion in natural systems.
In order to prepare biofilms in the form of immobilized bacteria, which are embedded in a continuous layer of EPS matrix, a modified sample preparation method was applied. When glass slides were put directly onto the frit of the wash bottle, flow conditions and shear forces from air bubbles obviously prevented the adsorption of higher amounts of EPS material within 20 h. Therefore, a 20-mL aliquot of the contents of the wash bottle was transfered into a beaker, and glass slides were placed upright therein. After 1 week, they were removed, rinsed with deionized water, dried with
a stream of nitrogen gas, and analyzed by tapping mode AFM after approx. 10 min of additional air-drying. Figure 3d reveals an EPS layer which coats a glass slide, and two bacteria attached to it. The network-like structure— which was reproducible in repeated AFM measurements on the same sample area—consists of different biopolymers, which form a stable hydrogel. The elucidation of the dis-tribution of different biopolymers (e.g., polysaccharides and proteins) in this hydrogel is another goal of further TERS measurements.
In general, the AFM images of bacteria samples presented here demonstrate the high heterogeneity of bacterial aggregates at the nanometer scale. For identifica-tion of the different nanostructures, a spectroscopic tech-nique that provides nanometer-scale spatial resolution is needed. Due to their direct influence on the stability of biofilms, a better insight into the distribution of the dif-ferent extracellular nanostructures (e.g., pili, flagella, river-water colloids, EPS) is important for the improvement of biocides and for process optimization in wastewater treatment and biofiltration.
AFM imaging of alginates
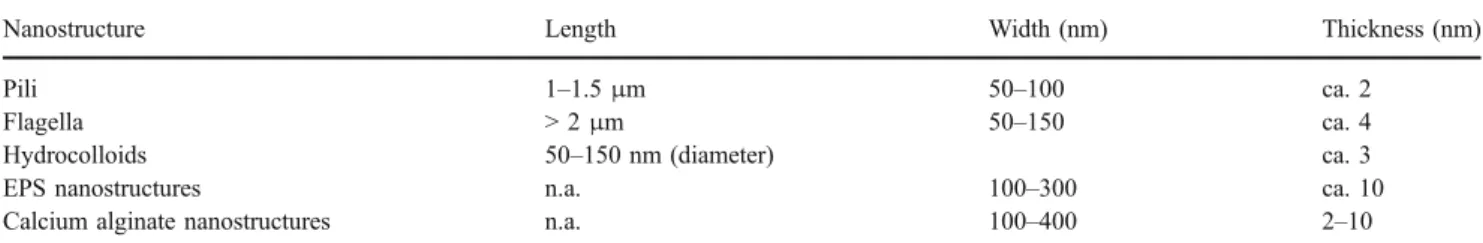
Alginates are linear, unbranched polysaccharides compris-ing guluronic acid and mannuronic acid monomer units in different sequences. Alginates cover a wide range of molecular weights, typically around 100 kDa, with maxi-mum values up to the megadalton range [37,38]. They are found in the EPS matrix of certain biofilms, such as the well-studied biofilms of Pseudomonas aeruginosa and Azotobacter vinelandii [39,40], and polysaccharide hydro-gels such as alginate hydro-gels are known to have physicochem-ical properties similar to those of biofilms [23,28]. Due to their length of up to a few micrometers, physical properties of the biofilm matrix, such as stability and viscosity, are mainly determined by EPS polysaccharides, whereas extracellular proteins with a size of a few nanometers play only a minor role [41]. Thus, alginates are thought to be a good physical model system for the investigation of biofilms and are at the same time important chemical representatives of EPS polysaccharides [24]. Figure 4 Table 1 Dimensions of nanostructures found in river-water biofilms and calcium alginate hydrogels determined by AFM
Nanostructure Length Width (nm) Thickness (nm)
Pili 1–1.5 μm 50–100 ca. 2
Flagella > 2μm 50–150 ca. 4
Hydrocolloids 50–150 nm (diameter) ca. 3
EPS nanostructures n.a. 100–300 ca. 10
Calcium alginate nanostructures n.a. 100–400 2–10
shows contact mode AFM topography images of three alginate samples. Spin coating of 50 μL sodium alginate solution (2% w/v) leads to a relatively homogeneous distribution of the polysaccharide chains on the glass slide (Fig. 4a). For preparation of calcium alginate hydrogels, sodium alginate layers were treated with 500 μL calcium chloride solution (0.2 M) directly after spin coating. After 5 min, the spin-coater was turned on again to remove the covering CaCl2 solution, and the sample was rinsed with
water to remove excess calcium salt. This treatment leads to cross-linking of polysaccharide chains by Ca2+ ions and formation of a three-dimensional network. In Fig. 4b calcium alginate fibers can be seen surrounding pores visible as dark round spots in the AFM image, with typical diameters of 50–300 nm. In the completely hydrated state, these are water-filled pores in a stable hydrogel. The transition from the relatively homogeneous sodium alginate layer to the well-structured calcium alginate gel can be highlighted by a comparison of the z-ranges of the two 3.6 μm×3.6 μm AFM scans. Whereas the difference between highest and lowest point in Fig. 4a is 4 nm, formation of alginate fibers and pores leads to an increase of the Δz value to 9 nm in Fig. 4b. The EPS matrix in Fig. 3d reveals a similar, network-like structure as the calcium alginate hydrogel, but is formed by different biopolymers, such as polysaccharides, proteins, and humic substances.
A companion paper describes the application of TERS to a model system of EPS polysaccharides consisting of alginates [22]. Alginates were chosen due to their similar-ities to EPS regarding physicochemical properties and nanoscale architecture as well as the importance of algi-nates as a chemical constituent of real biofilm matrices. A pure alginate sample does not reflect the chemical hetero-geneity of biofilms, but because this is the first application of our CLSM-AFM setup (this study) and TERS (see companion paper [22]) to the field of biofilms, a model system consisting of only one kind of polysaccharides makes the interpretation of TER spectra and the investiga-tion of specific spectroscopic properties of biopolymers much easier.
Conclusions
This study shows the great potential of combined CLSM-AFM imaging in the analysis of bacterial biofilms, which opens up new possibilities in this field of application. The CLSM used here can be employed for fluorescence imaging, which is one of the standard techniques in biofilm analysis [32], and can be coupled with the AFM for a more detailed imaging of selected parts of the sample. The AFM part of the setup allows imaging in different modes (contact
mode and tapping mode) and with different contrast mechanisms, such as topography and phase contrast. The nanometer-scale spatial resolution enables imaging of nanometer-sized extracellular structures, such as EPS, alginate bundles, flagella, and pili. The AFM images dramatically demonstrate the necessity of an additional chemical contrast. The identification of nanostructures, such as river-water colloids, is so far only speculative, by comparison of their shape and size with other AFM studies. Thus, chemical identification by means of a spectroscopic method with nanometer-scale spatial resolution could provide new insights into such highly inhomogeneous biological systems. The size of the nanostructures found in the AFM images ranged between 50 and 150 nm in width and between 1 and 10 nm in thickness (see Table1) and is therefore compatible with the spatial resolution of TERS, which is 20–50 nm laterally and 10–20 nm in depth as shown by other studies [42–46].
The investigation of alginate samples by AFM revealed the formation of fiber bundles and stable hydrogels by cross-linking of alginate strands by Ca2+ ions. Calcium alginate hydrogels show a very similar network-like struc-ture at the nanoscale as the EPS matrix of biofilms. Thus, besides similar macroscopic physicochemical properties as shown by other studies [23, 24, 28], alginates are also a good model system for the nanometer-scale architecture of the biofilm matrix. A companion paper demonstrates the capability of TERS for spectroscopic analysis of biopoly-mer nanostructures based on the investigation of an alginate model system [22].
Acknowledgements Financial support for our work from the Deutsche Forschungsgemeinschaft (to Thomas Schmid), the ETH Zürich, and the Gebert Rüf Stiftung (grant no. P-085/03) is greatly appreciated.
References
1. Costerton JW, Lewandowski Z, Caldwell DE, Korber DR, Lappinscott HM (1995) Annu Rev Microbiol 49:711–745 2. Sutherland IW (2001) Trends Microbiol 9:222–227
3. O’Flaherty V, Moran AP, Stoodley P, Mahony T, Lens P (2003) Biofilms in medicine, industry and environmental biotechnology -characteristics, analysis and control. IWA, London
4. Stoodley P, Sauer K, Davies DG, Costerton JW (2002) Annu Rev Microbiol 56:187–209
5. Watnick P, Kolter R (2000) J Bacteriol 182:2675–2679
6. Branda SS, Vik A, Friedman L, Kolter R (2005) Trends Microbiol 13:20–26
7. Sutherland IW (2001) Microbiol-UK 147:3–9 8. Flemming HC (2002) Appl Microbiol Biot 59:629–640
9. Bishop PL, Wilderer PA, Wuertz S (2003) Biofilms in wastewater treatment - an interdisciplinary approach. IWA, London
10. Costerton JW, Stewart PS, Greenberg EP (1999) Science 284: 1318–1322
11. Fux CA, Costerton JW, Stewart PS, Stoodley P (2005) Trends Microbiol 13:34–40
12. Neu TR, Lawrence JR (1997) FEMS Microbiol Ecol 24:11–25 13. Johnsen AR, Hausner M, Schnell A, Wuertz S (2000) Appl
Environ Microbiol 66:3487–3491
14. Zhang XQ, Bishop PL (2001) J Environ Eng-ASCE 127:850–856 15. Auerbach ID, Sorensen C, Hansma HG, Holden PA (2000) J
Bacteriol 182:3809–3815
16. Beech IB, Smith JR, Steele AA, Penegar I, Campbell SA (2002) Colloid Surf B-Biointerfaces 23:231–247
17. Pelling AE, Li YN, Shi WY, Gimzewski JK (2005) Proc Natl Acad Sci USA 102:6484–6489
18. Hansma PK, Walters DA, Hillner PE (1996) US Patent 5,581,082 19. Hillner PE, Walters DA, Lal R, Hansma HG, Hansma PK (1995)
Microsc Microanal 1:127–130
20. Lal R, Proksch R (1997) Int J Imaging Syst Technol 8:293–300 21. McNally HA, Rajwa B, Sturgis J, Robinson JP (2005) J Neurosci
Methods 142:177–184
22. Schmid T, Messmer A, Yeo BS, Zhang W, Zenobi R (2008) Anal Bioanal Chem, DOI10.1007/s00216-008-2101-1
23. Tielen P, Strathmann M, Jaeger KE, Flemming HC, Wingender J (2005) Microbiol Res 160:165–176
24. Wloka M, Rehage H, Flemming HC, Wingender J (2004) Colloid Polym Sci 282:1067–1076
25. Stöckle RM, Suh YD, Deckert V, Zenobi R (2000) Chem Phys Lett 318:131–136
26. Anderson MS (2000) Appl Phys Lett 76:3130–3132
27. Schmid T, Yeo BS, Zhang W, Zenobi R (2007) Use of tip-enhanced vibrational spectroscopy for analytical applications in chemistry, biology, and materials science. In: Kawata S, Shalaev V (eds) Tip Enhancement. Elsevier, Amsterdam
28. Strathmann M, Griebe T, Flemming HC (2000) Appl Microbiol Biot 54:231–237
29. Vannier C, Yeo BS, Melanson J, Zenobi R (2006) Rev Sci Instrum 77:023104
30. Schmid T, Panne U, Haisch C, Hausner M, Niessner R (2002) Environ Sci Technol 36:4135–4141
31. Schmid T, Panne U, Adams J, Niessner R (2004) Water Res 38:1189–1196
32. Wilderer PA, Bungartz HJ, Lemmer H, Wagner M, Keller J, Wuertz S (2002) Water Res 36:370–393
33. Schmid T, Schmitz TA, Setz PD, Yeo BS, Zhang W, Zenobi R (2006) Chimia 60:A783–A788
34. Telford JL, Barocchi MA, Margarit I, Rappuoli R, Grandi G (2006) Nat Rev Microbiol 4:509–519
35. Plaschke M, Romer J, Klenze R, Kim JI (1999) Colloid Surf A-Physicochem Eng Asp 160:269–279
36. Wilkinson KJ, Balnois E, Leppard GG, Buffle J (1999) Colloid Surf A-Physicochem Eng Asp 155:287–310
37. Chourpa I, Carpentier P, Maingault P, Dubois P (1999) Proc SPIE 3608:48–54
38. Chourpa I, Carpentier P, Maingault P, Fetissoff F, Dubois P (2000) Proc SPIE 3918:166–173
39. Evans LR, Linker A (1973) J Bacteriol 116:915–924 40. Rehm BHA, Valla S (1997) Appl Microbiol Biot 48:281–288 41. Flemming HC, Wingender J (2002) Chem unserer Zeit 36:30–42 42. Hayazawa N, Yano T, Watanabe H, Inouye Y, Kawata S (2003)
Chem Phys Lett 376:174–180
43. Hartschuh A, Anderson N, Novotny L (2003) J Microsc-Oxford 210:234–240
44. Pettinger B, Ren B, Picardi G, Schuster R, Ertl G (2005) J Raman Spectrosc 36:541–550
45. Mehtani D, Lee N, Hartschuh RD, Kisliuk A, Foster MD, Sokolov AP, Maguire JF (2005) J Raman Spectrosc 36:1068–1075 46. Hartschuh A, Sanchez EJ, Xie XS, Novotny L (2003) Phys Rev