Basic Res Cardio192: Suppl. 1, 111 - 119 9 SteinkopffVerlag 1997
A. G. Kleber V. Fast
Molecular and cellular aspects of re-entrant
arrhythmias
A b s t r a c t In recent years it has become evident that myocardial tissue undergoes remodeling in dis-
Prof. Dr. Andr6 G. Kleber (N~) Vladimir Fast
Department of Physiology University of Bern Btthlplatz 5
3012 Bern, Switzerland
eased states such as myocardial infarction and hypertrophy which affects membrane channels, cell-to- cell coupling as well as the connective tissue matrix. Although the detailed mechanisms of ventricular
arrhythmias in ventricular hyper- trophy are not known, studies carried out by computer simulations or high resolution mapping of electrical activ- ity have suggested a complex interac-
tion between changing ionic currents at the level of the cell membranes, altered cell-to-cell coupling and altered macroscopic structure. The present report summarises these recent developments and their poten- tial relevance for arrhythmogenesis. Key words Anisotropic conduction - cell cultures - microscopical con- duction - current-to-load mismatch
Introduction
Cardiac arrhythmias associated with a variety of patho- physiologic states are traditionally divided into distur- bances of impulse formation and impulse conduction. In normal cardiac function, impulse formation is confined to a limited number of pacemaker regions, the sino-artrial node, the atrio-ventricular junction and the His-Purkinje system. In pathological states, rapid impulse formation is either generated by circulating excitation with re-entry, which may involve relatively large regions of the atria and/ or the ventricles (macro-reentry) (1, 2) or by so-called focal activity. Repetitive rapid electrical activity emerging from a focus, i.e. a small circumscribed region of excitable tissue, can be caused by a variety of mechanisms: Auto- matic or triggered activity, brought about by electrically unstable cells which produce repetitive membrane oscilla- tions at different levels of membrane potential (early and delayed afterdepolarizations (e.g. (3, 4) or reentry con- fined to a small mass of tissue (5, 6). Such relatively small re-entrant circuits have been shown or postulated to underlie, for example, AV-nodal tachycardia (7) or ven- tricular premature beats (8).
Several investigators have emphasized the relationship between normal or remodeled cellular or tissue architec- ture and cardiac arrhythmias. Both remodeling at the level of membrane channels or connexons and remodel- ing at the level of connective tissue may increase the likelihood of occurrence of arrhythmias. The recent developments of sophisticated computer models (4, 9, 10) and of high-resolution mapping techniques of electrical activity (11, 12) have provided the tools which may help to understand the relation between the changes observed at the molecular and cellular level, the propagation distur- bances and the resulting arrhythmias. It this context, it is important to realize that cardiac arrhythmias, per defini- tion, always involve a complex system which is composed of a large mass of tissue in which different compartments (intracellular space, interstitial space, vascular space) interact. The present report summarizes recent develop- ments made in research on cardiac impulse propagation at a cellular level. Some of the findings are likely to stimulate further research in defined pathophysiological settings, such as chronic myocardial infarction and hypertrophy. However, it seems too early to provide conclusive evi- dence about the dominance of a certain arrhythmogenic
112 Basic Research in Cardiology, Vol. 92, Suppl. 1 (t997) 9 Steinkopff Verlag 1997
mechanism in cardiac hypertrophy and failure, although it is well known that this particular state of disease is associated with a high incidence of sudden cardiac death and that electrical disturbances and failure of mechanical function are closely interrelated.
Discontinuous conduction and arrhythmogenesis
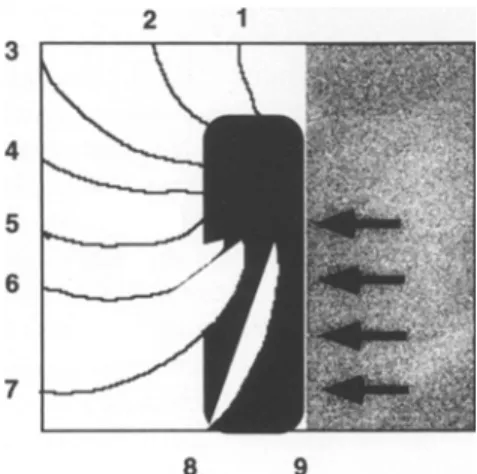
The basic mechanism for circus movement re-entry arrhythmias is illustrated schematically in Fig. 1. The effect of an obstacle present in a wavefront of propagation is to deviate the otherwise homogenous wavefront into a rotating vortex, which becomes self-sustaining if it encounters non-refractory tissue at a site which had b e e n
previously excited. The basic principle of such circus movement was already described early in this century (13), it was then modified to explain several types of cardiac arrhythmias. All these various types of circus movement have certain basic features in common: The wavefront must encounter a zone of tissue where local electrical inhomogeneity is present. This inhomogeneity may concern 1) the ionic properties of the cell membranes giving rise to different types of action potentials (in- homogeneity in electrical driving force), or requiring vari- ous amounts of local input current to generate a regenera-
tive response (inhomogeneity in electrical excitability), 2) local gradients in the resistive properties of the diffusive medium (cellular coupling, resistive properties of t h e
extracellular space), or 3) combinations of the above con- ditions. Also, such changes may be p e r m a n e n t (e.g., in remodeling after myocardial or ventricular hypertrophy (14), or they may be purely functional (e.g., in- homogeneity of refractoriness in acutely ischemic tissue (1). It is important to note that some of the above-men- tioned changes are only needed to set the initial condition for the deviation of the impulse, the so-called "unidirec- tional conduction block". Once the disturbance is initiated, an arrhythmia can take place in a perfectly homogenous electrical medium (15).
In discussing the mechanism responsible for initiation, it is therefore important to ask the question of whether some of the physiological properties of myocardial tissue may already represent an arrhythmogenic substrate, which will become manifest in the case some additional condition in a certain disease state is fulfilled, for instance a local decrease in the action potential amplitude or a change in action potential duration. The crucial impor- tance of myocardial architecture for the generation of arrhythmias was shown in several studies: Spach et al. (see e.g. 16) showed that in normal atrial tissue, a ven- tricular premature beat can be conducted in direction transversal to the main axis of the muscle fibers whereas it may get blocked in longitudinal direction. As a result, deviation of the impulse with re-entry occurred. Dillon et al. (17) showed that in tissue surviving from myocardial infarction, circus movement with re-entry occurred in strict topological relation to fiber architecture, the re- entrant circuits exhibiting an elliptic shape with a central zone of block corresponding to a zone separating lon- gitudinally oriented fiber bundles. De Bakker et al. (18, 19) demonstrated that apparently slow macroscopic con- duction in tissue surviving from infarction corresponded at a microscopical level to fast conduction taking a very long and complex "zig-zag"pathway across the scar tissue. This again confirmed a close relationship between tissue architecture and propagation.
Fig. 1 Schematic explanation of circus movement with re-entry in a quadrangular area of excitable tissue. The right (grey part) of the
tissue is excited homogenously from right to left. An obstacle (black area) leads to deviation of the wavefl'ont, which circulates around the obstacle. The unidirectional block is illustrated by the dark arrows. The relative instants of excitation are represented by the isochrone lines from 1~c9. At time 6 the excitation enters the previous zone of block from the rear and re-excites the originally excited area at time 9. The electrophysiological conditions for the occurrence of unidirec- tional block and for re-entry are multiple and listed in the text.
Discontinuities induced by individual cell borders
Cell cultures grown in a predetermined pattern offer the possibility to assess the effect of gap junctions on the inhomogeneity in conduction in dense cellular networks. In such dense cellular networks, propagation can be studied as a function of cell-to-cell coupling alone, i.e., without interference from larger resistive barriers formed by connective tissue sheets or blood vessels. A technique
A. G. Kleber and V. Fast 113 Molecular and cellular aspects of re-entrant arrhythmias
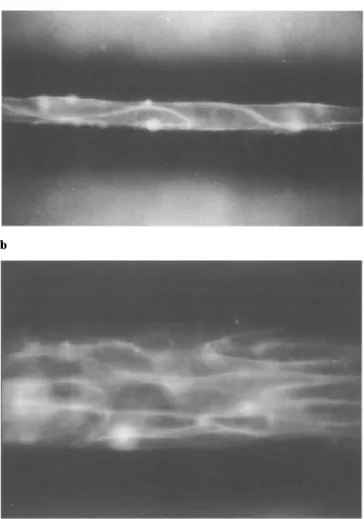
to produce such cultures from dissociated neonatal rat myocytes has recently been described by our laboratory (20). Figure 2 illustrates two different types of growth pat- terns, 1) a chain of single cells growing in series (Fig. 2A) and a "street" of cells, consisting of 5-6 cells in width (Fig. 2B). As shown in Figs. 3 and 4, the conduction pattern in these two structures is distinctly different, and the differ- ence allows to assess the role of gap junctions to induce discontinuities in conduction at a microscopical level. Since cells in single cell chains only exhibit end-to-end but no side-to-side connections, the conduction time along a cell chain is solely determined by action potential propa- gation within the cytoplasm and through the connexons located at the cell poles. The conduction patterns obtained in these strands are shown in Fig. 3B for a single
Fig. 2 Panel A: Fluorescent image of a one-dimensional synthetic strand of neonatal rat myocytes growing in a 2-/xm-wide channel. Cells are stained with the voltage-sensitive dye RH-237. Panel B: Fluorescent image of a two-dimensional synthetic strand of neonatal rat myocytes growing in a 80-/xm-wide channel. These channels con- tained four - six cells in cross-section. Reproduced from ref. (12) with permission.
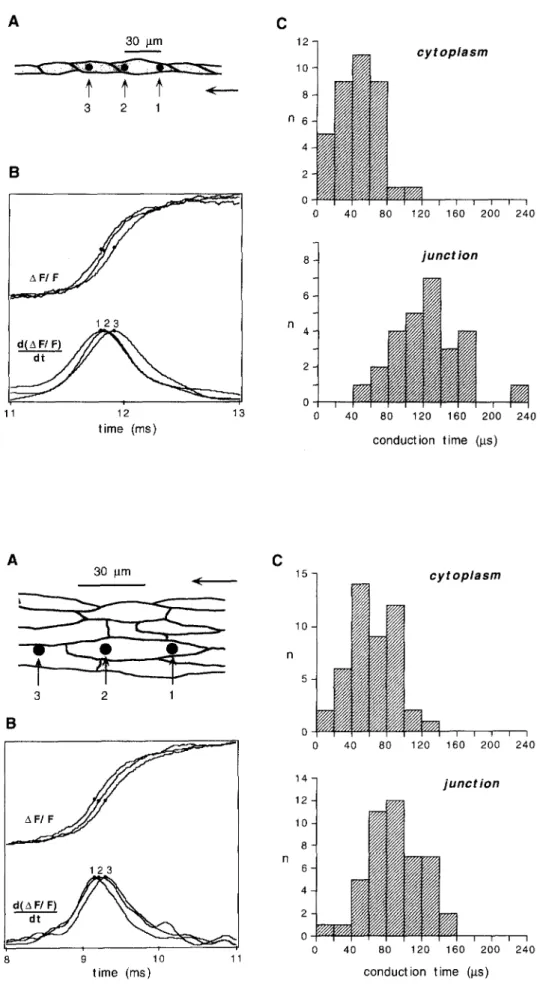
experiment (12). The conduction time along 30/xm within a single cell is relatively short whereas the conduction time along the same distance is significantly longer if an end-to-end cell connection is interposed. The difference between the two conduction times corresponds to t h e transfer time at the connexons between the two cells and amounts to 80/xs in this experiment. The average intracel- lular (cytoplasmic) conduction (Fig. 3C) along a distance of 30/xm is 38 + 25/xs (n = 37). The average conduction time from one cell to the follower cell amounts to 118 + 40/xs (n = 27), yielding a mean transfer time through an end-to-end cell connection of 80/xs. The analogous exper- iment carried out in a cell strand consisting in average of 5-6 cells in width, is illustrated in Fig. 4B, the collected data are shown in Fig. 4C. In the wider strands, the aver- age cytoplasmic conduction time is longer than in the single cell chains, and the average cell-to-cell conduction time is shorter, the mean transfer time across an end-to- end cell connection amounting to 3 2 / , s (versus 80/xs in the single cell chain). It is important to note that the macroscopic conduction velocities in both the single cell chains and the wide streets are the same. Comparison between the conduction times between these two struc- tures therefore demonstrates that the lateral apposition of single ceil chains to a cell strand decreases the degree of inhomogeneity induced by the end-to-end cell connec- tions. This so-called "averaging effect" can best be explained by looking at the magnitude and direction of electrotonic current flowing between neighboring cells at the instant a given site reaches threshold for rapid Na § inward current, as explained in Fig. 5. This figure is taken from a computer model simulating propagation in cellular networks, which has been adopted to the electrical parameters characterizing the cultured chains and streets (12). It depicts the currents flowing into or from a given measuring site: If the wavefront of propagation reaches, in a given cell, a point immediately beyond an end-to-end connection (point 1), the wavefront will lag slightly behind the front in the two neighboring cells, because these two cells do not encounter a resistive barrier at that site. Con- sequently, this point will receive local electrotonic current from both neighboring rows in addition to the normal electrotonic current flowing in the direction of the wave front. Sites immediately beyond an end-to-end connec- tion will therefore depolarize earlier in presence of lateral coupling and, consequently, the transition time across the longitudinal cell-to-cell connection will b e c o m e shorter and the cytoplasmic conduction time will b e c o m e longer. The opposite process takes place at the cell end (point 2), where local current from this site is fed to the two neigh- boring cells. This divergence of local electrotonic current results in shortening of the transition time across the lon- gitudinal cell-to-cell connection and prolongation of the
114 Basic Research in Cardiology, Vol. 92, Suppl. 1 (1997) 9 SteinkopffVerlag 1997
Fig. 3 Impulse propagation in one- dimensional cell chains. Panel A: Picture of a portion of a cell chain, reproduced from the bright-field illumination photograph. Position and size of membrane areas sensed by the three diodes are indicated by filled circles. Arrow indicates direc- tion of propagation. Panel B: Potential-dependent fluorescence change 2xF/F recorded by the diodes given on PanelA and their superim- posed derivatives d(AF/F)/dt. Acti- vation times are depicted by points. Cytoplasmic conduction time = 30 /xs, junctional conduction time = ll0/xs. Panel C: Histograms of con- duction times from all experiments. The average cytoplasmic conduc- tion time (t = 38 _+ 25/xs, n = 37) was markedly shorter than the aver- age junctional conduction time (t = 118 _+ 40/,s, n = 27, p < 0.0001). The mean difference, attributed to the conduction delay induced by the gap junctions, amounted to 80 /xs which is 51% of overall conduc- tion time. Reproduced from ref. 12 with permission. A 30 itm a 2 ] < B 1 2 3 11 12 13 time (ms) C 12 10 8 n 6 O" cytoplasm I I I f I I I I I I I 0 40 80 t20 160 200 240 junction f I l I I 1 I I I 40 80 120 160 200 c o n d u c t i o n time (its) 240
Fig. 4 Impulse conduction in two- dimensional cell strands. Panel A: Picture of a wide cell strand
(4-6
cells in width) reproduced from a bright-field illumination photo- graph. Position and size of mem- brane areas sensed by the three diodes are indicated by filled cir- cles. Arrow indicates direction of propagation. Panel B: Fluores- cence changes AF/F and their 9 superimposed derivatives d(AF/F)/dt recorded by diodes given on Panel A. Cytoplasmic conduction time = 60/zs, junctional conduction time = 80/zs. Panel C: Histograms of conduction times from all experi- ments. The average cytoplasmic conduction time was 57 _+ 26/zs (n = 46) and the junctional conduction time was 89 _+ 39/zs (n = 48, p < 0.001). The gap junctional conduc- tion delay amounted to 32/xs which is 22 % of overall conduction time. Reproduced from ref. (12) with permission. C A 30 itm i( 3 2 1 B 1 2 3 d(~ F/F) , ~ 8 9 10 11 time (ms) 15 10 n 5 I I I I 0 40 80 14 12 10 8 n 6 4 2 0 cytoplasm I I I I ! 120 160 200 junction I I I I I 1 I I I [ 0 40 80 120 160 200 conduction time (gs) I 240 I 240
A. G. Kleber and V. Fast 115 Molecular and cellular aspects of re-entrant arrhythmias
,e.
. . . * . . . j i . . . { . . .{
" ...
!
li. ....
. . . 9 . . . * i ' . . . 9 . . . E l E l I n propagationFig. 5 Schematic diagram showing local current flow in a cell of a two-dimensional strand coupled to six neighboring cells. Gap junc- tions are symbolized by filled oval dots. The electrotonic currents flowing in the wavefront of propagation (horizontal arrows) and between laterally apposed cells (vertical arrows) are depicted at the instants of local activation for a point distal to the end-to-end cell connection (open symbols) and a point proximal to the end-to-end connection (filled symbols). The direction of these currents is given by the computed potential distribution at the two instants of activa- tion. At the distal point lateral convergence of local current acceler- ates activation; at the proximal point lateral divergence delays activa- tion. Both divergence and convergence of local currents through lateral connections are responsible for the reduced inhomogeneity of propagation in two-dimensional strands. Reproduced from ref. (12) with permission.
cytoplasmic conduction time. As an overall result, con- duction b e c o m e s m o r e h o m o g e n o u s by lateral apposition and coupling of cells. B o t h the comparison of average con- duction times as well as the type of c o m p u t e r m o d e l cho- sen provide knowledge a b o u t the average b e h a v i o r of the cellular network. A variability of b o t h cytoplasmic and cell-to-cell conduction times is suggested f r o m the histo- grams in Figs. 3 and 4, and expected f r o m the variability in cell shape, the variability in lateral apposition of individual cells, as well as f r o m the variability in connexin distribu- tion. This variability has b e e n simulated recently in a com- puter model taking into account the stochastic architec- ture of adult myocytes (9).
Most experiments p e r f o r m e d in isolated ventricular and atrial tissue have shown that the maximal upstroke velocity of the t r a n s m e m b r a n e action potential, dV/dtmax, is higher during transverse than during longitudinal prop- agation (21-24). This difference was t a k e n to indicate a different m e c h a n i s m for p r o p a g a t i o n in longitudinal versus transverse direction and related to the intrinsic arrhythmogenic substrate of anisotropic tissue. W h e t h e r or not this difference is explained by the specific arrange- m e n t of the gap junctions in the p a r t of the tissue which consists of densely coupled cells or by the presence of con- nective tissue sheets and b l o o d vessels separating fiber bundles cannot be answered f r o m experiments in isolated
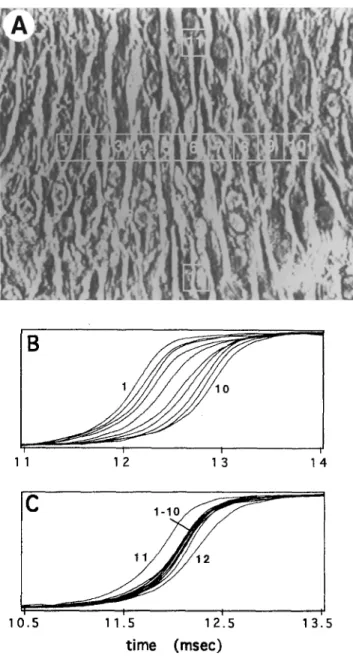
tissue because of methodological limitations. A n experi- m e n t showing anisotropic conduction in a dense n e t w o r k of cultured cells, (devoid of large extracellular clefts) is illustrated in Fig. 6 (25). Such type of experiments have
I i
1 1 2 1 3 1 4
I I
1 0 . 5 1 1 . 5 1 2 . 5 1 3 . 5
time (msec)
Fig. 6 Activation sequences of transverse and longitudinal conduc- tion. Panel A: Phase-contrast image of the cell culture and photo- diodes. Numbers within rectangles indicate photodiode numbers.
Panel B: Normalized optical upstrokes recorded by the photodiodes
shown on Panel A during transverse conduction. Panel C: Nor- malized optical upstrokes recorded from the same localization dur- ing logitudinal conduction. Both action potential upstrokes during longitudinal and transverse conduction show a variability in the maximal upstroke velocity indicating local variability in current flow- ing into membrane capacitance. However, no significant difference between mean values in tranverse versus longitudinal direction can be detected. Reproduced from ref. (25) with permission.
116 Basic Research in Cardiology, VoI. 92, Suppl. 1 (1997) 9 SteinkopffVerlag 1997
shown that, in contrast to the in vivo experiments, average A dV/dtma x in transverse and longitudinal directions are not different. Although the interpretation of such results is not unequivocal, they indicate that at a moderate degree of anisotropy (e.g. ventricular tissue) the discrete arrange- ment of gap junctions at the cell borders is not directly responsible for the direction-dependent differences in dV/dtma x. Similar findings have been recently obtained in computer simulations (26). They indirectly attribute a cru- cial importance to the resistive barriers larger than the gap junctions for explaining direction-dependent differences B in dV/dtma x and arrhythmogenicity. Modification of gap junctional coupling will nevertheless modulate the effects of large resistive barriers, as discussed below.
Discontinuities induced by macroscopic changes
in tissue geometry
Discontinuities in myocardial architecture exist at several levels. In addition to discontinuities imposed by cell bor- ders (as described in the paragraph above), connective tis- sue sheets and microvessels may act as resistive barriers (27). A propagating impulse is expected to 1) collide with such a barrier and 2) to travel around resistive barriers wherever it encounters excitable tissue, T h e sites, where these deviations from homogenous and linear spread occur, are known to be susceptible for conduction block, because of so-called "impedance-to-load mismatch".
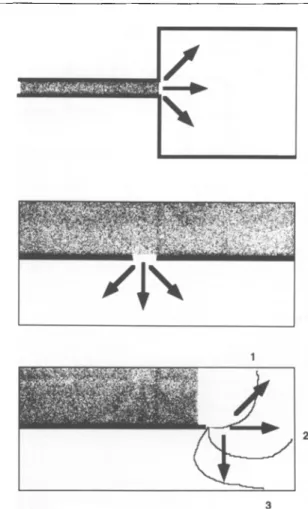
A basic model to investigate the effect of impedance- to-load mismatch and obtained by using the technique of patterned growth of cultured cells (described above) is shown in Fig. 7A (28). In this model, the impulse traveling along the small "street" has to excite the large tissue mass beyond the expansion, and therefore, to furnish local excitatory current to a large surface of excitable mem- branes downstream. As a consequence local slowing of conduction is to be expected, and eventually, conduction block occurs if the width of the street reaches a critical diameter, h c. Although, at first glance, this simple macros- copical geometry bears no resemblance to the longitudi- nally oriented resistive barriers encountered in intact tis- sue, the biophysical principle governing impulse transmis- sion at such sites is very similar. Thus, current-to-load mis- match has been described at a single ended obstacle or so- called pivoting point (Fig. 7B) forcing the wavefront to a curved shape or at a narrow "isthmus" or "gate" of excita- ble tissue interposed between connective tissue sheets (Fig. 7C) (29). An experiment measuring impulse trans- mission at a tissue expansion is shown in Fig. 8. This figure depicts optically measured action potential upstrokes dur- ing conduction from a small street across the expansion
C
Fig. 7 Different types of "current-to-load mismatch" in cardiac tissue. In each scheme, the excited area is symbolized by the dark shading. The black lines indicate the tissue boundaries or the resistive obstacles, the arrows symbolize divergence of the electrotonic cur- rent which is produced by the ionic membrane channels in the excited area upstream. A) Abrupt tissue expansion, as discussed in Figs. 8-10. B) Connective tissue sheet separating two excitable areas with gate or isthmis. C) Connective tissue sheet, producing partial separation of two excitable areas, with excitation turning around the end of tt~e obstacle ("pivoting point"). Curved isochrones at relative times 1 to 3 illustrate circus movement.
into a large excitable area. Typically, the action potentials exhibit a biphasic upstroke which is due to the impedance mismatch at the geometrical transition. Conduction vel- ocity at such expansions gets smaller with decreasing street width until it occasionally blocks if the streets are only 1-2 cells in width. Due to the asymmetry of the tis- sue, conduction in the inverse direction accelerates with decreasing street width.
The question relevant to anisotropic conduction is whether such resistive obstacles take part in impulse deviation and discontinuous conduction in vivo, and whether they contribute to anisotropy, i.e. whether their effects depend on the direction of the wavefront spread.
A. G. Kleber and V. Fast 117 Molecular and cellular aspects of re-entrant arrhythmias
A n i m p o r t a n t role for connective tissue sheets separating bundles of excitable myocytes, which are longitudinally oriented and thus anisotropic, has b e e n given by Spach et al., see (16) who observed b o t h discontinuities in action
7 8 9 10 11 12 time (msec) E 2.0' 1.6 m 1.2 E m 0.8" E 0.4" O' Fig. 8
I
C 8 9 10 11 time (msec)/ /
7
2 3 4 5 6 7 8 9 10 diode numberAnterograde and retrograde impulse conduction at the reg- ion of abrupt expansion in a cell culture. Bottom right. Schematic presentation of an abrupt tissue expansion. The width of the small celI strand emerging into the large area (corresponding to the geometry shown in Fig. 7 A) amounts to 22/xm. The grid shows the localization of photodiodes with nmnbers. An individual diode covers a cell membrane area of 14 • 14 txm 2. The spacing between borders of individual diodes is 1 txm. Panels A and C: Normalized optical upstrokes (AF,) of transmembrane action potentials recorded during anterograde conduction (A) from the strand into the large area and during retrograde conduction (C). Numbers on traces indicate corresponding photodiode numbers. Time was mea- sured from the beginning of the recording interval. Stimulation pulse was delivered at t = 5 ms. Panel B and D: Normalized first time derivatives of corresponding optical signals, dF/dtn. Two rising phases can be seen on optical upstrokes AFn corresponding to the two maxima on derivative traces dF/dt,. Panel E: Time sequences of dF/dtma x (quadrangles) and 1=50 % (circles) calculated from the record- ings on Panels A and B. Data are plotted relative to the moment of dF/dtmax at the site number I0 which was considered to be zero. Note that the geometrical expansion induces a conduction delay during anterograde spread (PanelA) while propagation is fast during spread from the large area into the strand (Panel C). Reproduced from ref. (28) with permission.
potential upstrokes and extracellular electrograms during transverse but not during longitudinal direction in such tissue. Especially, it was emphasized that such structural remodeling appears in h u m a n hearts with age (30). C o m - paring discontinuities at a relatively large level (obstacles introduced by connective tissue separating whole cell bun- dles or carrying blood vessels) with the discontinuities due to the discrete gap junction distribution, o n e might argue that the larger the discontinuity the larger the susceptibil- ity of occurrence of conduction block in a stage of depres- sed excitability. However, the situation is likely to be far m o r e complex because of interaction b e t w e e n the macros- copic tissue geometry, gap junctional coupling and activa- tion of ionic m e m b r a n e currents.
Interaction between macroscopic and cellular alterations
E x p e r i m e n t a l data and c o m p u t e r simulations suggest mutual and complex interactions b e t w e e n the discon- tinuities at smaller (cellular) and larger (connective tis- sue, vasculature) scales. An e x a m p l e of the effect of an abrupt tissue expansion on the activation of m e m b r a n e currents is shown in Fig. 9. This figure depicts the simu- lated time-course of the fast Na + inward current, INa § at consecutive locations along an abrupt tissue expansion (28). As can be seen, there is a significant increase of INa + at the sites where the conduction delay is maximal. T h e increase in depolarizing current contributes to mainte- nance of conduction at the expansion and to prevention of conduction block. It is explained by the slower rate of depolarization at the expansion with respect to steady- state conduction which allows the Na + channels enough time to fully activate. Inversely, partial inhibition of the fast Na § inward current (e.g., by pharmacological blockade) is expected to increase the probability for the occurrence of conduction block at a tissue expansion. T h e r e f o r e not only p r i m a r y changes in ionic current flow at the level of the cell m e m b r a n e s will determine conduc- tion or block at a site of a change in macroscopical tissue architecture, but the macroscopical tissue architecture itself will have a f e e d b a c k interaction on the activation of ionic m e m b r a n e channels.
In addition to interaction b e t w e e n macroscopical tis- sue architecture and activation of ionic m e m b r a n e chan- nels, similar interactions can be postulated with gap junc- tional coupling. In Fig. 10, a simulated geometrical expan- sion contains a network of excitable elements in which b o t h the resistive interconnections and the m e m b r a n e ionic currents can be modified. These modifications do affect the minimal width of the street, he, at which conduc- tion block occurs. If the values of the resistors b e t w e e n
118 Basic Research in Cardiology, Vol. 92, Suppl. 1 (1997) 9 SteinkopffVerlag 1997
A
)~ F - - - I
V- ! . . . 6 . . . . ~'~iL
B
C D/
-ooo 1
time (msec) time (msec) Fig. 9 Computer simulation of impulse conduction in a structure with abrupt expansion. Transmembrane action potentials V (Panel A), first time derivative of action potential dV/dt (Panel B), sodium conductance gNu (Panel C), and sodium current iNa (Panel D) calcu- lated during impulse propagation from a narrow strand into a large area are shown. Time was measured from the onset of stimulus. The geometrical structure is indicated on the inset of Panel A (analogue geometry to Figs. 7A and 8). The 11 recording points were 30/xm apart. The arrow indicates the direction of propagation. The strand width was 120/xm. The strand length was 3 mm (only a short strand portion is shown). The length and the width of the large area were 3 mm and 2 mm correspondingly. Note that there is an increase in the maximum sodium current at the tissue expansion, demonstrating a feedback effect of tissue geometry on activation of local ionic cur- rents. Reproduced from ref. (28) with permission.
the excitable elements (simulating a decrease in cell-to- cell coupling) are increased (within a certain range) the minimal width h~ decrease, i.e. propagation across the site of impedance-to-load mismatch gets safer and the proba-
bility for occurrence of conduction block lower (31). The safer propagation is explained by the higher resistances decreasing the amount of electrotonic current loss down- stream of the abrupt geometrical tissue transition. It con- trasts to steady-state propagation in tissue without a change in geometry where a decrease in cell-to-cell coupl- ing is always associated with a decrease in velocity.
1,
~,~,~
~ 1
03
0, c- O, 0,o
sbo
doo
s'oo
R
(rlcm)
2doo
Fig, l0 Dependence of critical strand width, he, on intracellular resistivity R. Inset: Schematic illustration of an abrupt tissue expan- sion. A small strand of width h emerges into a large area. If h decreases unidirectional conduction block occurs at the critical width h c. Graph: The critical width, he, is plotted as a function of the intra- cellular resistivity R given in ~ c m for a two-dimensional expansion (D2) and a three-dimensional expansion (D3). This simulation demonstrates that an event at a molecular level (cellular uncoupling) can modulate the effect of macroscopical tissue geometry to produce conduction block at the critical width hc. Reproduced from ref. (31) with permission.
References
1. Janse M, W i t A (1989) Electrophysiolog- ical mechanisms of ventricular arrrhyth- mias resulting from ischemia and infarc- tion. Physiological Reviews 69: 1049- 1169
2. Allessie MA, Bonke FIM, Schopman FJC (1977) Circus movement in rabbit atrial muscle as a mechanism of tachycardia. ItI. The "leading circle" concept: a new model of circus move- ment in cardiac tissue without the involvement of an anatomical obstacle. Circ Res 41:9-18
3. January CT, Riddle JM (1989) Early afterdepolarizations: mechanism of in- duction and block. A role for L-type Ca2+ current. Circ Res 64:977-990
4. Luo CH, Rudy Y (1994) A dynamic
model of the cardiac ventricular action potential. II. afterdepolarizations, trig- gered activity, and potentiation. Circ Res 74:1097-1113
5. Jalife J, Moe GK (1981) Excitation, con- duction, and reflection of impulses in isolated bovine and canine cardiac Pur- kinje fibers. Circ Res 49:233-247
6. Wit AL, Cranefield PE Hoffman BF (1972) Slow conduction and reentry in the ventricular conducting system. II. Single and sustained circus movement in networks of canine and bovine Purkinje fibers. Circ Res 30:11-22
7. Janse M J, Van Capelle FJL, Freud GE, Durrer D (1971) Circus movement within the AV node as a basis for supra- ventricular tachycardia as shown by multiple microelectrode recording in the isolated rabbit heart. Circ Res 28: 403- 414
A. G. Kleber and V. Fast 119 Molecular and cellular aspects of re-entrant arrhythmias
8. Antzelevitch C, Bernstein MJ, Feldman HN, Moe GK (1983) Parsystole, reen- try, and tachycardia: a canine prepara- tion of cardiac arrhythmias occurring across inexcitable segments of tissue. Circulation 68:1101-1115
9. Spach MS, Heidlage JF (1995) The stochastic nature of cardiac propagation at a microscopic level-electrical descrip- tion of myocardial architecture and its application to conduction. Circ Res 76: 366-380
10. Leon LJ, RobergeFA(1991) Directional characteristics of action potential propa- gation in cardiac muscle. A model study. Circ Res 69:378-395
11. Rohr S, Salzberg BM (1994) Multiple site optical recording of transmembrane voltage (MSORTV) in patterned growth heart cell cultures: assessing electrical behavior, with microsecond resolution, on a cellular and subcellular scale. Biophys J 67:1301-1315
12. FastVG, KleberAG (1993) Microscopic conduction in cultured strands of neonatal rat heart cells measured with voltage-sensitive dyes. Circ Res 73: 914- 925
13. Mines G (1913) On the dynamic equilib- rium of the heart. J Physiol (London) 46:349-383
14. Boyden R Jeck C (1995)Ion channel function in disease. Cardiovasc Res 29: 312-318
15. Fast VG, Pertsov AM (1990) Drift of a vortex in the myocardium. Biophysics 35:489-494
16. Spach MS, Josephson ME (1994) Initiat- ing reentry: The role of nonuniform anisotropy in small circuits. J Cardio- vasc Electrophysiol 5:182-209 17. Dillon SM, Allessie MA, Ursell PC, Wit
AL (1988) Influences of anisotropic tis- sue structure on reentrant circuits in the epicardial border zone of subacute canine infarcts. Circ Res 63:182-206 18. De Bakker JMT, Van Capelle FJL,
Janse MJ, Tasseron S, Vermeulen JT, Dejonge N, Lahpor JR (1993) Slow con- duction in the infarcted human heart - zigzag course of activation. Circulation 88:915-926
19. De Bakker JMT, Van Capelle FJL, Janse MJ, Vanhemel NM, Hauer RNW, Defauw J JAM, Vermeulen FEE, Dewekker PFAB (1991) Macroreentry in the infarcted human heart - the mechanism of ventricular tachycardias with a focal activation pattern. J Ain Coll Cardiol 18:1005-1014
20. Rohr S, Sch611y DM, Kleber AG (1991) Patterned growth of neonatal rat heart cells in culture. Morphological and elec- trophysiological characterization. Circ Res 68:114-130
21. Delmar M, Michaels DC, Johnson T, Jalife J (1987) Effects of increasing inter- cellular resistance on transverse and lon- gitudinal propagation in sheep epicar- dial muscle. Circ Res 60:780-785 22. Kadish AH, Spear JF, Levine JH, Moore
EN (1986) The effects of procainamide on conduction in anisotropic canine ventricular myocardium. Circulation 74: 616-625
23. Tsuboi N, Kodama I, Tayama J, Yamada K (1985) Anisotropic conduction prop- erties of canine ventricular muscles. Jpn Circ J 49:487-498
24. SpachMS, MillerWTI, GezelowitzDB, Barr RC, Kootsey JM, Johnson EA (1981) The discontinuous nature of prop- agation in normal canine cardiac muscle. Evidence for recurrent discontinuities of intracellular resistance that affect the membrane currents. Circ Res 48:39-54
25. Fast VG, Kleber AG (1994) Anisotropic conduction in monolayers of neonatal rat heart cells cultured on collagen sub- strate. Circ Res 75:591-595
26. FastVG, KleberAG (1994) Conduction velocity and shape of action potential upstroke in a computer model of an anisotropic heart cell monolayer. Circu- lation 90:1-40
27. Sommer JR, Scherer B (1985) Geometry of cell and bundle appositions in cardiac muscle: light microscopy. Am J Physiol 248:H792-H803
28. Fast VG, Kleber AG (1995) Cardiac tissue geometry as a determinant of uni- directional conduction block: assess- ment of microscopic excitation spread by optical mapping in patterned cell cul- tures and in a computer model. Cardio- vasc Res 29:697-707
29. Cabo C, Pertsov AM, Baxter WT, Davidenko JM, Gray RA, Jalife J (1994) Wave-front curvature as a cause of slow conduction and block in isolated cardiac muscle. Circ Res 75:1014-1028 30. Spach MS, Dolber PC (1986) Relating
extracellular potentials and their deriva- tives to anisotropic propagation at a microscopic level in human cardiac mus- cle. Evidence for electrical uncoupling of side-to-side fiber connections with increasing age. Circ Res 58:356-371 31. Fast VG, Kleber AG (1995) Block of
impulse propagation at an abrupt tissue expansion: evaluation of the critical strand diameter in 2- and 3-dimensional computer models. Cardiovasc Res 30: 449-459