multi-country model. Evaluating the Irish experience against patterns derived from a wider set of industrial countries may allow us to obtain general insights into the dynamics of the European sovereign debt crisis.
The backdrop for our analysis is a recently advanced empiri-cal model of the market for government bonds.2 The current
paper narrates Ireland’s odyssey from the beginnings of the fi nancial crisis to its sovereign debt crisis through the eyes of this quantitative model.
The empirical background
In essence, Gärtner and Griesbach3 attempt to quantify the
model of the market for government bonds proposed by Romer.4 This simple two-equation model derives from
ide-as put forward by Calvo.5 It focusses on the interaction
be-tween the default risk and the interest rate and models this by means of two equations:
• When default risk increases, the market requests a higher risk premium, and the interest rate goes up;
• When the interest rate goes up, default risk increases.
Non-linearities in these equations may generate multiple equilibria in the market for government bonds. Equilibria are
2 M. G ä r t n e r, B. G r i e s b a c h : Rating agencies, self-fulfi lling prophe-cy and multiple equilibria? An empirical model of the European sover-eign debt crisis 2009-2011, University of St. Gallen, SEPS, Discussion Paper No. 2012-15.
3 Ibid.
4 D. R o m e r : Advanced Macroeconomics, 4th edition, McGraw-Hill Ir-win, New York 2012, pp. 632-639.
5 See G.A. C a l v o : Servicing the public debt: The role of expectations, in: American Economic Review, Vol. 78, No. 4, 1988, pp. 647-661; and D. R o m e r, op. cit.
In an extraordinary turn of events, the euro area’s fastest-growing and second-richest country in terms of per capita income became the fi rst to petition the European Union for a bailout on 21 November 2010. An international fi nancial res-cue package of €90bn, almost 60 per cent of Ireland’s 2010 GDP, was handed over by the troika of the European Com-mission, the European Central Bank and the International Monetary Fund in the form of a three-year loan. This fi nalised the transformation of the global fi nancial crisis into a sover-eign debt crisis, putting public fi nances and the market for government debt centre stage and presenting governments as the new villains. At the same time, it permitted the fi nancial industry to drift out of the limelight.
A number of contributions discuss this transformation in general and Ireland’s own recent economic and political or-deal in particular.1 This paper attempts to add to and
com-plement this debate from the perspective of an econometric
1 Informative examples are S. D e l l e p i a n e , N. H a r d i m a n : Govern-ing the Irish Economy: A Triple Crisis, in: N. H a r d i m a n (ed.): Irish Governance in crisis, Manchester 2012, Manchester University Press, pp. 83-109; N. H a r d i m a n , A. R e g a n : The politics of austerity in Ire-land, in: Intereconomics, Vol. 48, No. 1, 2013, pp. 9-14; K. W h e l a n : Ireland’s Sovereign Debt Crisis, University College Dublin, UCD Cen-tre for Economic Research Working Paper Series, WP11/09, May 2011.
Manfred Gärtner, Björn Griesbach and Giulia Mennillo
The Near-Death Experience of the Celtic Tiger
A Model-Driven Narrative from the European Sovereign Debt Crisis
This article narrates Ireland’s recent odyssey from the pride and envy of Europe to kneeling
supplicant through the eyes of an econometric model of the government bond market. The
exercise suggests that, in essence, two developments triggered and propelled Ireland’s drift
towards sovereign default: fi rst, the global fi nancial crisis that drove Ireland into a severe
recession with collapsing tax revenues and increasing unemployment; second, a gap between
the post-2007 increase in sovereign default risk that can actually be linked to macroeconomic
fundamentals and the much bigger increase in perceived risk refl ected by high interest rates
and communicated by the massive downgrades of Ireland’s sovereign debt rating.
Manfred Gärtner, University of St. Gallen,
Switzer-land.
Björn Griesbach, University of St. Gallen,
Switzer-land.
Giulia Mennillo, University of St. Gallen,
of self-fulfi lling prophecy in which downgrades and interest rate hikes chase and reinforce each other. At the end of this process, default looms. This is the third, “bad” equilibrium in this scenario.
The situation of individual countries is likely to differ from this synthetic constellation based on sample means, because country-specifi c fundamentals must be used for position-ing the ratposition-ing curve. Dependposition-ing on the relative position of the two curves, multiple equilibria may, but do not have to, arise. If the rating curve is located high (low) enough relative to the interest rate curve, only the good (bad) equilibrium may exist and be globally stable.
In this graphical display of the market for government bonds, the debt rating may change for two reasons. First, it may change because fundamentals change. This shifts the rat-ing curve and changes the ratrat-ing accordrat-ingly at any given interest rate. We may call this the “impact effect”. Second, because the interest rate changes, this causes the country to slide up or down a given rating curve.
This second effect, the “interest rate effect”, should be kept apart from the impact effect, because the interest rate is an endogenous variable that itself responds to downgrades and also because the effect is likely to take time. Increases in the interest rate affect the government’s budget only when bonds expire and/or new ones have to be issued that carry higher interest rates. The speed at which this happens de-pends on such things as the maturity structure of a coun-try’s debt, the way in which expectations are formed, or the presence of such phenomena as bandwagon effects or herd behaviour. In Gärtner and Griesbach’s recursive model, this affected by fundamentals that include government defi cits
and debt, income growth and the interest rate on risk-free assets. They may be stable or unstable. Unstable equilibria constitute thresholds beyond which a self-enforcing process of increasing default risk and rising interest rates may loom.
Gärtner and Griesbach6 modify the model with the following
assumptions:
• The market uses sovereign debt ratings as a measure of default risk;
• Changes in the interest rate may affect default risk with a lag due to the long maturity of government debt titles.
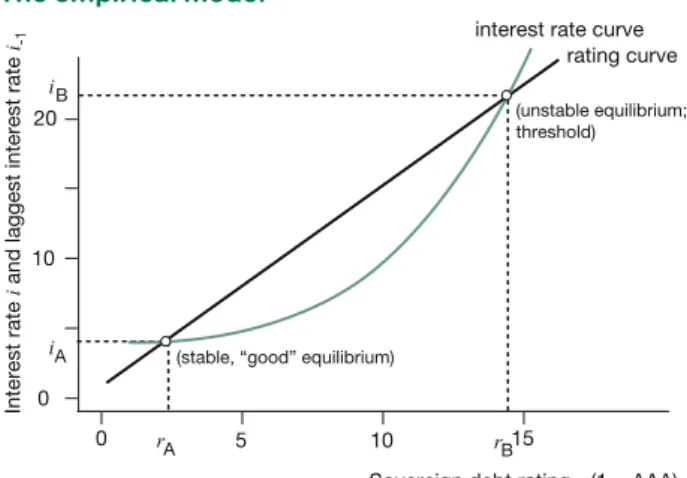
Figure 1 displays estimates of the interest rate curve and the rating curve that result from panel regressions using annual data from 25 OECD countries for the period 1999-2011.7 The
rating curve shows how, for a given set of fundamentals, interest rates affect ratings. The curve is linear in the seg-ment covered by the data. The underlying equation explains some 60 per cent of the variations of ratings across time and among countries. Signifi cant fundamentals that would shift the curve to the right if they deteriorate are mainly the defi cit and primary defi cit ratios and the public debt ratio, but also income levels and growth.
The interest rate curve is nonlinear, implying that successive downgrades have increasingly strong effects on the interest rate. The curve shifts up and down with the German interest rate, which serves as a proxy for the risk-free rate. The rat-ings raised to the third power explain 80 per cent of the vari-ations in interest rates across countries and time. The curves are positioned using the sample means of fundamentals for the countries in the panel for the period under consideration. This constellation generates three equilibria. Two of them co-incide with points of intersection of the two curves.
Point A is a “good” equilibrium with low interest rates and good ratings. It is locally stable because if a rating, for ex-ample, was erroneously set too high, this would drive up the interest rate, but not as much as actually required to justify the rating. Thus, the rating would eventually return to its (cor-rect) initial value. Point B is an unstable equilibrium. Once the rating moves beyond the level associated with this point, it generates an increase in the interest rate that is so large that it requires further downgrades. We therefore enter a region
6 M. G ä r t n e r, B. G r i e s b a c h , op. cit.
7 The sample includes Australia, Austria, Belgium, Canada, the Czech Republic, Denmark, Finland, France, Germany, Greece, Hungary, Ire-land, Italy, Japan, the Netherlands, New ZeaIre-land, Norway, PoIre-land, Portugal, South Korea, Spain, Sweden, Switzerland, the United King-dom and the United States. The depicted equations are equation (1), table 2 and equation (4), table 3.
Figure 1
The empirical model
S o u r c e : M. G ä r t n e r, B. G r i e s b a c h : Rating agencies, self-fulfi lling prophecy and multiple equilibria? An empirical model of the European sovereign debt crisis 2009-2011, University of St. Gallen, SEPS, Discus-sion Paper No. 2012-15, Figure 5(b).
Interest rate
i and laggest interest rate
i-1
Sovereign debt rating r (1 = AAA)
20
10
0
0 5 10 15
interest rate curve rating curve
(unstable equilibrium; threshold)
(stable, “good” equilibrium)
i
iA
B
r B
the euro, which Ireland had adopted as one of the fi rst-wave countries.
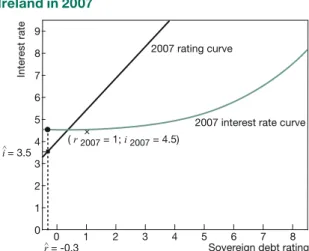
By placing Ireland into the context of the empirical model of the market for sovereign bonds, Figure 2 shows four things:
• Ireland’s current interest rate and rating curves. These use the coeffi cients reported by Gärtner and Griesbach,13
de-rived from data for 25 OECD countries over the time pe-riod 1999-2011, and are positioned by inserting Ireland’s own fundamentals for the year 2007.
• Ireland’s 2007 interest rate and rating according to the model (indicated by the black dot). The rating is obtained by extending a horizontal line from the 2006 interest rate, which stood at 3.5 per cent, from the ordinate to the right and fi nding its intersection with the rating curve. The 2007 interest rate is obtained by extending a vertical line from the identifi ed 2007 credit rating upwards to the interest rate curve.
• Ireland’s long-run equilibrium implied by the 2007 funda-mentals. This is determined by the intersection of these two curves. This point indicates the levels towards which, as long as the fundamentals remain unchanged, the gov-ernment bond yields and sovereign debt ratings should eventually converge in order to fi t the experience of all the countries and years in the sample.
• Ireland’s actual government bond yields and sovereign debt ratings in 2007, indicated by an “x”.
13 M. G ä r t n e r, B. G r i e s b a c h , op. cit.
lagged response is captured parsimoniously by making rat-ings dependent on the previous year’s interest rate.8 This
ef-fect via the interest rate can occur if at least one of the two conditions holds: either we are not operating on the horizon-tal segment of the interest curve or the risk-free rate, which positions the interest curve, changes.
In the next section, the discussion of Ireland’s experience focusses on fundamentals and the impact effect that these have on ratings and interest rates. The section on caveats below shows that this is justifi ed since the results do not dif-fer to any relevant extent from the ratings we obtain by in-cluding the interest rate effect or even from looking at the full equilibrium effects.
The Irish odyssey
We now turn to Ireland’s development from its pre-crisis comfort zone to the scary days of near bankruptcy, rising unemployment, falling living standards, and an exodus of capital and young minds.9 The empirical model and graph
described in the previous section serve as an organising de-vice, and the focus is on the variables that drive this model. As in Gärtner and Griesbach,10 the ratings used are Fitch’s
ratings mapped onto a numerical scale that increases from 1=AAA to 21=D.
2007: “AAA+” with a positive outlook
After two decades of reforms and relentless stabilisation ef-forts, Ireland had managed to reduce its public debt from 110 per cent of GDP in 1987 to 25 per cent in 2007, the lowest in the euro area, bar Luxembourg and Slovenia.11 Per capita
in-come was among the highest in Europe at €43,500, as were income growth rates, which averaged 5.6 per cent between 2000 and 2007. The government budget, which had never vi-olated the Maastricht defi cit ratio threshold of three per cent, was marginally positive at 0.1 per cent of GDP.12 The interest
rate on Irish government bonds stood at a comfortable level of 4.5 per cent, and the country continued to enjoy a AAA rat-ing from all three major ratrat-ing agencies – from Fitch Ratrat-ings and Moody’s since 1998 and from Standard & Poor’s since 2002, the year that saw the completion of the introduction of
8 Ibid.
9 See Bloomberg: Capital Flight Leaves Banks in Germany Awash in Deposits, 8 June 2012, available at http://www.bloomberg.com/ news/2012-06-07/capital-fl ight-leaves-banks-in-germany-awash-in-cheap-deposits.html. Already in 2009, capital fl ight reached about €120bn according to R. N e u b ä u m e r : Eurokrise: Keine Staats-schuldenkrise, sondern Folge der Finanzkrise, in: Wirtschaftsdienst, Vol. 91, No. 12, 2011, p. 830. In terms of emigration, see N. H a r d i -m a n , A. R e g a n : The politics of austerity in Ireland, op. cit., p. 12. 10 M. G ä r t n e r, B. G r i e s b a c h , op. cit.
11 Source: World Economic Outlook Database, April 2012.
12 The main source for the data reported and discussed in this paper is the OECD Economic Outlook No 90 database.
Figure 2
Ireland in 2007
S o u r c e : Authors’ calculations based on estimates in M. G ä r t n e r, B. G r i e s b a c h : Rating agencies, self-fulfi lling prophecy and multiple equi-libria? An empirical model of the European sovereign debt crisis 2009-2011, University of St. Gallen, SEPS, Discussion Paper No. 2012-15, Fig-ure 5(b). Interest rate r = -0.3 ^ i= 3.5 ^ × ( r 2007 = 1; i 2007 = 4.5) 2007 rating curve
2007 interest rate curve 9 8 7 6 5 4 3 2 1 0 0 1 2 3 4 5 6 7 8
could be attributed to the erosion of government fi nances. Half of this, in turn, was caused by an increase in the primary defi cit ratio, which rose to six per cent. The other half was due to the debt ratio leaping from 28.75 per cent to 49.6 per cent. No other included fundamental variable had an impact that contributed to more than ten per cent of the required downgrade.
Two factors drove the government budget deep into the red. The fi rst and major one is the collapse of tax revenues. As in many other countries, the negative real effects of the fi nan-cial crisis on economic activity resulted in a substantial loss in tax revenues and an increase in social welfare spending. The effects on taxes were aggravated by the fact that a re-design of the tax system during the boom years had reduced the share of income-based tax revenues and increased the share of asset-based tax revenues. Since the latter are not levied on property or wealth but paid as a stamp tax only when residential property is purchased, they dropped sharply when the building industry screeched to a halt. A second negative budget effect resulted from increased so-cial welfare outlays. Besides the €6.4bn drop in tax revenues and a €2.9bn increase in social welfare spending, the main contributor to the €13bn defi cit that accumulated during the fi rst recession year was triggered by a 64 per cent increase in net capital outlays compared to the previous year.14
Com-bined with some €20bn that the government had raised but
14 The change of the net capital outlay of the government is mainly driv-en by the capital transfers paid and other capital paymdriv-ents, which increased by 77 per cent with respect to the previous year in value terms.
There is no noteworthy discrepancy between Ireland’s actual experience and the prediction of the model. The actual inter-est rate matches the model’s interinter-est rate almost perfectly. The fundamentals would have justifi ed an even better rat-ing of -0.3. However, this would burst the bounds of Fitch’s rating scale, which ends at AAA (=1). This gap of -1.3 rating classes could be seen as a cushion, a protective buffer for the country’s top rating, should fundamentals deteriorate in future years.
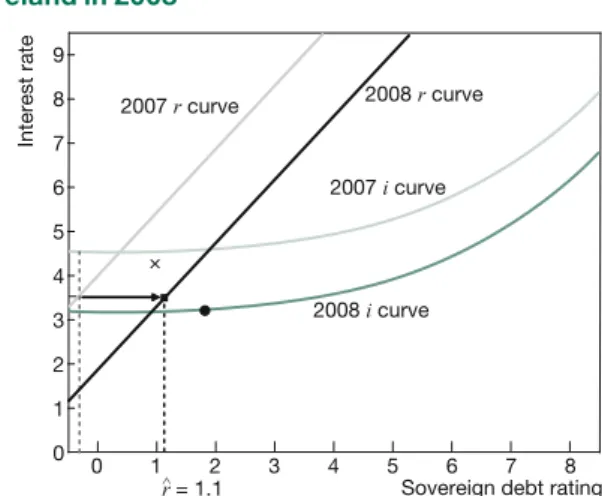
2008: When Lehman Brothers collapsed and money mar-kets froze
This was the year when the global real estate and fi nancial crisis erupted in full force. The bankruptcy of Lehman Broth-ers, the fourth-largest investment fi rm in the United States at the time, sent shivers around the globe. In Ireland, a num-ber of those variables that the econometric model identifi es as key determinants of a sovereign’s solvency, as measured by its credit rating, changed for the worse, moving the rating curve to the right (see Figure 3). Here, dark curves depict the current year. Light-coloured curves depict the previous year to help visualise the change that occurred.
The fi rst repercussions of uncertainty and panic in the fi nan-cial markets and of the bursting housing bubble were felt in the labour market, as unemployment rose from 4.6 per cent to 6.1 per cent. At the same time, Ireland’s GDP shrank by three per cent. In September, Ireland became the fi rst euro area country declared to be in recession. However, Ireland was still able to obtain credit in the fi nancial markets, even at a slightly lower interest rate of 4.3 per cent compared with 4.5 per cent in 2007. But since German government bond yields, taken as a proxy for the risk-free rate, had fallen from 4.5 per cent in 2007 to 3.2 per cent, pushing the interest rate down, Irish rates should have fallen still further. However, this gap is small. It suggests that even after the global scare triggered by Lehman Brothers’ insolvency, government bonds were still considered safe investments both at the centre and on the fringes of the euro area.
In an attempt to safeguard the nation’s banking system after the collapse of Lehman Brothers, but arguably sowing disas-ter for years to come, the government announced an uncon-ditional guarantee of €440bn for more or less all liabilities of Ireland’s major banks. While considered bold and unavoid-able at the time, it is quite possible that Ireland would have taken an entirely different path without this step.
The combined effect of all the relevant deteriorations of fun-damentals increased Ireland’s insolvency risk to an extent that would have called for an immediate downgrade of its sovereign debt rating by 1.4 notches. This is how far the rat-ing curve shifted to the right. About two-thirds of this shift
Figure 3
Ireland in 2008
S o u r c e : Authors’ calculations based on estimates in M. G ä r t n e r, B. G r i e s b a c h : Rating agencies, self-fulfi lling prophecy and multiple equi-libria? An empirical model of the European sovereign debt crisis 2009-2011, University of St. Gallen, SEPS, Discussion Paper No. 2012-15, Fig-ure 5(b). Interest rate r = 1.1 ^ × 2007 r curve 2007 i curve 9 8 7 6 5 4 3 2 1 0 0 1 2 3 4 5 6 7 8
Sovereign debt rating 2008 r curve
Fitch Ratings issued for Ireland, interpreted as a downgrade by half a notch, appears justifi ed, though at the end of the year rather than in March. The actual downgrade by a full three notches must be termed excessive when measured against what the econometric model suggests.
2010: Rien ne va plus
During this year the situation went from bad to worse. This was not so much the case for the real economy, in which the recession appeared to bottom out with another (mod-est) contraction of 0.4 per cent, accompanied by a further rise in the unemployment rate to 13.7 per cent. The real shocker was an unprecedented government budget defi cit of 31.3 per cent, which pushed the debt ratio to 98.5 per cent – well beyond the once famous and now infamous 90 per cent threshold.17 The main contributor to this eye-watering
17 In a highly infl uential paper that seemed to provide the intellectual and empirical underpinnings for austerity policies, C.M. R e i n h a r t , K.S. R o g o f f : Growth in a time of debt, in: American Economic Review, Vol. 100, No. 2, 2010, pp. 573-578, suggested that there was a thresh-old in the government debt-to-GDP ratio at the 90 per cent mark be-yond which income growth turns negative. Scrutinising their work, T. H e r n d o n , M. A s h , R. P o l l i n : Does High Public Debt Consistently Stifl e Economic Growth? A Critique of Reinhart and Rogoff, Univer-sity of Massachusetts Amherst, Political Economy Research Institute showed that once data omissions, weighting oddities and coding er-rors are taken into account, this threshold becomes a mirage. For a non-technical summary of the controversy triggered by this criticism, see J. C a s s i d y : The Reinhart and Rogoff controversy: A summing up, in: The New Yorker, 29 April 2013, available at http://www.newyo- rker.com/online/blogs/johncassidy/2013/04/the-rogoff-and-reinhart-controversy-a-summing-up.html.
put aside for the promised future support of ailing banks, the 7.3 per cent defi cit ratio jolted the public debt-to-GDP ratio to 49.6 per cent.
While the movement of all the predetermined variables in the year when the fi nancial crisis erupted would have justifi ed a downgrade of Irish sovereign debt by 1.4 notches, as men-tioned above, Fitch Ratings retained its AAA rating (as did Moody’s and Standard and Poor’s). Since the suggested 1.4 notches match the buffer that Ireland’s AAA rating had inher-ited from 2007, the top rating in 2008 is fully justifi ed, refl ect-ing the country’s fundamentals almost perfectly.
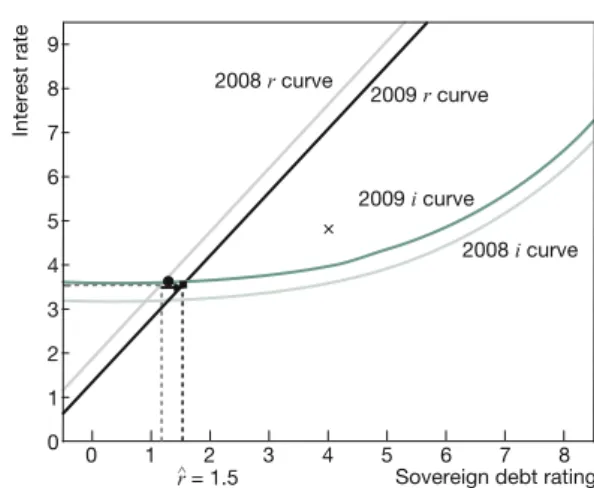
2009: The year everything changed
By 2009, the fi nancial crisis was felt in many parts of the real economy. While the recession had started in 2008 and had already been offi cially declared, it was now in full force. In-come plunged by another seven per cent and caused the unemployment rate to almost double from 6.1 per cent to 11.8 per cent. Inevitably, this caused tax revenues to recede still further, by another €7.5bn, which raised net borrowing to €28.7bn or 13.9 per cent of GDP for the year and pushed the debt ratio up to 64.8 per cent.
While there had still not been any signifi cant and sustained move in the interest rates on Irish government bonds, rating agencies issued their fi rst credit warnings as early as spring. Fitch Ratings put Ireland on a negative watch on 6 March. It is not without irony that Fitch Ratings justifi ed this action by “a slump in government tax revenue”, to which – via the global recession triggered by the fi nancial crisis – rating agencies were major contributors.15 Fitch Ratings downgraded Ireland
a month later by one notch to AA+ and again on 4 November by another two notches to a AA rating.16
As Figure 4 reveals, the empirical model is unable to trace these downgrades. The negative repercussions of the fi nan-cial crisis for the Irish economy shifted the rating curve to the right by less than half a notch. Most of this impact effect can be linked to the signifi cant increase in the country’s debt ratio and dropping income levels. However, an almost matching effect in the opposite direction came from the disappearance of infl ation with its positive consequences for the country’s competitiveness. Measured against these combined effects, at a virtually unchanged interest rate, the negative watch that
15 Bloomberg: Ireland May Lose Its AAA Credit Rating, Fitch Says (Up-date3), 6 March 2009, available at http://www.bloomberg.com/apps/ news?pid=21070001&sid=azL2C1io0Hbg.
16 While we focus on Fitch’s ratings here, as these are used in M. G ä r t -n e r, B. G r i e s b a c h , op. cit., it is worth -noti-ng that Fitch Rati-ngs’ downgrades of Ireland were preceded by Standard & Poor’s actions. Standard & Poor’s had changed Ireland’s outlook to negative on 9 January 2009 and was the fi rst agency to start actual downgrades on 30 March, when it lowered Ireland’s rating to AA+.
Figure 4
Ireland in 2009
S o u r c e : Authors’ calculations based on estimates in M. G ä r t n e r, B. G r i e s b a c h : Rating agencies, self-fulfi lling prophecy and multiple equi-libria? An empirical model of the European sovereign debt crisis 2009-2011, University of St. Gallen, SEPS, Discussion Paper No. 2012-15, Fig-ure 5(b). Interest rate r = 1.5^ × 2008 r curve 2009 i curve 9 8 7 6 5 4 3 2 1 0 0 1 2 3 4 5 6 7 8
Sovereign debt rating 2009 r curve
by about 0.8 percentage points per notch.24 Given that Fitch
Ratings downgraded Ireland by four notches, this roughly accounts for the vertical discrepancy between the actual in-terest rate and the rating curve.
The year ended with a bang when, on 21 November, Ireland became the fi rst country to ask for an international bailout. The reason was that the government had dramatically under-estimated the risks hidden in Irish banks, for which it had is-sued an unconditional guarantee in 2008.
2011: Light at the end of the tunnel?
This year’s silver lining was the return of income growth. How-ever, at 1.2 per cent it remained but a shadow of the growth to which Ireland had become accustomed during its tiger years. Additionally, it was not enough to prevent the unem-ployment rate from creeping up still further, to 14.4 per cent. The government’s budget defi cit remained well in the double digits (13.4 per cent), pushing the debt ratio to 117.6 per cent. The achievements of 20 years of economic reforms, budg-etary discipline and consensus building had been lost in as little as four years. On the positive side, the primary balance continued to improve to -3.6 per cent of potential GDP.
The aggregate effect of these mixed movements of funda-mentals was another small shift of the rating curve to the
24 There appears to be no symmetry in this effect. While downgrades are found to push the market into a panic mode, in which interest rates overreact, there is no comparable response when a sovereign is upgraded. See M. G ä r t n e r, B. G r i e s b a c h , op. cit., Table 4, equa-tion (8).
number was €31bn in aid to the distressed banking sector.18
While the government’s plan was to spread the cost of this support over a decade, EU accounting rules required the full amount to be included in Ireland’s 2009 budget calculations.
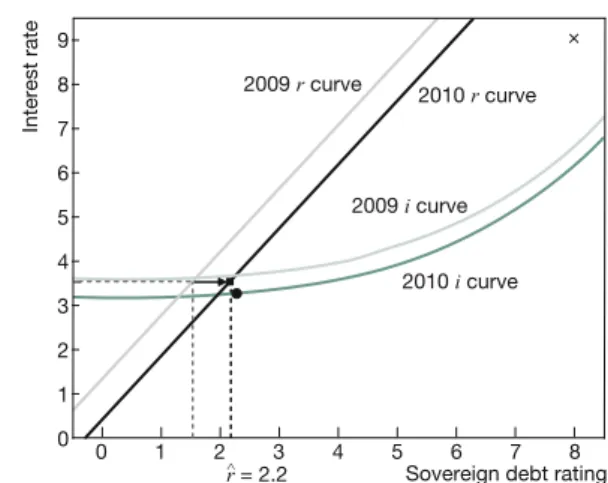
Figure 5 shows that in 2010 Ireland completely deviated from the patterns derived from the past and from other countries. Further deterioration of the fundamentals shifted the rating curve to the right by another 0.7 notches, suggesting a AA+ rating, one notch below AAA. This shift was almost entirely due to the exploding debt ratio. The defi cit also contributed to this, but its effect was mostly reversed by the fi rst signs of improvement in the primary defi cit. However, while the es-tablished patterns recommended an AA+ rating, well within investment grade territory, Fitch Ratings bestowed on the country a BBB+ rating, which is a full six notches worse than AA+. The rationale given for the downgrade was:
The downgrade refl ects the additional fi scal costs of restructuring and supporting the banking system (…); weaker prospects and greater uncertainty regarding the economic outlook as a result of the recent intensifi cation of the fi nancial crisis; and the associated loss of access to market funding at an affordable cost (…).19
Therefore, it is again the recession and the ailing banking system, plus (and here some circularity creeps into the argu-ment) the rising interest rates that the Irish government faces in the bond market, which of course are at least partly driven by the ratings, as Gärtner and Griesbach20 show.21
The model’s impact response to this downgrade would have been an increase in Ireland’s interest rate to about 6.5 per cent. The actual response was even stronger, with the in-terest rate surging to 9.1 per cent by the end of 2010. This “overshooting” of the interest rate is actually in line with the additional results presented by Gärtner and Griesbach,22
which go beyond the baseline version used here.23 These
results suggest that any downgrade, perhaps by disquieting markets, triggers a short-term overreaction of interest rates
18 In total, the bank recapitalisation requirements ultimately summed up to about €70bn after a series of ever increasing estimates starting from €5.5bn in autumn 2008. See S. D e l l e p i a n e , N. H a r d i m a n , op. cit., p. 100.
19 CPI Financial: Fitch downgrades Ireland to “A+”; outlook negative. 7 October 2010, available at http://www.thefreelibrary.com/_/print/ PrintArticle.aspx?id=238897987.
20 M. G ä r t n e r, B. G r i e s b a c h , op. cit.
21 According to the results presented by M. G ä r t n e r, B. G r i e s b a c h , F. J u n g : PIGS or Lambs? The European Sovereign Debt Crisis and the Role of Rating Agencies, in: International Advances in Economic Research, Vol. 17, No. 3, 2011, pp. 288-299, even rating changes that statistical methods cannot link to changes in fundamentals, and thus may appear erroneous or arbitrary, exert a signifi cant infl uence on in-terest rates.
22 M. G ä r t n e r, B. G r i e s b a c h , op. cit.
23 See Table 4 in M. G ä r t n e r, B. G r i e s b a c h , op. cit.
Figure 5
Ireland in 2010
S o u r c e : Authors’ calculations based on estimates in M. G ä r t n e r, B. G r i e s b a c h : Rating agencies, self-fulfi lling prophecy and multiple equi-libria? An empirical model of the European sovereign debt crisis 2009-2011, University of St. Gallen, SEPS, Discussion Paper No. 2012-15, Fig-ure 5(b). Interest rate r = 2.2^ × 2009 r curve 2009 i curve 9 8 7 6 5 4 3 2 1 0 0 1 2 3 4 5 6 7 8
Sovereign debt rating 2010 r curve
Caveats
Our discussion of Ireland’s crisis years (2007-2011) fo-cussed on what we may call the “impact effect” of funda-mentals on sovereign debt ratings. Technically, we looked at the horizontal shifts of the rating curve as the core driver of a country’s debt rating. Table 1 summarises this develop-ment in column 2, repeating that in 2011 Ireland should have been dealt a 2.5 rating, which translates to an AA+ label with a negative watch. This contrasts sharply not only with Fitch’s ratings already discussed in the text and displayed in column 6 but also with the ratings issued by Moody’s and Standard & Poor’s. In the case of Moody’s, the gap between the prediction of the empirical model and the actual sover-eign debt rating in 2011 is an astounding nine rating classes.
As mentioned above, the exclusive focus on the impact ef-fect of fundamentals on default risk, which ignores indirect effects via the interest rate, may underestimate the required downgrade. The extent to which this happens is an empiri-cal question. Hence, columns 3 and 4 look beyond the im-pact effect. Column 3 reports the ratings that result when, instead of keeping it constant, the interest rate is updated every year with the endogenous prediction of the model. This dynamic simulation yields the short-run equilibria marked as black dots in Figures 2-6. As column 3 shows, there is a single year, 2008, during which this approach jus-tifi es a rating inferior to the rating derived from the impact effect.
Column 4 takes one step further and looks at the long-run equilibrium values, defi ned by the points of intersection between the interest rate and the rating curves in Figures 2-6. According to these equilibria, or longer-run gravitation points, the ratings should have been even better than those traced by the impact effects.
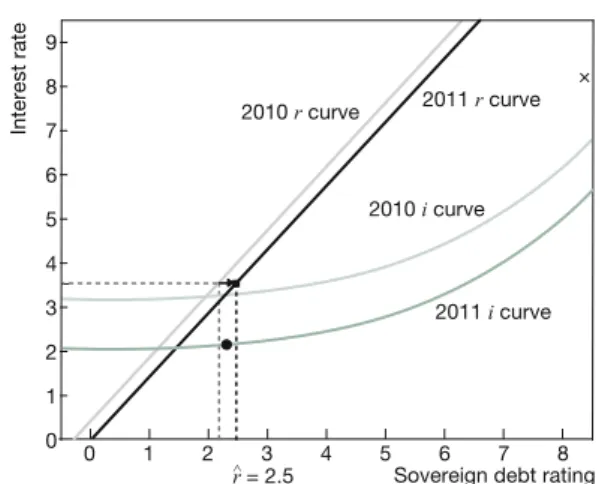
right by 0.3 notches (Figure 6). The actual rating remained at BBB+, 5.5 notches worse than suggested by the econo-metric model.25 The interest rate receded by 0.9 percentage
points to 8.2 per cent, but this may have been led by the drop in the risk-free (i.e. German) rate from 3.3 per cent to 2.1 per cent. All in all, in terms of risk perception and the interest rate it paid on new debt, Ireland was still far away from where it should have been according to the patterns derived from the entire data set.
25 This did not make for a calm year on the rating front. Standard & Poor’s downgraded Ireland in three steps from A to BBB+, with a negative watch, and the rating by Moody’s was lowered from Baa1 to Baa3 to Ba1.
1 os = outlook stable; on = outlook negative; wn = watch negative. We translated negative outlook or watches into an 0.5 add-on in the numerical scale.
Source: Authors’ calculations based on estimates in M. Gärtner, B. Griesbach: Rating agencies, self-fulfi lling prophecy and multiple equilibria? An empiri-cal model of the European sovereign debt crisis 2009-2011, University of St. Gallen, SEPS, Discussion Paper No. 2012-15, Figure 5(b).
Figure 6
Ireland in 2011
S o u r c e : Authors’ calculations based on estimates in M. G ä r t n e r, B. G r i e s b a c h : Rating agencies, self-fulfi lling prophecy and multiple equi-libria? An empirical model of the European sovereign debt crisis 2009-2011, University of St. Gallen, SEPS, Discussion Paper No. 2012-15, Fig-ure 5(b).
Ratings predicted by model using: Actual ratings (end of year)1
Year Fundamentals
only (impact effect)
Fundamentals and the predicted
interest rate
Fundamentals and their long-run
equi-librium effect
Fundamentals and the actual interest rate
Fitch Moody’s Standard &
Poor’s
2007 -0.3 -0.3 0.4 -0.3 1 (AAA; os) 1 (Aaa; os) 1 (AAA; os)
2008 1.1 1.8 0.9 1.5 1 (AAA; os) 1 (Aaa; os) 1 (AAA; os)
2009 1.5 1,3 1.6 2.2 4 (AA-; os) 2.5 (Aa1; on) 4.5 (AA; on)
2010 2.2 2.3 1.9 3.3 8 (BBB+; os) 8.5 (Baa1; on) 6.5 (A; wn)
2011 2.5 2.3 1.5 4.2 8.5 (BBB+; wn) 11.5 (Ba1; on) 8.5 (BBB+; wn)
Table 1
Predicted versus actual ratings
Interest rate r = 2.5 ^ × 2010 r curve 2010 i curve 9 8 7 6 5 4 3 2 1 0 0 1 2 3 4 5 6 7 8
Sovereign debt rating 2011 r curve
cial markets and protect the country from becoming a col-lateral victim of the fi nancial crisis. Given this experience, it is diffi cult to understand how austerity could ever have acquired the status of a “miracle pill”, the ultimate safe-guard against diseases originating from fi nancial markets.
• Projected against an empirical model that explains the interaction between sovereign debt ratings and govern-ment bond yields, and how this is related to the economy at large, since the turn of the millennium in a group of core OECD countries, the negative effects of the fi nancial crisis on incomes and government fi nances should never have triggered the massive upheaval in the market for govern-ment bonds that occurred.
• Ireland’s treatment by the leading rating agencies was conspicuously outside the empirical pattern that can be derived from historical data. While we will probably never know what would have happened without these excessive downgrades and the apparent hyperactivity of the rat-ing agencies with respect to sovereigns, such deviations have the potential to play an unfortunate role in a market in which multiple equilibria loom and any bad news, justifi ed or not, may trigger crises and initiate self-propelling devel-opments towards insolvency.
• Many factors contributed to the metamorphosis of the global fi nancial crisis into what is now called the sovereign debt crisis. A number of these may be country-specifi c. The list often mentioned in the case of Ireland, for example, includes an ill-designed industrial policy, the housing bub-ble, an oversized banking sector, a lopsided tax system and questionable crisis management. Different lists, with overlaps, are offered for Greece, Italy, Portugal and Spain. It would be implausible to deny such idiosyncratic factors. However, the common factors linking the experiences of many countries on Europe’s periphery are distorted de-velopments and panic reactions in the fi nancial markets, both as an initial trigger and as a propagating mechanism once the crisis was under way – with far-reaching political implications. This is the wider lesson from the Celtic Ti-ger play offered here, and this is what policymakers need to address urgently. The European Commission took fi rst steps with its new Directive 2013/14/EU, which is aimed at strengthening the regulatory framework of credit rating agencies.28
28 European Commission: Stricter rules for credit rating agencies to enter into force, Press Release, IP/13/555, Brussels, 18 June 2013. For a detailed discussion see e.g. B. P a u d y n : Credit rating agencies and the sovereign debt crisis: Performing the politics of creditworthi-ness through risk and uncertainty, in: Review of International Political Economy, Vol. 20, No. 4, 2013, pp. 788-818. A brief comparison with the 2010 Dodd-Frank Act in the USA is done by K. L a n n o o : Rate the Rating Agencies!, in: Intereconomics, Vol. 46, No. 5, 2011, pp. 246-247.
Finally, column 5 steps outside the model. The thought ex-periment conducted here treats interest rates as an exog-enous variable. The question asked is whether the actually observed increases in the interest rate, even if they cannot be tracked by the empirical model, would have justifi ed the actual downgrades.26 While the explosion of Irish interest
rates in 2010 and 2011, taken as an exogenous event, would indeed have justifi ed a downgrade to AA-, even this rating falls far short of the actual ratings, and a gap of four to seven rating classes remains unexplained.
Summary and conclusions
Our quantitative exercise reveals and underscores a num-ber of insights regarding Ireland’s recent struggle. However, many of these apply to other countries on the periphery of the euro area as well, and to Europe’s sovereign debt crisis years at large:
• The main trigger and driving force behind the budget and debt problems in many European countries and beyond is the fi nancial crisis that erupted in 2008 and the havoc it played with government revenues and spending. The labels “sovereign debt crisis” and “euro crisis” that have been applied to these developments are misnomers.27
Their uncritical adoption by wider circles in academia, the media and – rather strangely – politicians, despite easily accessible evidence to the contrary, remains a puzzle. Future research, preferably with an interdisciplinary ap-proach, will have to explore the mechanisms that were at work. As an immediate effect, this mislabelling has led many of the recent discussions and policy efforts in the wrong direction, while insuffi cient attention is being paid to the issues that caused and fuelled the fi nancial crisis in the fi rst place.
• Related to the previous point, the Irish experience un-derscores that the mantra-like reference to governments or countries “living beyond their means” is equally mis-leading. If there ever was a country in recent history that showed the determination and resourcefulness, and mustered the political consensus, to deal with debt levels that were considered excessive, it was Ireland. However, bringing the debt level down from 110 per cent to 25 per cent of GDP, near the very low end of the European spec-trum, in two decades was still not enough to soothe fi
nan-26 Another way to look at this exercise is to use actual interest rates rath-er than the ones genrath-erated by the empirical model. Then we open the door for self-fulfi lling prophecy to become part of the “explanation”. When a downgrade, even if not justifi ed by fundamentals, raises the interest rate, it may generate (part of) its own justifi cation.
27 This insight is not really new but begs to be repeated. For an early, comprehensive argument in this direction see R. N e u b ä u m e r, op. cit.