Received: 20 December 2002 Revised: 13 October 2003 Accepted: 2 December 2003 Published online: 4 February 2004 © Springer-Verlag 2004
Abstract The methodology and out-come of a hands-on workshop for the evaluation of PACS (picture archiv-ing and communication system) soft-ware for a multihospital PACS pro-ject are described. The following ra-diological workstations and web-browser-based image distribution software clients were evaluated as part of a multistep evaluation of PACS vendors in March 2001: Im-pax DS 3000 V 4.1/ImIm-pax Web1000 (Agfa-Gevaert, Mortsel, Belgium); PathSpeed V 8.0/PathSpeed Web (GE Medical Systems, Milwaukee, Wis., USA); ID Report/ID Web (Im-age Devices, Idstein, Germany); EasyVision DX/EasyWeb (Philips Medical Systems, Eindhoven, Netherlands); and MagicView 1000 VB33a/MagicWeb (Siemens Medi-cal Systems, Erlangen, Germany). A set of anonymized DICOM test data was provided to enable direct image comparison. Radiologists (n=44) evaluated the radiological worksta-tions and nonradiologists (n=53) evaluated the image distribution software clients using different ques-tionnaires. One vendor was not able
to import the provided DICOM data set. Another vendor had problems in displaying imported cross-sectional studies in the correct stack order. Three vendors (Agfa-Gevaert, GE, Philips) presented server-client solu-tions with web access. Two (Sie-mens, Image Devices) presented stand-alone solutions. The highest scores in the class of radiological workstations were achieved by ID Report from Image Devices
(p<0.005). In the class of image dis-tribution clients, the differences were statistically not significant. Ques-tionnaire-based evaluation was shown to be useful for guaranteeing systematic assessment. The work-shop was a great success in raising interest in the PACS project in a large group of future clinical users. The methodology used in the present study may be useful for other hospi-tals evaluating PACS.
Keywords PACS · Radiological workstations · Hospital-wide image distribution · Technical evaluation · User interface Thomas Boehm Oliver Handgraetinger Juergen Link Ricardo Ploner Daniel R. Voellmy Borut Marincek Simon Wildermuth
Evaluation of radiological workstations
and web-browser-based image distribution
clients for a PACS project in hands-on
workshops
Introduction
PACS (picture archiving and communication system) is considered one of the great advances of the new millen-nium in the field of radiology [1–3]. However, the strate-gy of tendering and implementing a PACS is complex
and to date it has not been standardized [4, 5]. This paper describes the methodology and outcome of hands-on workshops for evaluation of radiological workstations for a multihospital PACS project (http://www.tripacs. unizh.ch) in Switzerland.
T. Boehm (
✉
) · O. Handgraetinger D. R. Voellmy · B. Marincek S. WildermuthDepartment of Medical Radiology, Institute of Diagnostic Radiology, University Hospital Zurich, Raemistrasse 100, 8091 Zurich, Switzerland e-mail: [email protected] Tel.: +41-1-2558723 Fax: +41-1-2554443 J. Link
Kantonal Hospital Winterthur, Winterthur, Switzerland R. Ploner
Municipal Hospital Triemli, Zurich, Switzerland
Materials and methods
Workshop organizationThe workshops were part of an evaluation of tenders from the five participating PACS vendors and were held in March 2001. The following products were available for a period of 1 week in each of the three hospitals participating in the PACS project: (a) Agfa-Gevaert (Mortsel, Belgium), IMPAX DS 3000 V 4.1, IMPAX Web1000; (b) Image Devices (Idstein, Germany), ID Report, ID Web; (c) GE Medical Systems (Milwaukee, Wis., USA), Path-Speed V 8.0 PathPath-Speed Web; (d) Philips Medical Systems (Eind-hoven, Netherlands), EasyVision DX, EasyWeb; and (e) Siemens Medical Systems (Erlangen, Germany), MagicView 1000 VB33a, MagicWeb. One radiologist and one computer specialist from each hospital were trained to provide on-site support for participants. The training consisted of 1 day (1.5 h per vendor) of instruction and 1 day (1.5 h per vendor) of practical work with stand-by help from the vendors. The PACS vendors additionally provided a tele-phone hotline for the duration of the workshop. The vendors were
asked to present the same hardware as listed in their tenders. The computers hosting the web-browser-based image distribution soft-ware were PCs with a technical setup typical for the participating hospital and were provided by the hospitals themselves.
System architecture
Two vendors (Image Devices, Siemens) presented stand-alone workstations with locally installed data sets. Three vendors (Agfa-Gevaert, GE, Philips) implemented server-client systems. Four vendors (Agfa-Gevaert, Image Devices, GE, Philips) presented Windows NT-based workstations, and one vendor (Siemens) a Unix-based system.
Anonymized DICOM image data sets
In order to provide standardized conditions for the vendors, a set of DICOM data on CD-ROM was prepared and was placed at the vendors’ disposal. The vendors had to import the data into their
Table 1 Contents of the evaluation sheet for radiological workstations
Part 1: Personal information, Field A
Name, department, affiliation, professional background Part 2: Assessment/rating area
Field Ba: Image handling features 1. Patient and study search procedures 2. Retrieval of previous studies
3. Change window settings, image contrast 4. Image zoom functions
5. Length and angle measurements 6. Mirror/rotate
7. Cine-mode, scroll trough a series of images
8. Synchronization of two series of images with different window settings
9. Synchronization of a current and a previous examination acquired with different slice widths 10. Hounsfield unit measurements
11. Multiplanar reformat (MPR) Field Ca: Workflow support
1. Workflow for image reading and reporting 2. Workflow for preparation of a clinical conference 3. Workflow for image presentation at a clinical conference Field Da: General presentation
1. Is the software easy to use?
2. Are all necessary software features available? 3. How is the quality of image presentation? Field Ea: General efficiency assessment
Could you imagine working efficiently when using the tested software? Part 3: Free text comments, Field F
Part 3 allows addition of positive and negative comments in free text. The free text comments were not used in this study Part 4: General comments, Field G
Part 4 allows space for general comments in free text Part 5: Assessment of the workshop, Field H Were the questions reasonable?
Was the workshop useful in facilitating a more objective decision making? aThe questions in fields B to E were answered by crossing one of four boxes giving marks to the software product [from “++” for mark 1 (very good) to “−−” for mark 4 (bad)]. The blank was
de-signed to be computer readable to support an efficient data analy-sis. No special “Default Display Protocols (DDP)” were used dur-ing the workshop
Table 2 Contents of the questionnaire for assessment of image
distribution clients
Field Ba: Image handling features
11. MPR was removed, because none of the tested
web-browser-based image distribution software supported MPR
Field Ca: Workflow support
1. Workflow for the emergency department 2. Workflow for the wards
3. Workflow for the outpatient clinics
The questionnaire structure was similar to that used for assessment of radiological workstations. This table shows only those ques-tions that were different
aThe questions in fields B to E were answered by crossing one of the boxes giving marks to the software product [from “++” for mark 1 (very good) to “−−” for mark 4 (bad)]. The blank was de-signed to be computer readable to support an efficient data analy-sis
DICOM database. The CD contained X-ray images, US images, CT image data sets (including large MDCT data sets with more than 600 images), and MRI image data sets.
Questionnaire
Two questionnaires were developed, one for rating radiological workstations and one for rating web-browser-based image distri-bution software clients. The questionnaires consisted of five major parts: part 1, personal information; part 2, assessment/rating area; part 3, free text comments; part 4, general comments; part 5, as-sessment of the workshop. The evaluation sheet for radiological workstations is shown in Table 1. Field A identifies the partici-pant. Fields B–E were answered by crossing one of the boxes scoring the software product [from “++” for mark 1 (very good) to “−−” for mark 4 (bad)]. The blank was designed to be computer readable.
The evaluation sheet for web-browser-based image distribution software was partially identical to the workstation evaluation sheet. Fields B and C were different and are listed in Table 2.
Participants
The workshop was attended by 44 radiologists and 76 clinicians. All radiologists (29, hospital 1; 6, hospital 2; 9, hospital 3) and 53 clinicians (26, hospital 1; 16 hospital 2; 11, hospital 3) answered the entire questionnaire and were included in the present study. In total, 748 scores were rated by radiologists and 848 scores were rated by clinicians. Twenty-three clinicians did not answer the en-tire questionnaire and were, therefore, excluded. The question-naires were answered during the evaluation. Participants were al-lowed to make corrections of the previous ratings after evaluation of all products. Time needed for evaluation of the five products was recorded.
Statistical analysis
Statistical assessment was performed using the paired sign test (StatView Version 5.01, SAS Institute Inc., Cary, NC, USA). To avoid errors caused by multiple testing, Bonferroni correction (n=10) was performed. Therefore, p values less than 0.005 were considered statistically significant.
Anonymization
The workshops were part of a commercial process of evaluation of tenders for a multihospital PACS project. The main aim of this ar-ticle is to describe the methodology of evaluation. We, therefore, named only the best product under the condition that the differ-ence in scoring was statistically significant.
Results
Data handling
One vendor (GE) was not willing or able to import the anonymized DICOM data sets, but provided their own data set consisting of similar studies.
One vendor (Philips) showed difficulties in correct stack presentation of CT and MRI data (including failure of the software routines for MPR presentation).
Only three vendors (Siemens, Image Devices, Agfa-Gevaert) managed to display the prepared DICOM data sets correctly.
Software stability
One vendor (GE) presented first a beta version of a new software release, but was forced to switch during the first week to the current release because of software in-stability. All other products worked stably.
Special software features
One vendor (Agfa-Gevaert) did not provide MPR fea-tures. One vendor (Philips) had restricted MPR capabili-ties because of stack order problems. Two vendors (Im-age Devices, Siemens) provided functioning MPR fea-tures. Two vendors (GE, Siemens) were able to synchro-nize two series with different slice thickness automati-cally.
Two vendors (Image Devices, Agfa-Gevaert) provid-ed self-adjusting “soft shutters” for conventional X-ray images. Two vendors (Agfa, Philips) provided web-browser-based image distribution software with online conferencing tools.
Time needed for assessment
The mean time for assessing the five radiological work-stations by the radiologists was 188±23 min (125–190 min). The mean time used to assess the five image distribution clients by the clinicians was 135±21 min (110–156 min).
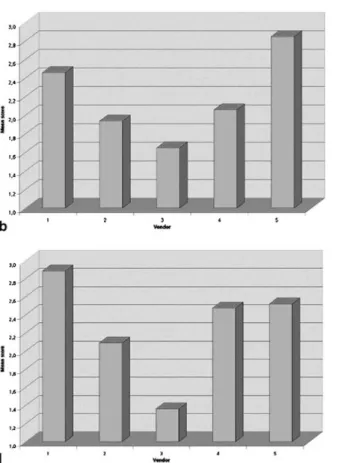
Fig. 1 Results of rating of radiological workstations based on
marks (from 1 “very good,” to 4 “poor”). The mean score repre-sents the mean of the scores assigned by the participating radiolo-gists (n=44) to the different workstations. The workstation with the lowest mean score performs best. a Results of rating of func-tional properties. b Results of rating of the workflow assistance
tools. c Results of rating of the general impression. d Results of rating of the assumed productivity of radiological workstations. The workstation ID Report of vendor 3 (Image Devices) attained the best results (p<0.005) in all categories of assessment. The cor-responding results of the pair-wise statistical assessment are shown in Table 3
Table 3 Results of statistical
assessment (paired sign test) of the ratings of radiological workstations (p values of less than 0.005 are considered sta-tistically significant; Bonfer-roni correction n=10)
Vendor 1 Vendor 2 Vendor 3 Vendor 4
Functional properties (Fig. 1a, field B)
Vendor 2 0.0001
Vendor 3 0.0001 0.0001
Vendor 4 n.s. n.s. 0.0001
Vendor 5 0.0001 n.s. 0.0001 n.s.
Workflow support (Fig. 1b, field C)
Vendor 2 0.0017
Vendor 3 0.0001 0.0046
Vendor 4 0.0003 n.s. 0.0007
Vendor 5 0.0039 0.0001 0.0001 0.0001
General impression (Fig. 1c, field D)
Vendor 2 0.0001
Vendor 3 0.0001 0.0001
Vendor 4 n.s. n.s. 0.0001
Vendor 5 n.s. n.s. 0.0001 n.s.
Productivity assessment (Fig. 1d, field E)
Vendor 2 0.0001
Vendor 3 0.0001 0.0001
Vendor 4 n.s. n.s. 0.0001
Vendor 5 n.s. 0.0037 0.0001 n.s.
Rating of radiological worksta-tions was performed by the ra-diologists. All vendors were compared with each other. The corresponding mean scores for all vendors and groups of pa-rameters are shown in Fig. 1 n.s., statistically nonsignificant
present software in your personal clinical settings?” The answer showed an even greater advantage for the radio-logical workstation of vendor 3 (Image Devices) com-pared to the other vendors (Fig. 1d). In the class of web-browser-based image distribution software clients, ven-dor 4 showed the best results (Fig. 2). However, the dif-ferences in this group were statistically not significant and the name of the vendor was, therefore, not disclosed.
Discussion
To the best of our knowledge, this is the largest trial as-sessing radiological workstations and web-browser-based image distribution software clients reported in the medical literature. Most of the larger hospitals are cur-rently evaluating PACS or will do so in the near future. Therefore, the methodology of evaluation used in our project may be of interest to such hospitals, which are on the verge of obtaining a PACS for their radiological de-partment. PACS is characterized by rapid developments and, therefore, some of the vendors may already have made remarkable changes in their software.
Despite the great importance of user interfaces for ac-ceptance of a PACS, there are only a few publications dealing with the subject of assessment of functional properties of radiological workstations and web-browser-based image distribution software clients [6–12]. Hard-ware features were not directly rated in the present work-shop. They were defined in the “Request for proposal” of the project and the vendors were obliged to present the same technical standard in the workshops as indicated in their offers. Therefore, the attendants were able to assess image quality and image presentation in an authentic set-up. On the other hand, the attending hospital staff was asked not to take into account differences in image retri-eval and speed of image display. Various technical setups of the local networks in the vendors’ installations result-ed in varying speresult-eds of image presentation without the possibility to extrapolate this behavior to the final PACS installation. The “Request for proposal” specified 2 s for image presentation, which all vendors promised to achieve.
The only original paper on the subject of evaluation of radiological workstations was published in 2000 [6]. Seven PC-based radiological workstations were as-sessed in two tests: test 1, ergonomic design and func-tion; and test 2, subjective assessment of user interface and function. The design of the second test was similar to the design of our workshop; however, it included ad-ditional features such as quality of the manuals and tel-eradiology features. Rating was performed by only three radiologists, which seems to be a significant drawback of their study. Honea et al. [12] evaluated the technical abilities of six web-browser-based image dis-tribution software clients. A board of radiologists, tech-Results by fields
The results of the functional assessment of clinical work-stations are shown in Fig. 1. The results of the statistical assessment are listed in Table 3. These results represent mean scores for all participants for the indicated fields. The participants had to assign score 1 for a very good re-sult, score 2 for a good rere-sult, score 3 for an intermediate and score 4 for a bad result of rating in the particular field of assessment. Therefore, the lower the mean score the better the rating. The results of the rating are shown separately for the fields which are defined in Materials and methods (Table 1). Figure 1a shows the results of rating for field B (functional properties of the software). The best marks for functionality were achieved by ven-dor 3 (Image Devices). Concerning workflow assistance (field C, Fig. 1b), workstation vendor 3 (Image Devices) also achieved the best marks, as well as in section D (general impression, Fig. 1c). The differences between the mean scores reached by the ID Report workstation and all other vendors were statistically significant.
Web-browser-based image distribution software clients did not show statistically significant differences in their ratings. The names of the vendors were, there-fore, not disclosed.
The “productivity” assessment
Field E of the evaluation sheet is devoted to the question “Could you imagine working effectively when using the
Fig. 2 Results of rating assumed productivity of image
distribu-tion software clients based on marks from 1 to 4 (1 “very good,” 4 “poor”). The mean score represents the mean of the scores as-signed by the participating clinicians (n=52) to the different soft-ware clients. The softsoft-ware client with the lowest mean score per-formed best. Vendor 4 attained the best results. The corresponding results of the pair-wise statistical assessment were statistically not significant (p>0.005). Based on our anonymization rules the name of the vendor and product were not disclosed under these condi-tions
nical staff, and administrative staff defined a list of pri-mary and auxiliary functions and the installations were tested in accordance to these requirements. Subjective rating of functionality by a group of users was not per-formed in their study.
In performing the workshops, the PACS project group was able to contact a large group of possible future users to make them familiar with the problems and the advan-tages of a filmless hospital, and to integrate them into the process of decision making. Moreover, the workshops al-lowed a direct comparison of the software and hardware offered by the vendors, which aided us in determining the weakness and strength of the products.
There are several advantages but also several short-comings in the setup of such a workshop which may have compromised the results and which are discussed in the following sections.
Evaluation of a typical clinical PC equipped
with a web-browser-based image distribution software client
The vendors provided the radiological workstations for the workshops whereas the PCs hosting the image dis-tribution clients were provided by the hospitals. They hosted a software environment typical for the partici-pating hospital and, therefore, allowed the clinicians to work with the viewers under their customary condi-tions. Performing the test in the typical software envi-ronment was successful in all cases and boosted the confidence of the participating clinicians that the soft-ware will work properly on the PC in their ward or on their personal PC.
Evaluation of system performance
A direct comparison of the systems’ performance was not possible due to the different system architecture of the setups. Most of the vendors used demonstrational se-tups taken directly from their congress booth at the Euro-pean Congress of Radiology in Vienna. A restriction to a certain system architecture would have added another economic burden on the vendors. The participants of the workshop were explicitly informed that performance fea-tures were not part of the evaluation and should not in-fluence the assessment.
On-site support
On-site support during the workshop was provided not by the vendors themselves but by specially trained staff from the three participating hospitals. The main reason was to reduce the costs for the participating vendors and
to prevent direct influence of the vendor’s staff on the participants of the hands-on workshops.
Bias toward intuitive user interface design
One shortcoming of studies assessing user interfaces is a possible bias in favor of intuitively “easy-to-use” soft-ware that has a self-explaining and easy-to-use user in-terface. A properly designed system should of course be intuitive. Instructor training, however, showed that even if the software is less easy to use, the user would eventu-ally be able to use the product after a short training peri-od with identical speed and outcome. For the user who is already accustomed to a given software, the scope of available features becomes even more important than in-tuitive software design. A possible bias may occur if the simplicity of software use is rated higher than the avail-able features and shortcomings in functional properties which may be “masked” by a superior user interface.
Bias due to inhomogeneous groups of readers
The group of clinicians as well as the group of radiolo-gists were both inhomogeneous consisting of physicians who already used an electronic patient record or a mini-PACS in their departments and others who did not and were still fully confined to paperwork and films. Howev-er, PACS evaluation was performed with the aim of in-stalling an identical PACS for all three hospitals and all their departments. Therefore, the additional grouping of workshop participants into groups which were familiar with soft-copy reading and groups which were not would give no additional clues for decision making. Taking these considerations into account, we decided not to di-vide the radiologist and nonradiologists into subgroups.
“Special feature” bias
Special features offered by a certain vendor and not of-fered by others may cause a certain bias. For instance, a conferencing tool in the web viewer as provided by Agfa-Gevaert and Philips might have caused inappropri-ate high ratings for these two products. One may ques-tion whether this may be called a bias. Better funcques-tional properties should improve the results of assessment. A bias only results if the feature, as described above, caus-es an inappropriate low rating of the other products. In the present study this bias was limited by the design of the evaluation sheet, forcing the participant to perform a systematic evaluation.
Conclusion
None of the vendors was able to supply a radiological workstation and a web-viewer software that gained iden-tical acceptance in all users. ID Report from Image De-vices attained the best results in the class of radiological
workstations. The workshops raised attention on the PACS project in a wide range of future users and al-lowed them to assess the functional properties of the software under standardized conditions. The presented methodology may be useful for other hospitals that are evaluating PACS.
References
1. Margulis AR, Sunshine JH (2000) Ra-diology at the turn of the millennium. Radiology 214:15–23
2. Foord K (2001) Year 2000: status of picture archiving and digital imaging in European hospitals. Eur Radiol 11:513–524
3. Arenson RL (2000) PACS: current sta-tus and cost-effectiveness. Eur Radiol 10(Suppl 3):S354–S356
4. Pilling J (1999) Problems facing the ra-diologist tendering for a hospital wide PACS system. Eur J Radiol
32:101–105
5. Osada M, Nishihara E (1999) Imple-mentation and evaluation of workflow based on hospital information system/radiology information system/picture archiving and commu-nications system. J Digit Imaging 12:103–105
6. Pollack T, Lemke HU, Heuser H, Niederlag W, Bruggenwerth G, Kaulfuss K (2000) Evaluation of PC-based radiologic diagnosis worksta-tions. Rontgenpraxis 53:67–74 7. Erickson BJ (1997) What features to
look for in a PACS workstation. Diagn Imaging (San Franc) 19:65–66, 71 8. Erickson BJ (1999) Evaluating a
pic-ture archiving and communications system workstation. J Digit Imaging 12:223–225
9. Eversman WG, Pavlicek W, Zavalkovskiy B, Erickson BJ (2000) Performance and function of a desktop viewer at Mayo Clinic Scottsdale. J Digit Imaging 13:147–152
10. Gale DR, Gale ME, Schwartz RK, Muse VV, Walker RE (2000) An auto-mated PACS workstation interface: a timesaving enhancement. AJR Am J Roentgenol 174:33–36
11. Erickson BJ, Ryan WJ, Gehring DG (2001) Functional requirements of a desktop clinical image display applica-tion. J Digit Imaging 14:149–152 12. Honea R, McCluggage CW, Parker B,
O’Neall D, Shook KA (1998) Evalua-tion of commercial PC-based DICOM image viewer. J Digit Imaging 11:151–155