International Journal of Epidemiology
© International Epidemiological Association 1968
Vol. 17, No. 3 Printed in Great Britain
Multivariate Analysis of Dietary
Patterns in 939 Swiss Adults:
Sociodemographic Parameters and
Alcohol Consumption Profiles
MARIANNE GEX-FABRY, LUC RAYMOND AND OLIVIER JEANNERET
Gex-Fabry M (Department of Social and Preventive Medicine, University of Geneva, Switzerland), Raymond L and Jeanneret O. Multivariate analysis of dietary patterns in 939 Swiss adults: Sociodemographic parameters and alcohol consumption profiles. IntematlonalJournal of Epidemiology 1988,17: 648-555
A dietary survey of 939 Swiss adults, randomly selected from the population of Geneva and its surrounding commu-nities, was performed according to the history method. A factor analysis, using average weekly intake* for 33 food variables, reveals three principal components of the diet: satiating capacity, healthfulness and culinary complexity. These characteristics, together with the energy content of the diet, were analysed for differences according to sex, age, relative weight index, birthplace, marital status and occupation. Ail of these sociodemographic variables influence some dimension of dietary habits. Alcohol consumption is positively associated with satiating, protein rich diets, but energy intake from foods does not signfficatively differ between various groups of abstainers and drinkers. Although the energy contribution of alcoholic beverages is globally additive, we suggest that cultural and societal norms may modulate the relationship of alcohol and diet
Food functions as a supply of energy as well as a
complex behavioural code to create personal eating
patterns. The energy requirement for an individual
depends primarily on his basal metabolic rate, as
deter-mined by age, body size and weight, and also varies
with his work- or leisure-associated level of physical
activity. Additional adjustments may be needed to
account for climatic variations.
1Given these
require-ments and available food resources, the process of
food selection depends on many factors. Physiological
controls include intolerance and sensitivity to
particu-lar substances. Sensory characteristics, such as taste,
visual appearance and texture, are also elements
con-tributing to food preference or aversion. In addition,
social and economic factors lead to evaluation of foods
with respect to cost, convenience, prestige and
healthfulness, among other criteria.
2The influence of alcohol on diet may be considered
from different points of view. It contributes to an
indi-vidual's supply of energy, although the utilization of
Department of Social and Preventive Medicine. University of Geneva, Switzerland.Reprint requests: Professor Olivier Jeanneret, Institut de Medecine Soctale et Preventive, 27 quai Charles-Page, 1205 Geneve, Switzerland.
calories derived from ethanol may be partly
ineffi-cient.
3Alcohol interferes with food absorption:
impaired digestion and metabolism of nutrients have
been documented in alcoholic patients.
4It also affects
the release of neurotransmitters which play important
roles in appetite and satiety controls.
3-* Finally,
sociocultural factors govern the association of specific
drinking habits with particular dietary practices.
Whether alcohol deserves to be considered as a dietary
element in the conventional sense remains a matter of
debate.
Observations relating alcohol to diet generally differ
depending on whether alcoholic or normal subjects are
studied. Nutritional deficiencies in alcoholic patients
have often been reported. Calories derived from
eth-anol tend to replace food calories and may represent
important proportions of the total daily energy
intake.
718In the general population, the
socio-demographic determinants of drinking habits on the
one hand
9-
10and eating patterns on the other
11-
12have
been investigated. The interference of alcohol and diet
raised less interest. Studies generally agree that energy
derived from alcohol adds to the normal diet rather
than replaces food calories.
13"
15This picture is far from
complete however, since alcohol consumption may not
548
only affect total energy balance but may also influence the dynamic process of food selection.
The purpose of the present study is twofold. Firstly, it aims at a better understanding of eating patterns among adult residents of Geneva (Switzerland) and identification of some of their many determinants. Secondly, it focuses on the relationship of eating and drinking habits and the factors which influence the part assumed by alcohol in the diet. Although necessary for measuring the nutritional status of a community, con -ventional evaluation of foods in terms of major nutrients—fat, proteins, carbohydrates—has little to offer in terms of establishing individual dietary prac-tices. Our multivariate approach emphasizes more qualitative dimensions of the diet referred to as 'satiat-ing capacity', 'healthfulness' and 'culinary complex-ity". Its energy content is included in the analysis in order to allow for comparisons with other studies. METHODS
Subjects
A detailed description of the sampling procedure, response rate and representativeness of the sample has been published.16 Briefly, a 61% participation rate was obtained from a random sample of the adult popula-tion of Geneva and immediate surroundings (Canton of Geneva, population ca.350 000). The stratification design led to overrepresentation of the older age
TABLE 1 Sododemographic charoatrisnct of the sample population Characteristic Age 19-34 years 35-44 45-54 55-64 65-74 >75 Obesity index thin normal obese Birth place French Switzerland German Switzerland France Mediterranean countries other countries Marital status single married widowed divorced or separated Total number of subjects
Men 57 84 90 106 110 109 62 363 131 339 62 46 55 54 28 444 52 32 556 Women 51 68 71 53 75 65 44 272 67 203 43 31 45 61 54 231 80 18 383
groups, with 38% of the subjects being 65 years or older, as compared to 13% in the general Geneva population. Of the 960 participants, 21 were excluded because of incomplete data. The distribution of the final population by sex, age, obesity index, marital status and place of birth is given in Table 1. The body mass index (kg/m2) is used to separate thin, normal and fat subjects, depending on whether they are below, within or above the desirable weight range denned by the World Health Organization.1 The cultural back-ground of Geneva residents was assessed through their place of birth summarized in five categories: French speaking and German speaking parts of Switzerland, France, Mediterranean countries, and other countries. In addition, for each male subject, the current or most recent occupation preceding retirement was recorded and classified into one of the following 13 categories: unskilled worker, skilled worker, foreman, craftsman, self-employed, farmer or farmworker, clerk, chief clerk, minor executive, executive, senior executive, professional and general manager. The number of sub-jects exceeds 25 in each occupational group apart from foremen (18) and farmers or farmworkers (10).
Dietary Data
The Geneva dietary survey was based on the history method, previously described and validated by Cubeau and Pequignot.17 Interviews were conducted between 1977 and 1982 by two trained dieticians. The amount and frequency of intake over a two-week period were recorded for 109 foods and beverages, for each meal and intermediate snacks. Questions refer-ring to alcoholic beverages were integrated into the interview: this method to assess alcohol consumption is widely accepted in European latin countries." The average intakes aimed to be representative of usual diets and to account for seasonal variations.17 The energy content of the diet was estimated from a food composition table adapted to the Geneva question-naire.16
In a first attempt to reduce the complexity of the data, some of the initial food items were grouped together (eg whole milk and skimmed milk), while some others were omitted because they were con-sidered as minor components of everyday diets (e.g. game, candy). The final 33 food variables are listed in Table 2, together with mean values and standard devia-tions in grams per week. The items referring to alco-holic beverages were converted to grams of ethanol per day. Contributions were then added and average daily alcohol intake was used to classify subjects into five groups, from abstainers to heavy drinkers.
550
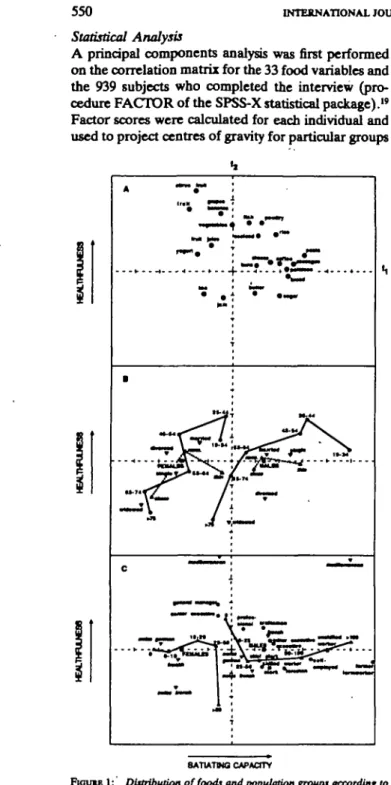
INTERNATIONAL JOURNAL OF EPIDEMIOLOGY Statistical AnalysisA principal components analysis was first performed on the correlation matrix for the 33 food variables and the 939 subjects who completed the interview (pro-cedure FACTOR of the SPSS-X statistical package).19 Factor scores were calculated for each individual and used to project centres of gravity for particular groups
TABLE 2 List of food variables (g/week)
8ATIATH0 CAPACITY
F I G U U I : Distribution of foods and population groups according to
the satiating capacity and healthfulness of the diet.
The axes are ike first and second factors resulting from principal com-ponents analysis. Part A: distribution offoods, for loadings larger than 0.2. Part B: distribution of subjects according to sex (M), age group (O), obesity index (A) and marital status (V). Part C: distribution of subjects according to birth place (V), occupational group (9, men only) and average alcohol intake in grams per day (A). Males end females are TtateH separately.
Label Mean SD
Meat (beef, veal, lamb) Sausages, fat pork meat Variety meats (ie liver) Poultry Foh Seafood Eggs Bread Pitta Rice Potatoes Vegetable* Dry vegetable* Citrus fruit Grapes, bananas, figs Other fruit Milk Yogurt Batter Cheese Sugar Jam, Hooey Buns, croissants Cakes, pies Pudding, ice-cream Chocolate Cookies Crackers Tea Instant coffee Fruit juice Soft drinks 524 99 31 103 145 6 131 862 94 62 828 1723 9 378 215 688 951 331 133 323 142 136 83 42 99 53 50 2 1237 1537 446 294 116 292 128 50 99 129 25 116 620 96 66 535 " 842 38 406 242 640 1207 505 99 240 145 137 155 106 181 95 102 16 1728 1432 894 723 609
of subjects on the factor axes. Analysis of covariance (procedure ANOVA in SPSS-X) was subsequently used to confirm the revealed patterns and remove poss-ible confusion by taking the various sociodemographic variables simultaneously. The principal components were considered as dependent variables, with age and relative weight index as covariates, and marital status, place of birth, occupational group and alcohol con-sumption level as factors. The average daily energy intake, excluding alcohol, was submitted to the same analysis of covariance design.
RESULTS
Figures 1A and 2A illustrate the distribution of food items along the factor axes. The first three components were found to account for 7.6,6.2 and 5.7% of the total variation respectively. Higher order factors contrib-uted to less that 5% each and were neglected for sake of clarity. The three axes represented thus accounted for 19.5% of the inter-individual variability; this rela-tively small proportion reflects the multidimensional
nature of eating patterns. Attribution of provisional meaning to the principal components may nevertheless be attempted. The majority of variables (23 among 33) are positively correlated to the first axis. Main contri-butions are from heavy and basic foods like pasta, potatoes, bread, fat pork meat and sausages, as opposed to light foods, such as fruit, yogurt and tea. On a preliminary basis, one may thus consider the main component as an index of the satiating capacity of an individual's food intake. The second component may be associated with the healthfulness of the diet. It is highly correlated with the amounts of fruit, vegeta-bles, fish, seafood and poultry. These foods are generally bought fresh. They are believed to be vitamin-rich and to promote physical well-being. The third component opposes seafood, poultry and eggs to the majority of the other food items. Maximum posi-tive loadings from jam, butter and cookies suggest that it may reflect a decreasing complexity of the diet, opposing vegetarian and snack types of food to pro-tein-rich dishes which often require more sophisticated preparation.
Since the majority of population studies quantitate the diet in terms of its energy content, the question of how this measurement would relate to the principal components was considered. Some insight is given by correlation coefficients between energy intake and the factor axes: values of 0.65,0.21 and 0.57 are found for components 1,2 and 3 respectively (p<0.001). Assum-ing that the smallest coefficient is negligible when com-pared to the others, an hypothetical energy axis would be located in the first quadrant of Figure 2. As illus-trated, energy rich foods include butter, sugar and bread as well as pasta and jam.
A first insight into the average behaviour of various population groups is found in Figures IB, C and 2B, C, in which sociodemographic parameters are considered independently from each other and separately for males and females. Diagrams include alcohol con-sumption profiles : different intake ranges reflect dif-ferent average consumption levels for men and women (43 and 13 grams of ethanol per day respectively). The proportion of non-drinkers is also larger among women than among men (19% versus 5%). Since some correlations between sociodemographic factors are expected, the results in Figures 1 and 2 are presented together with analyses of covariance tables. Mean values for each population subgroup, expressed as deviations from the grand mean, and adjusted for age, body mass index and the other categorical variables, are reported in Table 3. Effects of sex, age, obesity, marital status, place of birth, occupational group and drinking status are described below.
«*M M t •*»•
>» OCNTBa
• 0PMH
8ATIATMO CAPACITY
F M U U X ' Distribution of foods and population group* according to
the satiating capacity and culinary complexity of the diet
The axes are the first and third factors resulting from principal com-ponents analysis. Part A: distribution of foods, for loadings larger than 0.2. Part B: distribution of subjects according to sex (U), age group (O), obesity index (A) and marital status (V). Part C: distribution of subjects according to birth place fW), occupational group ( • , men only) and average alcohol intake in grams per day (A). Males and females are stated separately.
Sex
Figures IB and 2B indicate that the major difference between males and females relates to the satiating capacity of their diet: women ingest smaller amounts of rich and heavy foods. Their daily energy intake is, on the average, 1268 kJ (303 kcal) lower than men's. No difference affects the quality of the diet, as assessed
552 INTERNATIONAL JOURNAL OF EPIDEMIOLOGY TABLE 3 Analysis of covarimct
fYWARIATFS- rem-ectirwi t-vw^flaeiita Age (years)
Body mass index (kg/m1)
FACTORS: deviations from the grand m Grand mean Birthplace German Switzerland French Switzerland France Mediterranean countries Marital status single roamed widowed divorced Occupation unskilled worker skilled worker foreman craftsman self-employed fanner, farm worker derk chief derk mi DOT executive executive senior executive professional general manager Daily ethanol intake*
abstainer 0-25/0-10 g 25-50/10-201 50-100/20-50 g >100/>50g component 1 ating capacity men -0.021"* -0.025* can 0.28 • at 0.00 -0.08 0.05 0.46 M -0.20 0.00 0.05 0.05 . . . 0.30 -0.01 -0.13 0.13 0.44 1.10 0.09 -0.08 0.04 -0.08 - 0 J 1 -0.28 -0.36 -0.36 -0.20 -0.13 0.27 0.45 woroco -0.009" -0.036" -0.42 • -0.21 -0.01 -0.05 0.28 -0.12 0.06 -0.11 0.05 •• -0.21 -0.10 0.09 0.21 0.43 component 2 heahnfuhtess men -0.018"* -0.020--0.06 . . . 0.02 . -0.14 0.09 0.75 0.06 0.04 -0.21 -0.28 --0.29 -0.10 -0.09 -0.07 -0.01 0.21 -0.05 -0.07 0.20 0.02 0.13 0.27 0.42 m 0.16 0.04 0.00 -0.05 -0.11 women -0.017*" -0.003--0.09 . . . 0.18 -0.22 0.04 0.78 • -0.01 0.02 -0.10 0.19 m -0.05 0.07 0.09 -0.08 -0.44 component 3 low culinary complexity men
o.oor
-0.032* -0.04 0m 0.13 0.06 -0.10 -0.44 . . . 0.03 0.10 - 0 J 1 - 0 3 4 m -0.09 -0.14 0.14 0.25 0.04 0.93 0.08 -0.08 0.04 -0.10 0.16 -0.07 -0.06 . . . 0.60 0.24 0.03 -0.30 -0.29 women 0.008" -0.029-0.06 •• -0.12 0.11 0.06 -0.41 -0.08 0.07 -0.12 -0.24 • 0.27 0.01 0.05 -0.23 -0.43 energy content (kJ/day) men -43.9*" -68.6-9338 -490 -130 -92 310 • 414 138 -745 -1118 •• 314 -230 582 318 925 3457 151 -243 427 -544 -444 -272 -712 m 385 -42 -180 50 356 women - 2 7 . T " -71.6* 8070 -138 -21 247 46 m -151 222 -552 -184 m -176 -17 276 29 -552 # men/women •p<0.05 ••p<0.01 " • p<0.001from its apparent healthfulness and culinary complexity.
Age
Age affects dietary habits in different ways. From Figure IB and the negative regression coefficients in Table 3, it appears that age is associated with reduced intake of most food items, including potatoes, bread, pasta, fish, poultry, fruit and vegetables. A con-comitant decrease of the energy content of the diet is observed. Figures IB and 2B further suggest a possible shift from protein-rich dishes which often require long
or sophisticated preparations (poultry, fish, seafood) to snack foods that do not require cooking (butter and jam, tea and cookies). Interestingly, an inverse trend is observed when comparing the younger age groups: the presence of vitamin-rich elements and the apparent complexity of the diet increase with age.
Relative Weight Index
The energy requirement for a given type of activity depends on body size.1 A heavy subject expends more calories and is thus expected to have higher dietary intakes, providing weight is stabilized. The opposite
effect is found in Table 3. The energy content of the
diet decreases with the obesity index, even though the
effect is slightly above the 5% significance level for
men. From Figure IB, it can be seen that subjects
below the desirable weight range seem to consume
larger amounts of 'filling' foods. A regression
coeffi-cient remains statistically significant when correction is
made for age (Table 3). Figure 2B suggests that obese
people have, on the average, protein rich rather than
vegetarian types of diets.
Marital Status
Figures IB and 2B suggest a possible influence of
mari-tal status on dietary patterns. However, the associated
analyses of covariance reveal that some of the
observed differences are more likely to be attributed to
age. After adjustment for age, the apparent category
effect in Figure IB disappears. Nearly perfect
corres-pondence is found between groups of widowed men
and women and the respective older age groups.
How-ever, some differences remain significant. Widowed
and divorced men tend to have protein rich diets but
reduced intakes of fruit and vegetables, when
com-pared to their married counterparts. Smaller amounts
of jam, butter, cookies lead to the hypothesis that they
may prefer full meals to snacks. Their energy intake is
also lower than for married and single subjects.
Place of Birth
The diet of people from the Mediterranean countries
significantly differs from that of subjects born in
Switzerland or France. It is characterized at once by
abundancy of satiating and vitamin-rich foods and by
culinary complexity, with fish, seafood and poultry
dishes often prepared. No significant differences are
found with respect to food-derived energy.
Occupational Group
The analysis of Figure 1C indicates that large
consum-ers of rich and heavy foods are found mainly among
farmers and farm workers, unskilled workers and
self-employed workers. Larger quantities of inexpensive
foods such as potatoes, pasta, bread and pork meat
characterize their diet. Senior executives,
profession-als and general managers eat, on average, greater
amounts of fish, vegetables and fresh fruit. Significant
differences between groups similarly affect the caloric
content of the diet: subjects in the lower
socio-economic categories tend to have higher energy
intakes (Table 3). As far as healthfulness and
complex-ity of the diet are concerned, the hypothesis of equal
mean values for the 13 groups cannot be rejected after
corrections are made for the other sociodemographic
variables.
Drinking Status
Confirmation of the raw patterns in Figures 1C and 2C
is obtained from the analyses of covariance (Table 3).
Alcohol intake is positively associated with rich diets.
Moreover, heavy drinkers tend to have protein rich
rather than vegetarian types of diets, the latter being
more frequent among abstainers. When analysing
energy content, however, the hypothesis of equal
mean values cannot be rejected, either for men or
women. The contribution of alcohol thus seems to be
additive to food derived energy. As illustrated in
Figure 2C, alcohol consumption profiles are roughly
perpendicular to the postulated energy axis.
Inter-estingly, average energy intakes for either abstainers
or heavy male drinkers exceed that for categories of
small and moderate drinkers. The opposite trend is
found for women.
DISCUSSION
This analysis explores some dimensions of dietary
pat-terns in the Geneva community in relation to a number
of sociodemographic determinants. They all influence
some aspect of the diet, either its energy content or
some more qualitative dimensions. These underlying,
not directly observable dimensions summarize sets of
relationships between a great number of foods
enter-ing the usual diet. The labels satiatenter-ing capacity,
healthfulness and culinary complexity are obviously
crude attributes for complex behavioural variables,
but nevertheless provide valuable guidelines for
discussion.
Besides the often reported sex difference in the
energy content of the diet,
u'
udifferences between
male and female behaviour toward food may be
postu-lated. The general picture in Figure 2B, together with
the observation that Swiss women eat fruit, salad and
yogurt more frequently but sausages and cheese less
often than men
20is in keeping with the sociological
hypothesis of food items having either male or female
attributes.
21Decreasing food intakes with increasing age may be
attributed to decreased energy requirements, which
are in turn associated with changes in body
composi-tion and physical activity.
1The concomitant change in
the apparent complexity of the diet parallels changes in
its nutritional balance. The proportion of calories
derived from proteins and lipids decreases while that
due to carbohydrates increases.
16Although this may be
associated with economic factors, and possibly with
physiological and psychosociological problems related
554
INTERNATIONAL JOURNAL OF EPIDEMIOLOGYto ageing, a generation effect cannot be excluded. For example, important changes have affected the food supply and economic status of the European popula-tion over the last 50 years. The importance of lipids in the French diet has gradually increased at the expense of carbohydrates.22 The apparently more healthy diet of the 35 to 44 year old subjects has to be pointed out. Young adults may emphasize the importance of well-balanced diets for multiple reasons, including presence of children at home, efforts to keep a slim figure and awareness of the nutritional value of foods.
Though contrasting with common belief and routine clinical observations, our results are in agreement with other cross-sectional studies which demonstrate reduced energy intake associated with obesity.23 Poss-ible explanations include underestimation of ingested quantities, decreased physical activity and reduced thermogenic response to food among overweight sub-jects.24 Relative contributions of the major nutrients are not affected by the relative weight of the subjects.23 A distinctive eating pattern among widowed and divorced men was also noted. Their diet, based on protein-rich dishes rather than snacks, has a rather low energy content. One may hypothesize that this group may skip light meals such as breakfast and may eat outside the home more frequently than married sub-jects of the same age. Interestingly, the absence of a spouse induces a dietary change for men only, con-firming that women play the central role in establishing family dietary habits.
An analysis of the cultural determinants of dietary habits is beyond the scope and purpose of the present study. However, a parallel may be drawn between the satiating and protein-rich diet of Geneva residents born in Mediterranean countries and French obser-vations in groups of immigrant workers from Spain and Portugal.26 Abundancy of food and especially of meat is interpreted as a sign of wealth. Traditionally, two full meals are served daily, while snacks often replace din-ner in Swiss families. Only 18% of Swiss people report eating meat for dinner, while 55% report eating bread and 26% cheese.20
The association of rich and satiating diets with occupations involving intense physical activity is not surprising. Energy requirements dearly increase with the intensity and duration of exertion.1 On the other hand, our results qualitatively agree with French studies, pointing to a social hierarchy of foods in which intakes of 'light' and 'heavy' foods respectively increase and decrease with increasing socioeconomic status."
The relationship of alcohol consumption and diet requires particular attention. Overall ethanol intake
obviously gives a crude image of drinking habits. The kind of beverage, the time of the day, the frequency of intake and the quantity imbibed per occasion are likely parameters of the relation of alcohol and dietary hab-its. In our subjects, on the average, wine represented 69% of the ethanol intake, of which 88% was con-sumed at lunch or dinner time. The positive association of alcohol intake with protein-rich, satiating diets may thus be interpreted with respect to the cultural regu-lation of alcohol use.27 In French speaking parts of Switzerland, as in France, the nutritional use of wine is widespread. It is traditionally associated with meals and its intake level may parallel the amount of ingested foods.
The role of alcohol versus food derived energy in the Geneva community corroborates the results of several previous studies:u u Globally, ethanol adds to the diet rather than substitutes for food, for both men and women. Inefficient disposal of calories has been postu-lated as a consequence of alcohol drinking. Possible mechanisms include impaired absorption of foods4 and activation of an energy wasteful metabolic pathway by ethanol.3
The detailed analysis of alcohol consumption pro-files with respect to food derived energy reveals intriguing differences between men and women. Males who drink moderately have lower energy intakes than either abstainers or heavy drinkers, while the opposite trend is found for females. Among heavy drinkers (>50g per day) representing 4% of our female popula-tion, low energy content of the diet and reduced intake of vitamin-rich foods were noted. A previous study reports that alcohol tends to replace food calories to a larger extent among female drinkers than among males.2* The behaviour of heavy female drinkers with respect to alcohol and diet is thus similar to that of male alcoholics, for whom alcohol is a substitute for food.7'* Some insight may be provided by the common clinical experience that women have a greater susceptibility to the pathological effects of alcohol.29 Alternatively, a greater awareness of the energy content of food and alcohol might be invoked.
These preliminary observations suggest that the shape of alcohol consumption profiles with respect to the principal components of the diet may not only depend on gender but on various social and cultural factors. A previous publication revealed that the con-tribution of alcohoWerived calories to the total daily energy intake may be partly culture specific.30 Age, marital status, and socioeconomic status are similarly expected to influence how much, where, when and why a person drinks. Further work is needed to identify the
factors which control and modify the nature of the relationships between eating and drinking habits.
ACKNOWLEDGEMENTS
This research was made possible by grants from the Swiss Nutrition Foundation and the Swiss Foundation for Alcohol Research. Data collection was subsidized by the Swiss National Fund for Scientific Research (FNRS, No. 3.809.0.79), the Swiss Cancer League (FOR.160.AK.79), and the National Institute on Alcohol Abuse and Alcoholism (USA).
The authors would like to acknowledge the assist-ance of dieticians Mrs V Hollenweger, Mrs M-C Zurkirch-Conti, and Mrs M Cudre-Mauroux in collect-ing the data. We are also grateful to Dr Eric Brenner for his valuable comments and to Mrs A Primault for typing the manuscript.
REFERENCES
'World Health Organization. Energy and protein requirements. WHO Technical Report Series No 724, Geneva, 1985. 2 Metier E. Sodocultural aspects of nutrient intake and behavioral
response to nutrition. In: Galler J R (ed) Nutrition and behavior. Plenum Press, New York, 1984; 417-71. 3 Piroia R C, Lieber C S. Hypothesis: energy wastage in alcoholism
and drug abuse, possible role of hepatic microsoinal enzymes. AmJCUn Nutr 1976; ». 90-3.
' Morgan M Y. Alcohol and nutrition. Br Med Bull 1982; 38: 21-9. 5 Hoebel B G. Brain neurotransmitters in food and drug reward. Am J
Clin Nutr 198S; 42: 1133-50.
' d e Wine P. Psychobiologie de l'alcoousme. HCEIA Bull 1983; 3: 372-83.
'Hurt R D , Higgins J A, Nelson R A, Morse R M, Dickson E R. Nutritional status of a group of alcoholics before and after admission to an alcoholism treatment unit. Am J CSn Nutr 1981; 344 386-92.
• Bunout D, Gattas V, Iturriaga H, Perez C, Pereda T, Ugarte G. Nutritional status of alcoholic patients: its possible relation-ship to alcoholic liver damage. Am J din Nutr 1983; 38; 469-73.
' Harford T C. Contextual drinking patterns among men and women. In: Sena* F A (ed) OarenO in alcoholism vol 4. Psychiatric, psychological, social and epidemiologies! studies. Grune and Stratum, New York, 1978; 287-96.
"Edward A M, Schork M A, Harburg E, Moll P P, Burns T L, Ozgoren F. Sources of variability in quantitative level of alco-hol use in a total community: tocjodetoographic and psychoso-cial correlates. Int J Epidemiol 1986; 15: 82-90.
" Grignon C, Grignon C. Styles d"alimentation et gouts populaires. Rev Franc Social 1980; 31: 531-69.
a Bingham S, McNeil N I, Cummings J H. The diet of individuals: a
study of a randomly-chose i section of British adults in a Cambridgeshire village. Br J Nutr 1981; 45: 23-35. uJones B R, Barrett-Connor E, Criqui M H, Holdbrook M J. A
community study of calorie and nutrient intake in drinkers and non-drinkers of alcohol. Am J din Nutr 1982; 35:135-9. M Fisher M, Gordon T. The relation of drinking and smoking habits to
diet: the Upid research clinics prevalence study. Am J Clin Nutr 1985; 41: 623-30.
u Windham C T, Wyse B W, Hansen R G. Alcohol consumption and nutrient density of diets in the nationwide food consumption survey. J Am Diet Assoc 1983; 82: 364-73.
* Morabia A, Raymond L, HoBenweger V, Zurtrirch M C, Rieben A. Variation de la ration nutritjonnelle scion le seze et l'age d'apres un questionnaire aUmentaire quantitatif. Rev Epi-demiol Santt Pubtique 1987; 35: 102-14.
17 Cubeau J, Pequignol G. La technique du questionnaire amnentaire quantitatif utilise par la section nutrition de l'NSERM. Rev Epidemiol Santt Pubtique 1980; Ox 367-72.
"Tuyns A J, Esteve J, Raymond L, Berrino F, Benhamou EetaL Cancer of the larynx/hypopharvnx, tobacco and alcohol. Intj Cancer 1988; 41: 483-91.
" SPSS-X user's guide. McGraw-Hill, New York, 1983.
"Ritzel G. Verzehrsgewohnheiten von Grundnahrungsmitteln in Haushaltungen uod ihre Bedeutung. In: Aebi H, Bhimentahl A, Bohren-Hoerni M et al (eds) Zweiter Schweiierischer ErnaehrungsbertchL Bern, Hans Huber Verlag 1984; 30-57. 21 Bounheu P. La distinction. Paris, Minuit 1979.
22 Pequignot G, Serville Y, Cubeau J, Guilloud-BatsiDe M et M, Guggenbuhl-Pequignot F. La consommation aUmentaire des francais en fooction de la uille des agglomerations, reflet de revolution kmgitudinale. Rev Epidemiol Santt Pubtique 1980; 28: 169-83.
° Krombout D. Energy and macronutrient intake in lean and obese middle aged men (the Zutpben study). Am J CSn Nutr 1983; 37:295-99.
24 Swaminathan R, King R F G J, Holmfield J, Siwek R A, Baker M, Wales J K. Thermic effect of feeding carbohydrate, fat, pro-tein and mixed meal in lean and obese subjects. Am J CUn Nutr 1985; 4 1 177-81.
B Morabia A, Raymond L, Rieben A. Factenrs de risques alimen-taires Msoriet a l'obesitl: surerpotitkm masculine? Mid Soc Prtv 1985; 3<h 231-2.
"Petonnet C. Habitudes alhnentaires et acculturation. Le groupe familial 1983; 99: 60-4.
77 Makda K. The uses of alcohol and their cultural regulation. Ada Social 1983; 2& 21-31.
"Grochow H W, Sobodmki K A, Barboriak J J, ScheUer J G. Alcohol consumption, nutrient intake and relative body weight among US adults. Am J din Nutr 1985; 42: 289-95. 9 Tuyns A J, Pequignot G. Greater risk of asdtic cirrhosis in females
in relation to alcohol consumption. Int J Epidemiol 1984; 13: 53-7.
*> Gex-Fabry M, Gejnbuhler P, Raymond L. Contribution de l'alcool i ('alimentation: addition ou substitution scion I'origine cuhurelle. Utd Soc Prtv 1986; 31: 231-3.