Concise report
Patients with diffuse idiopathic skeletal hyperostosis
do not have increased peripheral bone mineral
density and geometry
Prisca Eser
1, Harald Bonel
2, Michael Seitz
1, Peter M. Villiger
1and Daniel Aeberli
1Abstract
Objectives. Recent studies have suggested that areal BMD (aBMD) measured by DXA is elevated in
patients with DISH. We used peripheral QCT (pQCT) to assess volumetric BMD (vBMD) and bone
geo-metry of the radius, tibia and the third metacarpal bone.
Methods. Patients with established DISH and a control group of healthy individuals were recruited. pQCT
measurements were performed at the distal epiphyses and mid-shafts of the radius, the tibia and the third
metacarpal bone. At the epiphyses cross-sectional area (CSA), total BMD and trabecular BMD were
measured. At the shafts, total bone CSA, cortical CSA, cortical wall thickness and cortical BMD were
determined. In addition, muscle and fat CSA of the forearm and lower leg were assessed. Bone
para-meters were compared between the two groups using independent t-tests.
Results. Thirty DISH patients and 30 controls comparable with regard to age and height were included in
this study. None of the measured bone parameters differed between groups.
Conclusions. In contrast to suggestions based on DXA, pQCT revealed that DISH patients do not have
increased vBMD and bone geometry in the appendicular skeleton. Ossification at tendon or ligament
insertion sites may lead to overestimation of aBMD if assessed by DXA.
Key words: Diffuse idiopathic skeletal hyperostosis, Peripheral quantitative computed tomography, Bone mineral density, Metacarpal bone.
Introduction
DISH is characterized by calcification and ossification of the anterolateral spinal ligaments [1]. It results in ankylosis of the spine and may lead to compression of neuronal structures [2, 3]. The prevalence of DISH is high, affecting >10% of individuals >70 years of age [4]. It is more common and more severe in men [4]. The aetio-pathogenesis of this disorder is largely unknown. Described associations with various metabolic and
endo-crine conditions, including hyperinsulinism, obesity, dysli-pidaemia and hypertension suggest contributing metabolic factors [5, 6].
It has recently been suggested that DISH patients have higher areal BMD (aBMD) at the distal radius measured by DXA [7]. In addition, Haara et al. [8] confirmed earlier find-ings of a higher metacarpal index (MI; greater cortical thickness at the metacarpal bone shaft) in DISH patients. They suggested a joint metabolic factor responsible for the skeletal hyperostosis and the elevated bone mass [8].
The decisive limitation of all existing studies is the fact that 2D methods have been used, that at best allow an estimation of bone mass and a crude assessment of bone geometry. The aim of the present study was, therefore, to measure volumetric BMD (vBMD) and bone geometry of peripheral skeletal sites by means of peripheral QCT (pQCT). In order to minimize the effect of potential con-founding factors, we decided to assess all bony and soft 1
Department of Rheumatology and Clinical Immunology/Allergology and2Department of Radiology, Inselspital Bern, University of Bern, Bern, Switzerland.
Correspondence to: Daniel Aeberli, Department of Rheumatology and Clinical Immunology/Allergology, University Hospital Bern, 3010 Bern, Switzerland. E-mail: [email protected]
Submitted 28 October 2009; revised version accepted 6 January 2010.
tissue parameters at three appendicular sites: the third metacarpal bone, the radius and the tibia.
Methods
Subjects
Patient rolls of the Department of Rheumatology, Inselspital Bern, were screened for DISH patients. Inclusion criteria were age 518 years and radiographic diagnosis of DISH [9] of the thoracic or lumbar spine. Scoring of thoracic and lumbar spine was performed by a study-independent experienced radiologist. Exclusion criteria were pregnancy, previous or current bisphospho-nate therapy, malignancies and endocrinopathy such as thyroid and parathyroid disorder, previous vitamin A therapy, RA and AS.
DISH patients satisfying inclusion/exclusion criteria according to patient histories in the hospital databank were invited to participate in the present study by phone. For the control group, we recruited healthy male and female volunteers aged 20–90 years by locally distributed flyers and advertisements in a local newspa-per. Exclusion criteria for control subjects were bone metabolic disease, hyper/hypoparathyroidism, malignan-cies, chronic renal disease, pregnancy, lactation, previous or current bishosphonate use and drug addiction. All patients gave written informed consent. The study was approved by the ethics committee of the Canton of Bern.
Bone measurements
Measurements were performed with a Stratec XCT 3000 scanner (Stratec Medical, Pforzheim, Germany). This pQCT apparatus measures attenuation of X-rays, which are linearly transformed into hydroxylapatite (HA) densi-ties. Unlike some other pQCT scanners, the Stratec XCT 3000 is calibrated with respect to water, which is set at 60 mg HA, so that fat results in 0 mg HA [10]. HA equiv-alent densities are automatically calculated from the attenuation coefficients by employing the manufacturer’s phantom which itself is calibrated with respect to the European Forearm Phantom (EFP; QRM, Erlangen, Germany) [10]. Radius and metacarpal measurements were performed on the non-dominant side and tibia scans on the contra-lateral side.
Radius and tibia measurements
Tibia length was determined to the nearest 5 mm with a measuring tape by palpation from the medial knee joint cleft to the end of the medial malleolus. Radius bone length was set equal to ulnar length, which was measured from the olecranon to the ulnar styloid. A scout view of the distal end of the tibia and radius and the automated detection algorithm provided by the manufacturer was used to place the reference line at the distal bone end. Scans were performed at 4 and 66% of the bone’s total length measured from the reference line. Slice thickness was 2.3 mm and voxel size was set at 0.5 mm with a scanning speed of 20 mm/s.
Metacarpal measurements
Length of metacarpal bone III was palpated and measured from base to head by a measuring tape to the nearest 5 mm. A scout view was performed of the head of ossa metacarpalia III and the reference line was placed at the distal end of the bone. Scans were performed at 4 and 50% of total bone length measured from the distal bone end. Scanning speed was set at 15 mm/s and voxel size was reduced to 0.3 mm edge length.
Measuring parameters
Epiphyseal scans (4%). The periosteal surface of each bone’s epiphysis was found by a contour algorithm based on thresholding at 180 mg/cm3. BMC/cm of slice thickness, total cross-sectional area (CSA) and total BMD were determined. Concentric pixel layers were then peeled off from the bone’s perimeter until a central area covering 45% (50% for metacarpal bone) of the total bone CSA was left. From this central area, trabecular BMD was determined.
Diaphyseal scans (66% for radius and tibia and 50% for metacarpal bone). The periosteal surface of the bone’s diaphysis was found by a contour algorithm based on a threshold of 280 mg/cm3. BMC and total CSA were
cal-culated. Cortical bone was selected by thresholding at 710 mg/cm3. Of the selected area, cortical CSA and
cortical BMD were calculated. Cortical thickness was calculated based on the assumption that bone shaft is cylindrical, from total CSA, which included the bone marrow and cortical CSA of the diaphyseal scans. Subcutaneous fat CSA was determined by selecting the area with thresholds 40 to 40 mg/cm3 HA density; muscle CSA was determined by subtracting the total bone CSA (threshold 280 mg/cm3) and subcutaneous fat CSA from the total limb CSA. For the metacarpal shaft, the MI was calculated as cortical CSA/total CSA from the 50% scans.
Data analysis
Independent t-tests were performed separately for females and males between the DISH group and control group for age, height, weight, BMI, and muscle and fat CSA at the lower arm and lower leg. Furthermore, inde-pendent t-tests were also performed separately for males and females as well as for pooled sex groups for all measured bone parameters at the radius, tibia and third metacarpal bone. Statistical significance was set at 0.05. Statistical analyses were performed with SPSS version 15.1 (SPSS-Schweiz, Zu¨rich).
Results
Subject parameters
A total of 112 DISH patients were contacted by phone, but due to mainly geographical reasons only 31 (15 females and 16 males) were willing to participate. Of the 105 con-trol subjects recruited for a related study, 30 subjects were selected on the basis of their sex, age, height and weight in order to form two control groups for the female
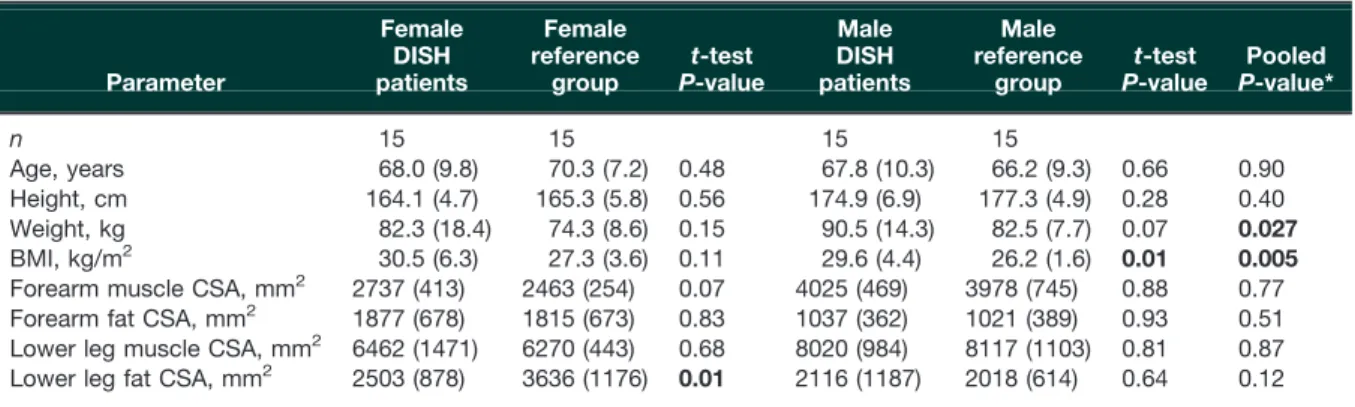
and male DISH groups that were comparable with regard to age, height and weight. One male DISH subject had to be excluded because all of his pQCT scans were affected by strong movement artefacts. Subject characteristics are indicated in Table 1. Reflecting the underlying metabolic disorder of DISH patients, our pooled DISH group was 7.9 kg (10%) heavier (P = 0.027) and had a greater BMI (P = 0.005) than the control group. BMI was also signifi-cantly greater in DISH males compared with control males (by 3.4 kg/m2or 13%, P = 0.01 in males; and by 3.2 kg/m2 or 12%, P = 0.11 in females). Twenty-five DISH patients and 23 control subjects had a BMI 525. Lower leg fat CSA was 31% smaller in DISH females (P = 0.01). Bone parameters
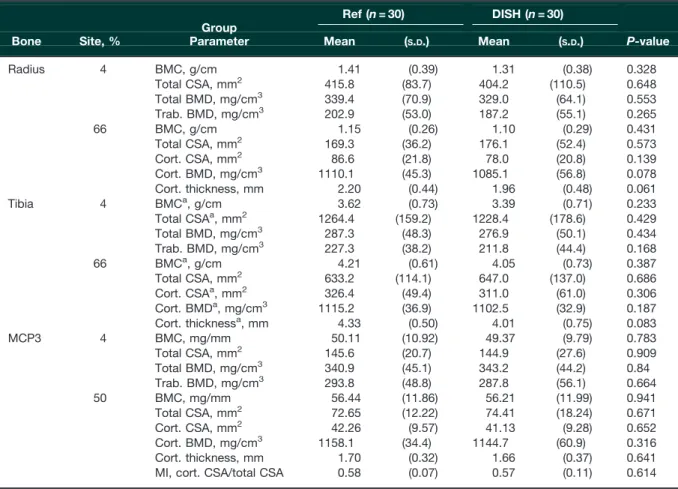
The following scans had to be excluded due to movement artefacts: one radial shaft scan each in the female and male DISH groups and the female and male control groups; one total tibia scan each in the female and male control groups and two total tibia scans in the female DISH group (plus one more tibia shaft scan in the female DISH group); one metacarpal shaft scan in each of the female DISH and control groups and one total metacarpal scan in the male control group. Results for the sexes ana-lysed separately were comparable with the pooled sex groups, therefore, only results of the pooled analyses are presented in Table 2. Remarkably, none of the measured bone parameters differed between the DISH and control groups. In fact, there was a trend for all bone density and geometric data to be smaller in the DISH group, except for outer bone circumference at the shaft (total CSA) and total BMD at the distal metacarpal bone, which was almost identical between groups.
Discussion
Radiographic signs of DISH at the thoracic or lumbo-sacral spine have been associated with increased aBMD at the hip [11], spine [11] and radius [7] as well as an
increased MI [8, 12]. It has been discussed whether the elevated aBMD at the spine of DISH patients is merely due to ossified ligaments [13, 14]. We present the first cross-sectional pQCT study of 30 DISH patients and 30 control subjects. The data provide evidence for unchanged vBMD and bone geometric parameters at all investigated sites, the radius, tibia and metacarpal bone. The following reasons may explain these differences: (i) ossification at tendon or ligament insertion sites in DISH patients may have led to an overestimation of aBMD at the radius, as measured in a study on 42 DISH patients by Di Franco et al. [7]; (ii) differences between the control populations: while the control subjects of the study by Littlejohn et al. [12] were either in- or outpatients of the Rheumatic Disease Unit with likely osteopenia, our control subjects were recruited by flyers and advertisements in a local newspaper and were all healthy and fit for their age; and (iii) the small number of patients in our study and a potential bias due to the relatively poor study participation rate of DISH patients. However, since we did not even find a trend for increased BMD, it is unlikely that a larger cohort would have resulted in significantly elevated vBMD.
The limitations of this study are that the control subjects were lighter and were not radiologically confirmed to be free of DISH. However, most bone parameters measured in the present study showed a trend for lower vBMD and weaker bone geometry in DISH patients compared with controls. Therefore, future studies should test whether DISH subjects have indeed weaker bone strength than control subjects who are radiologically confirmed to be free of DISH. The heavier weight of our DISH patients would normally favour greater bone mass [15, 16]; they showed, however, a trend for lower bone mass. In con-clusion, vBMD or bone geometric parameters at the appendicular skeleton (radius, tibia and metacarpal bone) are not increased in DISH patients compared with healthy controls. Our findings are in contrast to previous studies that have argued for systemically elevated BMD [7, 8].
Table 1 Subject anthropometric data
Parameter Female DISH patients Female reference group t-test P-value Male DISH patients Male reference group t-test P-value Pooled P-value* n 15 15 15 15 Age, years 68.0 (9.8) 70.3 (7.2) 0.48 67.8 (10.3) 66.2 (9.3) 0.66 0.90 Height, cm 164.1 (4.7) 165.3 (5.8) 0.56 174.9 (6.9) 177.3 (4.9) 0.28 0.40 Weight, kg 82.3 (18.4) 74.3 (8.6) 0.15 90.5 (14.3) 82.5 (7.7) 0.07 0.027 BMI, kg/m2 30.5 (6.3) 27.3 (3.6) 0.11 29.6 (4.4) 26.2 (1.6) 0.01 0.005
Forearm muscle CSA, mm2 2737 (413) 2463 (254) 0.07 4025 (469) 3978 (745) 0.88 0.77
Forearm fat CSA, mm2 1877 (678) 1815 (673) 0.83 1037 (362) 1021 (389) 0.93 0.51
Lower leg muscle CSA, mm2 6462 (1471) 6270 (443) 0.68 8020 (984) 8117 (1103) 0.81 0.87
Lower leg fat CSA, mm2 2503 (878) 3636 (1176) 0.01 2116 (1187) 2018 (614) 0.64 0.12
Subject anthropometric data indicated as mean values (S.D.) and P-values of independent t-test. P < 0.05 is indicated in bold. *P-value for pooled groups (females and males together).
Rheumatology key messages
. DISH patients do not have increased vBMD and bone geometric properties at peripheral bones.
. Ossification at tendon/ligament insertion sites in DISH patients may lead to overestimation of aBMD.
Acknowledgements
We would like to thank all participating patients and volunteers.
Funding: The study was financially supported by the sci-entific grant of the Department of Rheumatology and by a personal grant from the Bo¨ni Stiftung to D.A.
Disclosure statement: The authors have declared no con-flicts of interest.
References
1 Forestier J, Rotes-Querol J. Senile ankylosing hyper-ostosis of the spine. Ann Rheum Dis 1950;9:321–30.
2 Sharma RR, Mahapatra A, Pawar SJ, Sousa J, Lad SD, Athale SD. Spinal cord and cauda equina compression in ‘DISH’. Neurol India 2001;49:148–52.
3 Hukuda S, Mochizuki T, Ogata M, Shichikawa K. The pattern of spinal and extraspinal hyperostosis in patients with ossification of the posterior longitudinal ligament and the ligamentum flavum causing myelopathy. Skeletal Radiol 1983;10:79–85.
4 Julkunen H, Heinonen OP, Knekt P, Maatela J. The epi-demiology of hyperostosis of the spine together with its symptoms and related mortality in a general population. Scand J Rheumatol 1975;4:23–7.
5 Sarzi-Puttini P, Atzeni F. New developments in our understanding of dish (diffuse idiopathic skeletal hyperostosis). Curr Opin Rheumatol 2004;16: 287–92.
6 Li H, Jiang LS, Dai LY. Hormones and growth factors in the pathogenesis of spinal ligament ossification. Eur Spine J 2007;16:1075–84.
7 Di Franco M, Mauceri MT, Sili-Scavalli A, Iagnocco A, Ciocci A. Study of peripheral bone mineral density in patients with diffuse idiopathic skeletal hyperostosis. Clin Rheumatol 2000;19:188–92.
Table 2 Results of independent t-tests of measured bone parameters at the distal (4%) and shaft (66 or 50%) site of the radius, tibia and the third metacarpal bone (MCP3) in DISH patients and controls
Group
Ref (n = 30) DISH (n = 30)
Bone Site, % Parameter Mean (S.D.) Mean (S.D.) P-value
Radius 4 BMC, g/cm 1.41 (0.39) 1.31 (0.38) 0.328 Total CSA, mm2 415.8 (83.7) 404.2 (110.5) 0.648 Total BMD, mg/cm3 339.4 (70.9) 329.0 (64.1) 0.553 Trab. BMD, mg/cm3 202.9 (53.0) 187.2 (55.1) 0.265 66 BMC, g/cm 1.15 (0.26) 1.10 (0.29) 0.431 Total CSA, mm2 169.3 (36.2) 176.1 (52.4) 0.573 Cort. CSA, mm2 86.6 (21.8) 78.0 (20.8) 0.139 Cort. BMD, mg/cm3 1110.1 (45.3) 1085.1 (56.8) 0.078 Cort. thickness, mm 2.20 (0.44) 1.96 (0.48) 0.061 Tibia 4 BMCa, g/cm 3.62 (0.73) 3.39 (0.71) 0.233 Total CSAa, mm2 1264.4 (159.2) 1228.4 (178.6) 0.429 Total BMD, mg/cm3 287.3 (48.3) 276.9 (50.1) 0.434 Trab. BMD, mg/cm3 227.3 (38.2) 211.8 (44.4) 0.168 66 BMCa, g/cm 4.21 (0.61) 4.05 (0.73) 0.387 Total CSA, mm2 633.2 (114.1) 647.0 (137.0) 0.686 Cort. CSAa, mm2 326.4 (49.4) 311.0 (61.0) 0.306 Cort. BMDa, mg/cm3 1115.2 (36.9) 1102.5 (32.9) 0.187 Cort. thicknessa, mm 4.33 (0.50) 4.01 (0.75) 0.083 MCP3 4 BMC, mg/mm 50.11 (10.92) 49.37 (9.79) 0.783 Total CSA, mm2 145.6 (20.7) 144.9 (27.6) 0.909 Total BMD, mg/cm3 340.9 (45.1) 343.2 (44.2) 0.84 Trab. BMD, mg/cm3 293.8 (48.8) 287.8 (56.1) 0.664 50 BMC, mg/mm 56.44 (11.86) 56.21 (11.99) 0.941 Total CSA, mm2 72.65 (12.22) 74.41 (18.24) 0.671 Cort. CSA, mm2 42.26 (9.57) 41.13 (9.28) 0.652 Cort. BMD, mg/cm3 1158.1 (34.4) 1144.7 (60.9) 0.316 Cort. thickness, mm 1.70 (0.32) 1.66 (0.37) 0.641
MI, cort. CSA/total CSA 0.58 (0.07) 0.57 (0.11) 0.614
aAccording to Levene’s test group, variances were not equal for this parameter. Hence, individual variances were used for the
8 Haara MM, Arokoski JP, Kroger H et al. Relative bone mineral density measured by metacarpal index (MCI) and chronic spinal syndromes: an epidemiological study. Scand J Rheumatol 2007;36:466–9.
9 Resnick D, Shapiro RF, Wiesner KB, Niwayama G, Utsinger PD, Shaul SR. Diffuse idiopathic skeletal hyper-ostosis (DISH) [ankylosing hyperhyper-ostosis of Forestier and Rotes-Querol]. Semin Arthritis Rheum 1978;7:153–87. 10 Augat P, Gordon CL, Lang TF, Iida H, Genant HK.
Accuracy of cortical and trabecular bone measurements with peripheral quantitative computed tomography (pQCT). Phys Med Biol 1998;43:2873–83.
11 Sahin G, Polat G, Bagis S, Milcan A, Erdogan C. Study of axial bone mineral density in postmenopausal women with diffuse idiopathic skeletal hyperostosis related to type 2 diabetes mellitus. J Womens Health 2002;11:801–4. 12 Littlejohn GO, Urowitz MB, Smythe HA, Keystone EC.
Radiographic features of the hand in diffuse idiopathic skeletal hyperostosis (DISH): comparison with normal
subjects and acromegalic patients. Radiology 1981;140: 623–9.
13 Westerveld LA, Verlaan JJ, Lam MG et al. The influence of diffuse idiopathic skeletal hyperostosis on bone mineral density measurements of the spine. Rheumatology 2009; 48:1133–6.
14 Schwartz JB, Rackson M. Diffuse idiopathic skeletal hyperostosis causes artificially elevated lumbar bone mineral density measured by dual X-ray absorptiometry. J Clin Densitom 2001;4:385–8.
15 Roy DK, O’Neill TW, Finn JD et al. Determinants of incident vertebral fracture in men and women: results from the European Prospective Osteoporosis Study (EPOS). Osteoporos Int 2003;14:19–26.
16 Ducher G, Bass SL, Naughton GA, Eser P, Telford RD, Daly RM. Overweight children have a greater proportion of fat mass relative to muscle mass in the upper limbs than in the lower limbs: implications for bone strength at the distal forearm. Am J Clin Nutr 2009;90:1104–11.