Neural Reorganization Due to Neonatal Amygdala
Lesions in the Rhesus Monkey: Changes in
Morphology and Network Structure
D.S. Grayson
1,2,3
, E. Bliss-Moreau
4,5
, J. Bennett
1,2,5
, P. Lavenex
6,7
and D.G. Amaral
1,2,3,5
1
Department of Psychiatry and Behavioral Sciences, University of California Davis, Sacramento, CA 95817,
USA,
2The MIND Institute, University of California Davis, Sacramento, CA 95817, USA,
3Center for
Neuroscience, University of California Davis, Davis, CA 95618, USA,
4Department of Psychology, University of
California Davis, Davis, CA 95616, USA,
5California National Primate Research Center, Davis, CA 95616, USA,
6Laboratory of Brain and Cognitive Development, Department of Medicine, Fribourg Center for Cognition,
University of Fribourg, 1700 Fribourg, Switzerland and
7Laboratory for Experimental Research on Behavior,
Institute of Psychology, University of Lausanne, 1015 Lausanne, Switzerland
Address correspondence to David G. Amaral, The MIND Institute, UC Davis School of Medicine 2825 50th Street, Sacramento, CA 95817, USA. Email: [email protected]
Abstract
It is generally believed that neural damage that occurs early in development is associated with greater adaptive capacity relative to similar damage in an older individual. However, few studies have surveyed whole brain changes following early focal damage. In this report, we employed multimodal magnetic resonance imaging analyses of adult rhesus macaque monkeys who had previously undergone bilateral, neurotoxic lesions of the amygdala at about 2 weeks of age. A
deformation-based morphometric approach demonstrated reduction of the volumes of the anterior temporal lobe, anterior commissure, basal ganglia, and pulvinar in animals with early amygdala lesions compared to controls. In contrast, animals with early amygdala lesions had an enlarged cingulate cortex, medial superior frontal gyrus, and medial parietal cortex. Diffusion-weighted imaging tractography and network analysis were also used to compare connectivity patterns and higher-level measures of communication across the brain. Using the communicability metric, which integrates direct and indirect paths between regions, lesioned animals showed extensive degradation of network integrity in the temporal and orbitofrontal cortices. This work demonstrates both degenerative as well as progressive large-scale neural changes following long-term recovery from neonatal focal brain damage.
Key words: brain damage, connectome, morphometry, plasticity, tractography
Introduction
Focal brain damage can be characterized by primary neuronal injury and diverse secondary events involved in subsequent degeneration and repair. Secondary modifications of brain structure are not confined to the locus of damage. For instance,
regions exhibiting substantial monosynaptic connectivity with a lesioned area may degenerate due to loss of excitatory input
and/or loss of trophic support (Nauta and Ebbesson 1970;Zasler
et al. 2013). Damage may also trigger neuroplastic mechanisms such as hypertrophy and sprouting of spared axons, dendritic
http://doc.rero.ch
Published in "Cerebral Cortex doi: 10.1093/cercor/bhx080, 2017"
which should be cited to refer to this work.
arborization, synaptogenesis, and gliosis (Wieloch and Nikolich
2006), modifying the cytoarchitecture of both local and distant
structures. In addition, complex network-level changes in neuronal excitability and physiological coupling are a frequent
outcome of focal damage (Fornito et al. 2015; Grayson et al.
2016), leading to further activity-dependent structural
remod-eling over time (Jones and Schallert 1994; Carmichael 2006).
These plastic structural changes often serve as the substrate
for functional recovery (Kolb and Teskey 2012) and can result
in volumetric expansion of remote areas that is observable
with MRI (Schaechter et al. 2006). However, the full extent
of structural remodeling throughout the brain due to focal damage has not been comprehensively investigated and thus could have much larger-scale consequences than previously understood.
Existing data suggest that developmental timing critically affects the extent of secondary damage and repair processes. Results from early monkey studies gave rise to the so-called Kennard Principle, which states that the immature brain has greater capacity for plastic reorganization and functional
recov-ery than a more developed brain (Kennard 1936, 1942). More
recent studies demonstrate that younger individuals with
hip-pocampal damage (Vargha-Khadem et al. 1997;Lavenex et al.
2007) or hemispherectomy (Vargha-Khadem et al. 1994) recover
critical memory or language abilities that older individuals
with similar damage do not (Lavenex et al. 2006). Better
out-come is not always the case since earlier damage to certain
brain regions appears to decrease functional recovery (Kolb and
Cioe 2000;Duval et al. 2008) or exacerbate transneuronal
degen-eration (Hubel and Wiesel 1970;Herbin et al. 1999). This
sug-gests that insults taking place during critical periods may also disrupt the readout of the normal developmental blueprint (Anderson et al. 2011).
This report describes how large-scale primate brain organ-ization is reshaped by early, discrete lesions of the amygdala, a
critical hub of emotional brain networks (Bickart et al. 2014).
While amygdala lesions in adult rhesus monkeys abolish fear
learning (Antoniadis et al. 2009) and dramatically alter social
and emotional behavior (Adolphs 2010), neonatal amygdala
lesions lead to eventual recovery of fear learning in adulthood (Kazama et al. 2012). However, other social and emotional alterations due to neonatal amygdala lesions appear to persist
throughout the lifespan (Bliss-Moreau et al. 2011;Raper et al.
2013; Moadab et al. 2015). These findings suggest that early amygdala damage leads to substantive reorganizational pro-cesses. The current study employed multimodal MRI to identify progressive and regressive consequences that may occur fol-lowing early amygdala lesion.
Structural MRI (sMRI) provides a noninvasive means of investigating morphometric consequences of lesions, while diffusion-weighted imaging (DWI) allows the reconstruction
offiber tracts, facilitating network analysis. This study used
sMRI, along with modern deformation-based morphometric
analysis (Avants et al. 2011a), and DWI to assess brain-wide
morphometry and connectivity in a cohort of adult rhesus macaque monkeys that received bilateral lesions of the amygdala as neonates relative to age-matched controls. We first evaluated evidence for volumetric changes in lesioned animals relative to controls, and then used DWI tractography and graph-theoretic network analyses to assess potential changes across the connectome. We tested the hypothesis that early, focal lesions would result in distributed altera-tions in both morphometry and communication capacity in adults.
Materials and Methods
All experimental procedures were developed in collaboration with the veterinary staff at the California National Primate Research Center (CNPRC). All protocols were approved by the University of California, Davis, Institutional Animal Care and Use Committee.
Subjects and Surgical Procedures
A total of 16 rhesus macaque monkeys were studied. These animals were naturally born of multiparous mothers and were randomly assigned to 1 of 2 conditions: Sham-operated control (CON; n = 8; 4 females and 4 males) or bilateral amygdala lesion (LES; n = 8; 5 females and 3 males). Surgeries occurred when animals were 11–18 days old. Animals were returned to their mothers following surgery and were provided with a social
rearing environment described in detail previously (Bauman
et al. 2006). The surgical procedures are also described in detail
elsewhere (Bauman et al. 2004, 2006). In short, animals were
anesthetized with ketamine (15 mg/kg i.m.) and medetomidine
(30μg/kg) and a T1-weighted MRI scan was acquired to
deter-mine stereotactic coordinates of the amygdala. Animals were then transported to the surgical suite where anesthesia was maintained under isoflurane gas (∼1%) and intravenous infu-sion of fentanyl (7–10 μg/kg/h). Following a midline inciinfu-sion, the skin was reflected laterally to expose the skull and 2 cranioto-mies were made over the left and right amygdala. Ibotenic acid (10 mg/ml) was simultaneously injected bilaterally using
10μl Hamilton syringes (26 gauge beveled needles) at a rate of
0.2μl/min. Each hemisphere consisted of 2 rostrocaudal
injec-tion planes, each with 1–2 mediolateral and 2 dorsoventral injection sites. Complete amygdala lesions required a total of 7–12 μl of ibotenic acid per amygdala. Following all injections, the wound was closed in anatomical layers. Sham-operated controls underwent the same surgical procedures (including midline incision, skull exposure, and wound closure) and were maintained under anesthesia for the average duration of the lesion surgeries.
MRI Acquisition
Two MRI studies were performed when animals were between 3.8 and 4.8 years old and when animals were 11.5 and 12.5 years old. These studies will be referred to as the 4-year and 12-year studies, respectively. While all animals survived into the 4-year study, 2 of the female lesioned animals were euthanized
for health reasons (Bliss-Moreau et al. 2016), resulting in
6 lesioned animals (3 males and 3 females) in the 12-year study. Four-Year Study
Animals received a structural T1-weighted (T1w) MRI scan in the 4-year study. Animals were anesthetized with ketamine (7–10 mg/kg i.m.) and medetomidine (25–50 μg/kg) and secured in an MRI-compatible stereotaxic frame. Scans were acquired in a GE Horizon 1.5 T scanner with a human head coil using a
spoiled gradient pulse sequence (TR = 22 ms; TE = 7.9 ms; 3
averages; voxel size= 0.625 × 0.625 × 0.7 mm3).
Twelve-Year Study
At approximately 12 years of age, 8 controls and 6 remaining lesioned animals underwent high-resolution structural T1w imaging and DWI. Animals were sedated with ketamine (7–10 mg/kg) and maintained under intravenous propofol
(~2 ml/kg/h IV). Scans were acquired using a 3 T Siemens Tim Trio scanner with a custom 8-channel coil using the following
sequences: a T1-weighted MPRAGE (TR= 2500 ms; TE = 2.66 ms;
2 averages; 256 sagittal slices; voxel size= 0.6 × 0.3 × 0.3 mm3);
a DWI scan using a twice-refocused spin-echo echo-planar
sequence (TR= 7600 ms; TE = 95 ms; 48 axial slices; voxel size =
0.6× 0.6 × 1.2 mm3; b = 1000 s/mm2; 128 weighted directions).
Distortions due to susceptibility artifact were corrected using
the point-spread function (PSF) mapping technique (Zaitsev
et al. 2004). The PSF sequence was acquired with TR= 4360 ms
and TE= 30 ms using EPI and geometric settings identical to
the DWI scan, and a reduced PSF FOV factor of 2. Eddy currents cause identical distortions of the PSF data as in diffusion-weighted EPI and therefore these distortions are also faithfully
mapped (Zaitsev et al. 2004).
Image Processing and Analysis
All T1w and DWI image processing was carried out using the
ANTS suite (version 1.9.x; http://stnava.github.io/ANTs/) and
FSL suite (version 5.0;http://www.fmrib.ox.ac.uk/fsl/). An
over-view of the processing steps and analyses is given in Figure1.
Study-Specific Template Construction
A whole-brain mask was obtained for each subject via non-linear registration (ANTS-SyN) to the publicly available inia19
whole-head template image (Rohlfing et al. 2012).
Skull-stripped T1w images were bias corrected using the ANTS N4
bias correction tool (Tustison et al. 2010) and rigid-body aligned
to the coordinate space of the inia19 brain template. Study-specific average T1w templates were constructed for each scan-ning time point (4 and 12 years) from the control subjects.
Templates were built using the default settings in the
“build-templateparallel.sh” script provided in the ANTS package,
which carries out the well-validated“optimal shape”
method-ology laid out in (Avants et al. 2010). Briefly, templates are
con-structed by iteratively averaging subject images together, deformably mapping subjects onto the new average, and re-averaging the deformed images. The mappings were obtained using the ANTS-SyN symmetric normalization algorithm with
correlation coefficient cost-function (Avants et al. 2011a). All
subjects were then re-registered onto the template images, using constrained cost-function masking (CCFM) of the lesions, which were manually traced (DSG) for each case. CCFM has been shown to substantially improve the mapping of lesioned
brain data (Andersen et al. 2010), particularly when used with
ANTS-SyN (Ripolles et al. 2012). Regional and voxelwise
mor-phometric analyses were conducted on the 12-year dataset to facilitate comparison with the DWI analyses. The 4-year data-set was used only for exploration of voxelwise morphometric differences, which benefitted from the larger sample size in order to correct for multiple comparisons across space. Whole-Brain Mask and Tissue Segmentations
The whole-brain mask of the 12-year template image was defined by propagating all individual subject brain masks to template space, averaging, and thresholding at 50%. The tem-plate segmentation for cortical gray matter, white matter, CSF,
Figure 1. Image processing and analysis overview. Brain morphometry and connectivity were analyzed using a step-wise processing pipeline: (1) T1-weighted images were deformably registered to a study-specific average template, facilitating analysis of targeted regional morphometry and whole-brain voxelwise morphometry. (2) Template image was segmented into subcortical gray, cortical gray, white matter, and CSF. (3) Template segmentation was propagated back to subject’s native space. (4) Cortical parcellation (the RM) and manual subcortical tracings in template space were propagated into subject native space, and intersected with the native seg-mentation. (5) Diffusion-weighted image was used to perform probabilistic tractography, seeding streamlines from all white matter voxels. (6) Streamlines terminat-ing in gray matter ROIs were used to construct a weighted connectivity matrix for each subject. Three different graph theoretical measures related to mutual communication (direct connection strength, path length, and communicability) were computed for each edge (i.e., each ROI pair).
and subcortical gray matter was defined using ANTS
segmenta-tion software (Atropos) (Avants et al. 2011b) with tissue priors
obtained from the atlas described in (Styner et al. 2007). Only
minor manual editing of the segmentations were required. Regions Selection for Targeted Morphometric Analysis
A total of 16 cortical regions-of-interest (ROIs) were manually defined (DSG and DGA) on the 12-year template based on their grouping within 5 cortical subdivisions known to anatomically connect with the amygdala: the cingulate, insula, orbitofrontal, lateral temporal, and medial temporal lobe (MTL) cortices. Within each subdivision, 2–5 distinct ROIs were delineated. ROI boundaries were drawn based on established neuroanatomical
criteria in macaque monkeys (Amaral and Price 1984;Vogt and
Pandya 1987;Carmichael and Price 1995;Stefanacci and Amaral 2000,2002;Freese and Amaral 2005;Vogt et al. 2005), with par-ticular emphasis on cytoarchitectonic boundaries that are informative of differential neuroanatomical connectivity with the amygdala. For instance, within the lateral temporal neocor-tex, the rostral inferior temporal gyrus contains the most extensive connections with the amygdala, while there is less connectivity in the caudal superior temporal region. Likewise, in the cingulate cortex, the anterior region has the strongest connectivity with the amygdala while there is substantially less connectivity with the posterior cingulate cortex.
Targeted Regional Morphometry and Whole-Brain Voxelwise Morphometry
At each voxel in template space, the Jacobian matrix was obtained for each subject, which describes the directional stretching or shrinking required to match the subject image to the template after accounting for differences in total brain size via the linear transformation step. The determinant of the Jacobian matrix is a single scalar value obtained from the warp field, indicating the volume ratio of the subject versus the tem-plate at each voxel. Group differences in the volumetric profiles for the full set of 16 ROIs were tested by way of a repeated mea-sures analysis of variance (rm-ANOVA), using region as the repeated measure. Post-hoc t-tests for individual regions were performed if a significant (P < 0.05) interaction between region and group was found.
The Jacobian determinant was then compared between groups voxelwise. The value of each voxel was log-transformed to be symmetric about zero, and group differences were assessed via FSL’s permutation testing (3003 exhaustive permutations) using a voxelwise t-value cutoff of 2.2 (P < 0.05 uncorrected) and multiple
comparisons correction via the“cluster mass” index. To obtain
greater statistical power, results were assessed on the 4-year dataset, which has 2 more lesioned cases, and thresholded at a cluster-corrected P < 0.05. Because the 12-year study had less power, we included uncorrected clusters on the 12-year template that overlapped with corrected clusters observed on the 4-year template.
Comparison of 4-Year and 12-Year Study Data
Due to large differences in scan acquisition parameters between the 2 study time points, the present investigation was not designed to evaluate longitudinal changes. We nonetheless examined morphometric differences between the 2 studies as supplemental information to contextualize subtle discrepan-cies seen in the analysis of the 4-year versus 12-year datasets. To do this, data from the 4-year study was nonlinearly deformed onto the 12-year template, which is higher resolution
and higher signal-to-noise. All ANTS registration parameters were identical to those used in the section Study-Specific Template Construction. Only animals surviving both time points were used. Voxelwise statistical comparisons of the 2 datasets were conducted as paired tests using the log-transformed Jacobian determinants obtained from each sub-ject’s pair of deformation maps. As before, differences were assessed via FSL’s permutation testing using a voxelwise t-value cutoff of 2.2 (P < 0.05 uncorrected) and multiple
compar-isons correction via the “cluster mass” index. We examined
both the main effect of study as well as the interaction between lesion and study.
Diffusion Data Processing and Tractography
DWIs were upsampled to an isotropic 0.6 mm resolution and preprocessed using FSL’s FDT toolkit. Probabilistic tractography data were prepared by computing the local diffusion tensor probability distributions under a multifiber orientation
frame-work (Behrens et al. 2003, 2007). Because the anesthesia and
stereotactic apparatus strictly maintained head position, T1-weighted images were registered to the native DWI space through direct application of scanner coordinates. Probabilistic tractography was carried out using FSL’s probtrackX2, seeding 2000 streamlines bidirectionally from each white matter voxel. Step size was reduced to 0.3 mm, while all other settings were the default. Both ends of each streamline were propagated until reaching the end of the white matter mask.
Connectome Construction
A set of ROIs covering the cerebral cortex was defined using an
existing parcellation called the Regional Map (RM) (Bezgin et al.
2012), comprising 39 ROIs per hemisphere (Supplementary
Table 1). The parcellation was registered to each subject’s native diffusion space via deformable transformation from the canonical F99 space to the 12-year template to native subject space in a single nearest-neighbor interpolation. The resulting parcellations were refined by simultaneously excluding any voxels which did not overlap with the cortical gray matter mask and inflating areas so that the mask was also covered completely. In order to generate a complete gray matter parcel-lation, manual tracings of the entorhinal cortex, hippocampus, 6 bilateral subcortical regions (excluding the amygdala), hypo-thalamus, midbrain, and brainstem were also drawn on the
12-year template (traced by DSG according to Saleem and
Logothetis (2007)) and registered to each subject. The full list of all 97 resultant cortical and subcortical ROIs used for connec-tome construction is given in Supplementary Table 1. Note that the RM regions span the vast majority of cortex and are defined using a unitary set of criteria, providing an ideal framework for
cortical network analysis (Bezgin et al. 2012;Shen et al. 2012;
Goulas et al. 2014). These ROIs are therefore distinct from the cortical ROIs used for targeted morphometric analysis, which were not used for network analysis since they were chosen based on differential amygdala connectivity and only comprise a small portion of the cortical mantle.
The connectivity strength for each ROI pair was quantified as the number of streamlines with endpoints terminating in both ROIs, divided by the average number of voxels in both ROIs that lie adjacent to the white matter. Computed across all possible ROI pairs, these values generate the whole-brain con-nectivity matrix. Because this matrix is asymmetric, symmetry is imposed by taking the average of the matrix and its
transpose. This results in a unique 97× 97 weighted and undir-ected network for each subject—the connectome.
Connectome Analysis
Connectomes were analyzed using graph theory (Bassett and
Bullmore 2009). Our analyses were performed using direct con-nectivity strength matrices and matrices in which edge weights (connection strengths) were transformed into 2 higher-order communication metrics: path length and communicability. As opposed to direct connectivity strength, these metrics provide information regarding how brain regions may communicate across the combination of monosynaptic and polysynaptic pathways. The path length measure describes the shortest “path” to get from one region to another across one or more
links in the network (Rubinov and Sporns 2010). This measure
is often used as a proxy for the efficiency of communication between a pair of ROIs, but can also be extended to infer the
efficiency of a given brain system or the entire brain (Rubinov
and Sporns 2010). Communicability (Estrada and Hatano 2008) is a more recently introduced distance metric that is a broad generalization of path length. The communicability of a pair of ROIs incorporates all possible pathways between them includ-ing nonshortest paths. Because many nonshortest paths typic-ally exist, communicability (more so than path length) strongly reflects empirical functional connectivity measurements (Grayson et al. 2016) and is highly sensitive to disruptions from
focal brain damage (Crofts et al. 2011;Andreotti et al. 2014;de
Reus and van den Heuvel 2014;Grayson et al. 2016). The com-putation of these metrics are detailed below.
Strength
Given the direct connectivity strength matrix W, Wijdefines the
connectivity strength between nodes i and j as the number of
streamlines which connect them. Si, the strength of node i, is
defined as the sum of all weighted edges incident to node i. Because probabilistic tractography can produce many small but spurious connection weights, W (the network) was thresholded to have the minimum network density (i.e., the fraction of con-nected edges vs. total edges) that permitted computation of the below metrics for all region pairs. Effectively, this minimum density ensures that any node can be reached by any other node via one or more links in the network. This corresponded to a density of 35%. To ensure the stability of results, analyses were repeated at densities of 40%, 45%, and 50%.
Path length
Path length is defined as the topologically shortest possible
distance between 2 nodes (Rubinov and Sporns 2010). By
transforming W into a matrix of edge distances, here calcu-lated as D = 1/W, the shortest path between i and j is identi-fied as the list of edges that span the minimum distance between each node pair. Once the path is identified, the weighted path length between i and j is expressed as the sum of edge distances.
Communicability
Communicability is quantified as a weighted sum of direct and all indirect connectivity, where shorter pathways (i.e., those with fewer steps) are weighted more heavily. For determining
communicability in weighted networks (Crofts and Higham
2009), we begin by normalizing each connection weight and
defining a new matrixW′, such thatW′ =ij Wij/ S Si∙ j, where Si
and Sj are the strengths of node i and j. Communicability
between i and j is defined as follows:
∑
= ( ′ ) ! = ( ) = ∞ ′ G W k e ij k k ij W ij 0Brain networks for lesioned and control subjects were com-pared using all 3 types of edge weights (direct connectivity strength, path length, and communicability) via the
Network-Based Statistic (NBS) (Zalesky et al. 2010). As used here, the NBS
computes the sum of t-statistics across the largest component of contiguous edges that exceed a given threshold, and a cor-rected P-value for that sum is calculated by permuting the group labels (3003 permutations). Since the t-statistic threshold is somewhat arbitrary, corrected P-values are shown for all thresholds greater than t = 2 in order to demonstrate results across a wide range of this parameter choice.
Results
Lesion Cases
Histological Analysis of Amygdala Lesions
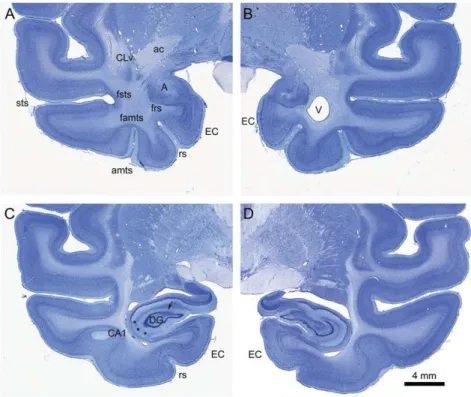
Representative Nissl-stained coronal sections of postmortem
tis-sue and matching MRI slices are shown in Figure2for a control
(CM1) and a lesioned (LM3) animal. Six levels are presented cov-ering the entire rostrocaudal extent of the amygdala. The extent of amygdala damage was also assessed quantitatively for each lesioned case according to protocols explained in detail in (Antoniadis et al. 2007). These analyses demonstrated that the
lesions were largely as intended (Figs2and3) and the amount
of tissue loss by volume is presented in Table 1. The lesions
resulted in near complete (94%) removal of the substance of the amygdaloid complex. The amount of amygdala loss was no less than 88% and was generally fairly symmetrical bilaterally with slightly smaller lesions typically on the animals’ right sides. Sparing of the amygdala was typically restricted to medial regions, such as the periamygdaloid cortex and cortical nuclei. All major nuclei of the amygdala (lateral, basal, accessory basal, and central) were nearly completely removed and there was no consistent area of savings other than the superficial nuclei. The lesions were designed to produce as complete a lesion of the amygdala as possible. Therefore, the lesion extended to the ros-tral and caudal poles of the amygdala and involved tissue located both in front of (the temporal pole) and behind (the hip-pocampal formation) the amygdala.
There was substantial spatial distortion of the remaining healthy temporal lobe tissue as well as an expansion of the temporal horn of the lateral ventricle. Nonetheless, it was pos-sible to carry out a qualitative assessment of the extent of unintended damage to surrounding brain regions. The extrane-ous damage present in these cases was consistent across ani-mals and varied only in the amount of damage that was
sustained (Fig. 3). In the case (LF1) with the most extensive
extraneous damage, there was unintended damage to the cor-tex at the fundus of the superior temporal gyrus. This was con-sistent across most cases and typically occurred throughout the rostrocaudal extent of the amygdala. There was also dam-age to the fundus of the rhinal sulcus leading to cell loss in the perirhinal and rostral entorhinal cortex. In the case with the greatest damage, there was some direct damage to the infero-temporal cortex located lateral to the perirhinal cortex and sur-rounding the anterior medial temporal sulcus. The ventral portion of the claustrum was also damaged. The rostral portion of the hippocampal formation was damaged in this case with
allfields showing cell loss. The damage began to resolve at the
uncalflexure although cell loss in the CA1 field continued caudal
to the level of the lateral geniculate nucleus. In the case with the least amount of extraneous damage (LM1), there was also some cortical damage, although it was confined to levels immediately adjacent to the amygdala and it was much less than in the other cases. The hippocampal formation had minor cell loss mainly confined to the CA field of the hippocampus in the rostral extreme of the hippocampus. A case that demonstrated an
aver-age amount of extraneous damaver-age (LM3—shown also in Fig.2) is
illustrated in higher magnification photomicrographs in Figure3.
In summary, all cases reported here had extensive bilateral elimination of the amygdaloid complex. Given that the lesions were carried out at 2 weeks of age, it is not surprising that some unintended damage occurred. However, this was restricted to relatively localized regions directly adjacent to the amygdala.
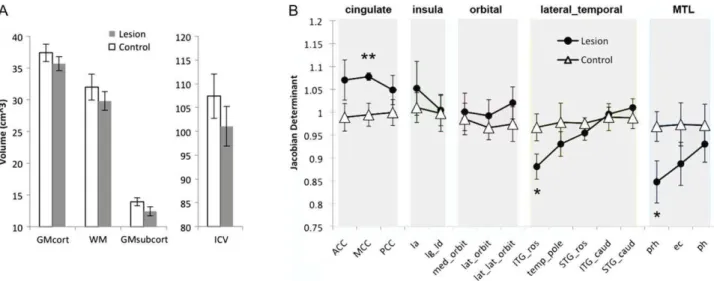
Lesions Produce an Altered Profile of Regional Morphometry
Deformation-based analysis of tissue volume and cortical regional volume from the 12-year study are displayed in
Figure4. No significant differences between lesioned and
con-trol animals were found in terms of total intracranial or tissue volumes, despite a trend towards lower subcortical gray matter in the lesioned animals (t[12] = 1.99, P = 0.075, Cohen’s d = 1.1) and a moderately high effect size in the direction of lower total intracranial volume in the lesioned animals (P = 0.21, Cohen’s d = 0.71). Cortical regional analyses demonstrated distinct
volu-metric profiles between lesioned and control monkeys (Fig.4B;
F[15, 180]= 3.175, P = 0.00012). Within each of the 5 cortical
sub-divisions (cingulate, insula, orbitofrontal, lateral temporal, and medial temporal), the regions are arranged from left-to-right in order of highest to lowest connectivity with the amygdala based on the tract-tracing literature of macaque monkeys (Amaral and Price 1984;Vogt and Pandya 1987;Carmichael and Price 1995; Stefanacci and Amaral 2000, 2002; Freese and Amaral 2005). Within the temporal cortex, the regions most connected to the amygdala (rostral inferior temporal, perirhinal, and entorhinal cortices) contracted the most in the lesioned cases, compared with the control cases. Cortical regions outside of the temporal lobe did not exhibit any significant reductions in volume in lesioned animals. Interestingly, the cingulate cortex was larger in the lesioned animals than in control animals,
Figure 2. MRI and histological sections through the amygdala. Matching coronal MRI and Nissl-stained sections taken at 6 levels (arranged from rostral A to caudal F) for control monkey CM1 (A–F) and lesioned case LM3 (G–L), ordered from rostral (A and G) to caudal (F,L). The amygdala (A) is indicated in the control animal as is the entorh-inal cortex (EC). The anterior commissure (ac) is prominent in the control animal but markedly shrunken in the lesioned animal. Note that the temporal horn of the lateral ventricle (V) is much expanded in the lesioned animal. Scale bar, 5 mm. Abbreviations: A, amygdala; EC, entorhinal cortex; V, ventricle; ac, anterior commissure.
showing a trend in the anterior cingulate (t[12] = 1.95, P = 0.085, Cohen’s d = 1.12) and a significant effect in the middle cingulate (t[12] = 4.41, P = 0.0017, Cohen’s d = 2.1).
Extending results from the regional analysis, voxelwise
ana-lyses conducted on both the 4-year and 12-year datasets (Fig.5)
demonstrated more widespread areas of lesion-induced expansion
Figure 3. Extraneous damage. Histological sections from case LM3 showing the extent of amygdala damage in the medial temporal lobe. The amount of extra-neous damage was judged to be average in this animal and thus provides a summary of consistent damage across the experimental group. Sections are arranged from rostral (A,B) to caudal (C,D). At the level of the amygdala, direct lesional damage was seen in the ventral claustrum (CLv), the fundus of the superior temporal sulcus (fsts), the fundus of the anterior middle temporal sulcus (famts) and the fundus of the rhinal sulcus (frs). There was generally some damage to anterior levels of the hippocampus. In this case, cell loss is apparent in the dentate gyrus and in the CA1field of the hippocampus (asterisks). Abbreviations: CLv, ventral claustrum; A, amygdala; CA1, CA1field of the hippocampus; DG, dentate gyrus; EC, entorhinal cortex; famts, fundus of the anterior middle temporal sulcus; frs, fundus of the rhinal sulcus; fsts, fundus of the superior temporal sulcus; rs, rhinal sulcus; amts, anterior middle temporal sulcus; V, ventricle; ac, anterior commissure; sts, superior temporal sulcus.
Table 1 Amygdala volumes in lesioned and control animals
Group Subject Volume Volume % Loss (%) % Loss (%)
Left amygdala Right amygdala Left amygdala Right amygdala
Control animals; males CM1 187.31 188.69 – –
CM2 247.50 246.95 – –
CM3 252.67 244.87 – –
Average 229.17 226.83
Control animals; females CF1 199.16 197.70 – –
CF2 189.34 190.17 – – CF3 202.38 195.31 – – CF4 193.02 187.69 – – Average 195.97 192.72 Amygdala—lesioned; males LM1 13.73 19.55 94.01 91.38 LM2 9.73 4.15 95.76 98.17 LM3 6.43 13.56 97.19 94.02 Average 9.96 12.42 95.65 94.52 Amygdala—lesioned; females LF1 17.00 22.01 91.32 88.58 LF2 7.29 13.38 96.28 93.06 LF3 14.21 4.85 92.75 97.49 Average 12.84 13.41 93.45 93.04
Volumes are in cubic millimeters. Percent loss was calculated by sex and by hemisphere: (Average volume for control animals– volume of each individual amygdala lesioned animal)/average volume for control animals.
and contraction. Both datasets demonstrated extensive con-traction of the anterior temporal lobe, especially of the peri-rhinal and temporal polar cortices, but also including portions of the rostral inferior temporal cortex and rostral superior tem-poral sulcus. Both datasets also showed contraction of the ven-tral putamen and claustrum, anterior hippocampus, and some white matter adjacent to these structures. This may be due in part to the extraneous effects of the lesion, as detailed in the histological descriptions. Interestingly, the 4-year template revealed a locus of shrinkage in subcortical gray matter extend-ing to the pulvinar, which the 12-year data did not. The 12-year data revealed substantial contraction of the anterior commis-sure that was not detected in the 4-year data, potentially due to the increased spatial resolution and reduced noise in the MRI scans of the 12-year assessment. This apparent interaction between study and lesion effect was marginally significant (cor-rected P = 0.067) (Fig. S1).
Voxelwise results in both 4-year and 12-year datasets (Fig.5)
demonstrated bilateral expansion of the cingulate cortex, cingulate bundle, medial parietal cortex, and medial superior frontal gyrus.
Lesions Alter Network Connectivity
Analysis of distributed connectivity was performed using direct connection weights and higher-order graph metrics. Using the NBS, communicability was the only metric demonstrating a significant group difference across matrix densities (35–50%)
and across a wide range of t-statistic thresholds (Fig.6A–F). A
trend towards lower direct connection strengths in lesioned
animals (0.02< P < 0.2, corrected) was observed in the range of
t = 2–2.6 resulting from a moderate number of suprathreshold connections (~10–90). Inverse path length (the inverse is used since path length is inversely related to connection strength)
demonstrated trend-level reductions (0.05< P < 0.1) from t = 2
to 3.7 and significant reductions (0.008 < P < 0.05, corrected) at t > 3.8 (covering small cluster sizes of 6 edges or less), suggest-ing that network efficiency was reduced between a select group
Figure 4. Profiles of regional morphometry in lesioned versus control animals. (A) Average whole brain tissue volumes (cortical GM, WM, and subcortical GM) and intra-cranial volumes (ICV), per group. Error bars represent standard deviation. Lesioned animals had smaller brains on average as evidenced by lower average ICV and lower volumes in each tissue class (N.S., though see text regarding effect sizes). (B) Regional between-group comparisons of jacobian determinants (values averaged across hemispheres) obtained from the nonlinear deformation procedure after accounting for total brain size. Jacobian determinants signify the ratio of subject vs template vol-ume. Thus, lower values indicate less volvol-ume. Overall, 16 nonoverlapping ROIs are plotted, separated into 5 distinct subsystems and ordered from left-to-right within each subsystem according to known strength of amygdala connectivity (see Methods). Volumetric profiles were distinct across groups (P < 0.001 via rm-ANOVA). Rostral inferior temporal gyrus and perirhinal cortex were significantly smaller in lesioned animals versus controls, while middle cingulate cortex was significantly larger in lesioned animals versus controls. **P < 0.005, *P < 0.05. Abbreviations: ACC, anterior cingulate cortex; MCC, middle cingulate cortex; PCC, posterior cingulate cortex; Ia, agranular insular cortex; Ig_Id, granular/dysgranular insular cortex; med_orbit, medial orbitofrontal cortex; lat_orbit, lateral orbitofrontal cortex; lat_lat_orbit, lateral orbi-tofrontal/ventrolateral frontal cortex; ITG_ros, rostral inferior temporal gyrus; temp_pole, temporal polar cortex; STG_ros, rostral superior temporal gyrus; ITG_caud, cau-dal inferior temporal gyrus; STG_caud, caucau-dal superior temporal gyrus; prh, perirhinal cortex; ec, entorhinal cortex; ph, parahippocampal cortex.
Figure 5. Voxelwise morphometry demonstrates precise areas of lesion-induced shrinkage and cortical expansion. (A) The 4-year dataset. Significantly reduced volume was observed around the amygdala and anatomically con-nected structures, including perirhinal, entorhinal, rostral inferior temporal, and superior temporal cortices as well as subcortical structures such as the ventral putamen, claustrum, anterior hippocampus, and pulvinar. On the other hand, most of the rostrocaudal extent of the cingulate cortex was expanded, as well as parts of the cingulate bundle, medial superior frontal gyrus, and medial parietal cortices. (B) The 12-year dataset. Results were highly consistent with the 4-year dataset. Shrinkage of the anterior commissure was observable, per-haps due to higher spatial resolution and contrast-to-noise ratio. Cortical expansion was observable in the same areas shown in the 4-year data. See also surface projections of these data in Figure7.
of nodes. Significantly reduced communicability (0.01 < P < 0.05) was observed across all t-statistics between 2 and 3.6 covering a broad distribution of cluster sizes ranging from greater than 100 edges down to 10–20. This result suggests that many indirect pathways were disrupted and is consistent with previous reports demonstrating the sensitivity of the communicability metric to
detect lesion-induced changes in network structure (Crofts and
Higham 2009; Crofts et al. 2011; Andreotti et al. 2014). No increases in edge weights were found for any metric (P > 0.1), whether examined across the whole brain or when restricted to
connections involving the cingulate cortical regions. Figure6G–I
shows group differences in direct connectivity strength, path length, and communicability at a t-statistic of 2.8, chosen from the midpoint of communicability’s significance range.
Alterations in path length and communicability primarily involved interactions within the temporal lobe and between
the temporal lobe and orbitofrontal cortex (Fig.6G–I). The
clus-ter of alclus-tered communicability (Fig. 6I) included the bilateral
hippocampi, temporal polar cortices, superior temporal, medial orbitofrontal, and frontal polar cortices, left parahippocampal
Figure 6. Group differences in network structure using 3 graph metrics. (A–F) Each column shows results of the Network-Based Statistic (NBS) method for comparing group differences in network structure between controls vs. lesioned animals. Group differences were assessed using 3 different graph theoretic measures of mutual communication: direct connectivity strength (A, B), inverse path length (C, D), and communicability (E, F). In the top row, for each graph metric (A, C, and E), the size of the largest cluster of edges demonstrating Control> Lesion effects is plotted. The cluster size indicates the number of contiguous edges exceeding a given T-statis-tic threshold. The next row (B, D, and F) shows the FWE-corrected P-value for the corresponding cluster at each T. Dashed lines are displayed at P = 0.05 and 0.01. The legend indicates different matrix densities imposed on the raw connectivity matrix, from which all graph metrics were computed. Gray bars in (C) and (E) indicate the range of cluster size at which we obtained FWE-corrected P < 0.05 for all matrix densities. Note that the path length measure is identical across matrix sparsities since the addition of very small weights do not alter the shortest paths. (G–I) In each column, the largest cluster of edges showing group differences are shown. All effects shown represent Control> Lesion effects. Results are displayed using the raw matrix density of 35% and edge-wise T-stat threshold of 2.8 (P-values shown were obtained with the NBS). Node sizes indicate the sum of suprathreshold effects across the adjoining edges. Each column defines the edge weight differently: direct con-nectivity strength (G), inverse path length (H), and communicability (I).
cortex and inferior parietal cortex, and right subgenual cingu-late and cingu-lateral orbitofrontal cortices. Although the alterations
in path length were less significant on the whole (Fig.6H), the
cluster of edges overlapped strongly with the communicability cluster, and additionally included bilateral insular and occipital cortices. Significant changes in direct connection strengths were
not seen in these same areas (Fig.6G). Taken together, these
results suggest reduced integrity of indirect pathways subserv-ing communication between the temporal cortex and orbitofron-tal cortex in lesioned animals, especially those cortices that are
structurally connected with the amygdala (seeDiscussion).
Discussion
We have demonstrated that early amygdala damage leads to significant reorganization of the developing brain—both in terms of regional volumes and neuroanatomical connectivity. Volume was altered in several cortical, subcortical, and white matter areas. Atrophy was most pronounced in areas with the most substantial direct connectivity with the amygdaloid com-plex, such as the temporal polar and inferotemporal cortices. This is not surprising given the long history of studies of anterograde and retrograde degeneration following lesions (Nauta and Ebbesson 1970;Zasler et al. 2013). The MRI techni-ques used here simply showed these plastic changes through-out the brain withthrough-out the need for direct histological analyses. Network analysis also revealed extensive degradation of fronto-temporal interactions. These analyses were able to detect indi-cations of both monosynaptic and polysynaptic changes. Not all changes that were observed were degenerative since lesioned animals, compared with control animals, exhibited an enlarge-ment of the cingulate cortex and midline frontal/parietal areas.
Local and Remote Degenerative Consequences of Lesions
Damage to neural tissue induces degenerative changes that spread along existing anatomical pathways connected to the
initial site of injury (Fornito et al. 2015). One of the immediate
consequences is loss of the axons originating from the lesioned amygdala neurons, or Wallerian degeneration, which is accom-panied by degeneration of the surrounding myelin sheaths (Jones and Weiss 1983). Injury of sufficient extent will also induce anterograde transneuronal degeneration due to the
removal of appropriate functional input (Nauta and Ebbesson
1970;Zasler et al. 2013) and retrograde transneuronal
degener-ation due to loss of trophic support (Pinching and Powell 1971).
Morphometric atrophy seen in the present study is consistent with these degenerative effects. The primate amygdala recipro-cally connects with numerous cortical regions, but most exten-sively with the temporal lobe in gradients of high-to-low connectivity down the rostrocaudal, inferior–superior, and
mediolateral axes (Amaral and Price 1984). The amygdala also
projects to the contralateral temporal cortex via the anterior
commissure (Klingler and Gloor 1960;Demeter et al. 1990). Our
results thus reflect the removal of amydalocortical axons from recipient brain regions as well as retrograde cell changes due to the loss of a target for amygdalopetal axons.
Local and Remote Plasticity Following Lesions
Despite the loss of gray matter in areas heavily connected with the amygdala, a large swath of cortex encompassing the cingu-late cortex, medial superior frontal gyrus, and medial parietal
cortex was expanded in the lesioned animals. In agreement
with thesefindings, there are several previous structural MRI
studies demonstrating that circumscribed damage can result in distant gray matter expansion. Stroke-related damage to pri-mary motor cortex, for example, results in growth of ipsilateral and contralateral somatosensory and secondary motor areas, which in turn is correlated with improvements in motor
func-tion (Gauthier et al. 2008). In another study, a patient with
long-term somatosensory deafferentation showed abnormal thinning of primary somatosensory cortex (S1) alongside
thick-ening of the cingulate and insula (Ceko et al. 2013), regions that
are anatomically and functionally related to S1. Compensatory augmentations of gray matter volume have also been reported
in individuals with deafness (Allen et al. 2008) and blindness
(Lepore et al. 2010).
These previous studies, and the current report, are consist-ent with what is known regarding cellular morphological changes that occur in response to injury. In the mammalian central nervous system, upregulation of dendritic arborization and synapse formation in areas distant from the site of focal damage are among the dominant mechanisms facilitating
functional recovery (Keller et al. 1990; Dancause et al. 2005;
Dancause and Nudo 2011; Kolb and Teskey 2012). Uninjured axons in perilesional areas may also sprout collateral branches
that travel long distances to reach new targets (Dancause et al.
2005;Carmichael 2006;Henderson et al. 2011). Progressive neu-rodevelopment is also balanced concurrently by regressive pro-cesses (e.g., synapse elimination, cell death, and reductions in neuropil) that are substantial enough to cause observable gray
matter loss (Scott et al. 2016), and this balance could be affected
by developmental insult. Critically, there appears to be greater capacity for anatomical reorganization when damage is
incurred during periods of early development (Goldman and
Galkin 1978;Kolb and Teskey 2012), which may have contribu-ted to the relatively diffuse pattern of hypertrophy seen in this study.
There has been little direct evidence to date regarding large-scale brain reorganization following lesions to areas involved in social or emotional function. However, there is indirect behavioral evidence from previous amygdala lesion studies. For instance, recovery of fear learning deficits has been
demon-strated in macaque monkeys (Kazama et al. 2012) and human
(Becker et al. 2012) adults that sustained very early amygdala damage, but recovery does not occur when damage is incurred
in adulthood (Antoniadis et al. 2007,2009). While some social
deficits persist throughout the lifespan in monkeys with neo-natal amygdala lesions, social functioning is generally less dis-turbed in juveniles or adults that received amygdala lesions as
neonates (Bliss-Moreau et al. 2011; Bliss-Moreau et al. 2013;
Moadab et al. 2015) relative to monkeys lesioned as adults (Adolphs 2010). Thesefindings imply that some compensatory reorganization of neural circuitry over the course of develop-ment occurs as a consequence of early amygdala damage. Importantly, the amygdala is part of a distributed network (Bickart et al. 2014) and influences activity throughout multiple distinct functional brain systems, including regions to which it
has no direct anatomical connectivity (Grayson et al. 2016),
bol-stering the notion that behavioral recovery would be subserved
by distributed changes in neuronal network organization (Kolb
and Gibb 2014). The cortical hypertrophy observed in this study indeed suggests that multiple functional areas remote from the initial damage were recruited in the reorganization process. However, it must also be noted that this study does not distin-guish between adaptive and maladaptive (or nonefficacious)
plasticity and further testing would be needed to confirm whether the observed hypertrophy is related to behavioral compensation.
Cingulate Cortex Hypertrophy
Hypertrophy of the cingulate cortex and surrounding areas of the medial superior frontal and medial parietal cortices is a
particularly interestingfinding both because of the connectivity
and function of the cingulate. The dorsal anterior cingulate cor-tex, sometimes referred to as the midcingulate, is notable for its structural and functional connectivity with the amygdala (Pandya et al. 1981;Roy et al. 2009), and its related roles in
noci-ceptive and affective processing (reviewed inVogt (2005)). Gray
matter hypertrophy in this area could have resulted from plas-ticity associated with regenerative cellular cascades induced shortly after the injury or from longer-term restructuring of cir-cuitry over the course of development. Interestingly, the cingu-late cortex and the medial frontal and medial parietal cortices have repeatedly been identified as major hubs of the brain in humans and macaques, serving as a relay for many of the brain’s long-distance pathways across functional domains (Harriger et al. 2012; Goulas et al. 2014; Grayson et al. 2014;
Miši´c et al. 2014). One could speculate that these areas may provide a substrate for recapitulating integrative processes previously subserved by the amygdala. It is also possible that hypertrophy does not support any specific behavioral adapta-tion, and that other phenomena, perhaps unobservable with MRI, may account for long-term vicariation of amygdala func-tion. Despite these caveats, our results can be put into a broader context based on recent functional neuroimaging work from our laboratory. This work found that transient amygdala inactivation resulted in a shift in the brain’s
func-tional state (Grayson et al. 2016). While functional
connectiv-ity between orbitofrontal, medial prefrontal, and temporal
cortices robustly decreased, functional connectivity increased between multiple other regions including the dorsal anterior
cingulate and other areas of sensory and motor cortex (Fig.7).
Enhanced neurophysiological coupling in these areas, sus-tained over development, may modulate activity-dependent
processes leading to altered gray matter volume (Markham
and Greenough 2004).
A fundamental limitation of the present work is that the precise mechanisms underlying gray matter expansion are unknown, and there are several possibilities as outlined above. Nonetheless, a recent report on 2 human subjects with
long-term, early onset amygdalar damage (Boes et al. 2012)
demon-strated anomalies in cortical thickness, including both
increases and decreases, bearing a spatial distribution with
striking resemblance to the results reported here (Fig. 7).
Together thesefindings potentially suggest a conserved pattern
of degenerative and progressive lesion-induced responses across primate species.
Changes in Network Organization
Disrupted network interaction, particularly communicability, was observable between regions with extensive amygdala con-nectivity, such as the hippocampus, temporal cortex, and orbi-tofrontal cortex. Interpreting changes in communicability is more complex than the analysis of changes in direct connectiv-ity. However, these data indicate deterioration of these subnet-works—potentially differing somewhat across animals, but giving rise to a common pathology on a topological level. These observations corroborate prior studies demonstrating the use-fulness of the communicability measure. While path length is frequently relied upon to estimate changes in communication
efficiency (Rubinov and Sporns 2010;Goni et al. 2014;Chu et al.
2015), the strength of the shortest path excludes relevant
infor-mation regarding additional indirect communication pathways
Figure 7. Relationship of morphometric effects with previousfindings of structural and functional effects of amygdala pathology. (A) Morphometric effects of neonatal amygdala lesions in 12-year old rhesus macaques. Same data as presented in Figure4B, projected onto the cortical surface. (B) Effects of transient amygdala inactiva-tion on regional funcinactiva-tional connectivity in rhesus macaques (as previously published). Funcinactiva-tional connectivity was defined as the strength of a region’s spontan-eously correlated activity with other brain areas. Regions that exhibited transiently increased functional connectivity, as a result of amygdala inactivation, encompassed the ACC and primary motor and somatosensory cortex. Decreased functional connectivity was seen in the amygdala, medial orbitofrontal cortices, and especially temporal polar and ventral temporal cortices. Visualization adapted from data presented in (Grayson et al. 2016). (C) Altered cortical thickness in adult human patients with developmental amygdala damage due to Urbach-Wiethe, a rare genetic disease. Results were assessed in 2 patients relative to a cohort of age-matched controls. Significantly increased cortical thickness was seen bilaterally in the ventromedial prefrontal cortex and cingulate cortex, especially the ACC. Reduced thickness was seen bilaterally around the amygdala. Adapted from (Boes et al. 2012). Coloring scheme was adjusted to match that used in (A) and (B).
(Goni et al. 2014;Grayson et al. 2016). Our results support the notion that focal lesions disrupt many parallel pathways and that communicability provides a sensitive framework for
cap-turing these disruptions (Crofts et al. 2011;Andreotti et al. 2014;
de Reus and van den Heuvel 2014).
Gray Matter Versus White Matter Involvement in Postlesional Plasticity
Both morphometric and network effects provide convergent information about the long-term degenerative influence of early amygdala damage. On the other hand, there is a possible discrepancy between morphometric and network effects observed in the cingulate cortex. We did observe hypertrophy but did not observe significant increases in connectivity (or communicability) with these areas. This suggests at least 2
pos-sibilities. The first is that gray matter effects (e.g., synaptic
refinement) rather than white matter effects (e.g., myelination, growth of axonal diameter) may predominate as the mechan-ism of postlesional plasticity. The second possibility is that the diffusion imaging measures (estimated number of streamlines between 2 regions) are relatively insensitive to true white mat-ter effects. Recent work has cast considerable doubt about the sensitivity of diffusion-based tractography and demonstrates
sources of artifact that hide the presence of nondominantfiber
pathways even with cutting edge acquisition and processing
approaches (Thomas et al. 2014;Calabrese et al. 2015;Reveley
al. 2015;Donahue et al. 2016). We would therefore cautiously suggest that our results agree with notions that postlesional plasticity is subserved primarily by synaptic or other gray
mat-ter refinement to complex neuronal networks (Kolb and Gibb
2014). However, future work bridging connectomics, histology,
and behavior will be crucial for elucidating the specific mechanisms involved in recovery of specific behaviors.
Supplementary Material
Supplementary material are available at Cerebral Cortex online.
Funding
This research was supported by the National Institutes of Health grants MH41479 and 5R37 57502.
Notes
We thank Kelly Shen, Gleb Bezgin, and Randy McIntosh for sharing the RM parcellation. Conflict of Interest: None declared.
References
Adolphs R. 2010. What does the amygdala contribute to social cognition? Ann N Y Acad Sci. 1191:42–61.
Allen JS, Emmorey K, Bruss J, Damasio H. 2008. Morphology of the insula in relation to hearing status and sign language experience. J Neurosci. 28:11900–11905.
Amaral DG, Price JL. 1984. Amygdalo-cortical projections in the monkey (Macaca fascicularis). J Comp Neurol. 230: 465–496.
Andersen SM, Rapcsak SZ, Beeson PM. 2010. Cost function masking during normalization of brains with focal lesions: still a necessity? NeuroImage. 53:78–84.
Anderson V, Spencer-Smith M, Wood A. 2011. Do children really recover better? Neurobehavioural plasticity after early brain insult. Brain. 134:2197–2221.
Andreotti J, Jann K, Melie-Garcia L, Giezendanner S, Abela E, Wiest R, Dierks T, Federspiel A. 2014. Validation of network communicability metrics for the analysis of brain structural networks. PLoS One. 9:e115503.
Antoniadis EA, Winslow JT, Davis M, Amaral DG. 2007. Role of the primate amygdala in fear-potentiated startle: effects of chronic lesions in the rhesus monkey. J Neurosci. 27: 7386–7396.
Antoniadis EA, Winslow JT, Davis M, Amaral DG. 2009. The nonhuman primate amygdala is necessary for the acquisi-tion but not the retenacquisi-tion of fear-potentiated startle. Biol Psychiatry. 65:241–248.
Avants BB, Tustison NJ, Song G, Cook PA, Klein A, Gee JC. 2011a. A reproducible evaluation of ANTs similarity metric per-formance in brain image registration. NeuroImage. 54: 2033–2044.
Avants BB, Tustison NJ, Wu J, Cook PA, Gee JC. 2011b. An open source multivariate framework for n-tissue segmentation with evaluation on public data. Neuroinformatics. 9: 381–400.
Avants BB, Yushkevich P, Pluta J, Minkoff D, Korczykowski M, Detre J, Gee JC. 2010. The optimal template effect in hippo-campus studies of diseased populations. NeuroImage. 49: 2457–2466.
Bassett DS, Bullmore ET. 2009. Human brain networks in health and disease. Curr Opin Neurol. 22:340–347.
Bauman MD, Lavenex P, Mason WA, Capitanio JP, Amaral DG. 2004. The development of mother-infant interactions after neonatal amygdala lesions in rhesus monkeys. J Neurosci. 24:711–721.
Bauman MD, Toscano JE, Mason WA, Lavenex P, Amaral DG. 2006. The expression of social dominance following neo-natal lesions of the amygdala or hippocampus in rhesus monkeys (Macaca mulatta). Behav Neurosci. 120:749–760. Becker B, Mihov Y, Scheele D, Kendrick KM, Feinstein JS,
Matusch A, Aydin M, Reich H, Urbach H, Oros-Peusquens AM, et al. 2012. Fear processing and social networking in the absence of a functional amygdala. Biol Psychiatry. 72:70–77. Behrens TE, Berg HJ, Jbabdi S, Rushworth MF, Woolrich MW.
2007. Probabilistic diffusion tractography with multiplefibre
orientations: What can we gain? NeuroImage. 34:144–155. Behrens TE, Woolrich MW, Jenkinson M, Johansen-Berg H,
Nunes RG, Clare S, Matthews PM, Brady JM, Smith SM. 2003. Characterization and propagation of uncertainty in diffusion-weighted MR imaging. Magn Reson Med. 50:1077–1088. Bezgin G, Vakorin VA, van Opstal AJ, McIntosh AR, Bakker R.
2012. Hundreds of brain maps in one atlas: registering coordinate-independent primate neuro-anatomical data to a standard brain. NeuroImage. 62:67–76.
Bickart KC, Dickerson BC, Barrett LF. 2014. The amygdala as a hub in brain networks that support social life. Neuropsychologia. 63: 235–248.
Bliss-Moreau E, Bauman MD, Amaral DG. 2011. Neonatal amyg-dala lesions result in globally blunted affect in adult rhesus macaques. Behav Neurosci. 125:848–858.
Bliss-Moreau E, Moadab G, Amaral DG. 2016. Lifetime conse-quences of early amygdala damage in rhesus monkeys. In: Amaral DG, Adolphs R, editors. Living without an amygdala. New York: The Guilford Press.
Bliss-Moreau E, Moadab G, Bauman MD, Amaral DG. 2013. The impact of early amygdala damage on juvenile rhesus macaque social behavior. J Cogn Neurosci. 25:2124–2140. Boes AD, Mehta S, Rudrauf D, Van Der Plas E, Grabowski T,
Adolphs R, Nopoulos P. 2012. Changes in cortical
morphology resulting from long-term amygdala damage. Soc Cogn Affect Neurosci. 7:588–595.
Calabrese E, Badea A, Cofer G, Qi Y, Johnson GA. 2015. A diffu-sion MRI tractography connectome of the mouse brain and comparison with neuronal tracer data. Cereb Cortex. 25: 4628–4637.
Carmichael ST. 2006. Cellular and molecular mechanisms of neural repair after stroke: making waves. Ann Neurol. 59: 735–742.
Carmichael ST, Price JL. 1995. Limbic connections of the orbital and medial prefrontal cortex in macaque monkeys. J Comp Neurol. 363:615–641.
Ceko M, Seminowicz DA, Bushnell MC, Olausson HW. 2013. Anatomical and functional enhancements of the insula
after loss of large primary somatosensory fibers. Cereb
Cortex. 23:2017–2024.
Chu CJ, Tanaka N, Diaz J, Edlow BL, Wu O, Hamalainen M, Stufflebeam S, Cash SS, Kramer MA. 2015. EEG functional connectivity is partially predicted by underlying white mat-ter connectivity. NeuroImage. 108:23–33.
Crofts JJ, Higham DJ. 2009. A weighted communicability meas-ure applied to complex brain networks. J R Soc Interface. 6: 411–414.
Crofts JJ, Higham DJ, Bosnell R, Jbabdi S, Matthews PM, Behrens TE, Johansen-Berg H. 2011. Network analysis detects changes in the contralesional hemisphere following stroke. NeuroImage. 54:161–169.
Dancause N, Barbay S, Frost SB, Plautz EJ, Chen D, Zoubina EV, Stowe AM, Nudo RJ. 2005. Extensive cortical rewiring after brain injury. J Neurosci. 25:10167–10179.
Dancause N, Nudo RJ. 2011. Shaping plasticity to enhance recovery after injury. Prog Brain Res. 192:273–295.
de Reus MA, van den Heuvel MP. 2014. Simulated rich club lesioning in brain networks: a scaffold for communication and integration? Front Hum Neurosci. 8:647.
Demeter S, Rosene DL, Van Hoesen GW. 1990. Fields of origin and pathways of the interhemispheric commissures in the temporal lobe of macaques. J Comp Neurol. 302:29–53. Donahue CJ, Sotiropoulos SN, Jbabdi S, Hernandez-Fernandez M,
Behrens TE, Dyrby TB, Coalson T, Kennedy H, Knoblauch K, Van Essen DC, et al. 2016. Using diffusion tractography to predict cortical connection strength and distance: a quantita-tive comparison with tracers in the monkey. J Neurosci. 36: 6758–6770.
Duval J, Braun CM, Montour-Proulx I, Daigneault S, Rouleau I, Begin J. 2008. Brain lesions and IQ: recovery versus decline depends on age of onset. J Child Neurol. 23:663–668. Estrada E, Hatano N. 2008. Communicability in complex
net-works. Phys Rev E Stat Nonlin Soft Matter Phys. 77:036111. Fornito A, Zalesky A, Breakspear M. 2015. The connectomics of
brain disorders. Nat Rev Neurosci. 16:159–172.
Freese JL, Amaral DG. 2005. The organization of projections from the amygdala to visual cortical areas TE and V1 in the macaque monkey. J Comp Neurol. 486:295–317.
Gauthier LV, Taub E, Perkins C, Ortmann M, Mark VW, Uswatte G. 2008. Remodeling the brain: plastic structural brain changes produced by different motor therapies after stroke. Stroke. 39: 1520–1525.
Goldman PS, Galkin TW. 1978. Prenatal removal of frontal asso-ciation cortex in fetal rhesus-monkey—anatomical and functional consequences in postnatal life. Brain Res. 152: 451–485.
Goni J, van den Heuvel MP, Avena-Koenigsberger A,
Velez de Mendizabal N, Betzel RF, Griffa A, Hagmann P,
Corominas-Murtra B, Thiran JP, Sporns O. 2014. Resting-brain functional connectivity predicted by analytic measures of net-work communication. Proc Natl Acad Sci USA. 111:833–838. Goulas A, Bastiani M, Bezgin G, Uylings HBM, Roebroeck A,
Stiers P. 2014. Comparative analysis of the macroscale struc-tural connectivity in the macaque and human brain. PLoS Comp Biol. 10:e1003529.
Grayson DS, Bliss-Moreau E, Machado CJ, Bennett J, Shen K, Grant KA, Fair DA, Amaral DG. 2016. The rhesus monkey connectome predicts disrupted functional networks result-ing from pharmacogenetic inactivation of the amygdala. Neuron. 91:453–466.
Grayson DS, Ray S, Carpenter S, Iyer S, Dias TGC, Stevens C, Nigg JT, Fair DA. 2014. Structural and functional rich club organization of the brain in children and adults. PloS One. 9: e88297.
Harriger L, van den Heuvel MP, Sporns O. 2012. Rich club organ-ization of macaque cerebral cortex and its role in network communication. PLoS One. 7:e46497.
Henderson LA, Gustin SM, Macey PM, Wrigley PJ, Siddall PJ. 2011. Functional reorganization of the brain in humans fol-lowing spinal cord injury: evidence for underlying changes in cortical anatomy. J Neurosci. 31:2630–2637.
Herbin M, Boire D, Theoret H, Ptito M. 1999. Transneuronal degeneration of retinal ganglion cells in early hemispherec-tomized monkeys. Neuroreport. 10:1447–1452.
Hubel DH, Wiesel TN. 1970. The period of susceptibility to the physiological effects of unilateral eye closure in kittens. J Physiol. 206:419–436.
Jones EG, Weiss L. 1983. The structural basis of neurobiology. New York: Elsevier.
Jones TA, Schallert T. 1994. Use-dependent growth of pyram-idal neurons after neocortical damage. J Neurosci. 14: 2140–2152.
Kazama AM, Heuer E, Davis M, Bachevalier J. 2012. Effects of neonatal amygdala lesions on fear learning, conditioned inhibition, and extinction in adult macaques. Behav Neurosci. 126:392–403.
Keller A, Arissian K, Asanuma H. 1990. Formation of new synapses in the cat motor cortex following lesions of the deep cerebellar nuclei. Exp Brain Res. 80:23–33.
Kennard MA. 1936. Age and other factors in motor recovery from precentral lesions in monkeys. Am J Physiol. 115:138–146. Kennard MA. 1942. Cortical reorganization of motor function—
studies on series of monkeys of various ages from infancy to maturity. Arch Neurol Psychiatry. 48:227–240.
Klingler J, Gloor P. 1960. The connections of the amygdala and of the anterior temporal cortex in the human brain. J Comp Neurol. 115:333–369.
Kolb B, Cioe J. 2000. Recovery from early cortical damage in rats, VIII. Earlier may be worse: behavioural dysfunction and
abnormal cerebral morphogenesis following perinatal
frontal cortical lesions in the rat. Neuropharmacology. 39: 756–764.
Kolb B, Gibb R. 2014. Searching for the principles of brain plasti-city and behavior. Cortex. 58:251–260.
Kolb B, Teskey GC. 2012. Age, experience, injury, and the chan-ging brain. Dev Psychobiol. 54:311–325.
Lavenex P, Lavenex PB, Amaral DG. 2007. Spatial relational learning persists following neonatal hippocampal lesions in macaque monkeys. Nat Neurosci. 10:234–239.
Lavenex PB, Amaral DG, Lavenex P. 2006. Hippocampal lesion prevents spatial relational learning in adult macaque mon-keys. J Neurosci. 26:4546–4558.
Lepore N, Voss P, Lepore F, Chou YY, Fortin M, Gougoux F, Lee AD, Brun C, Lassonde M, Madsen SK, et al. 2010. Brain struc-ture changes visualized in early- and late-onset blind sub-jects. NeuroImage. 49:134–140.
Markham JA, Greenough WT. 2004. Experience-driven brain plasticity: beyond the synapse. Neuron Glia Biol. 1:351–363. Miši´c B, Sporns O, McIntosh AR. 2014. Communication
effi-ciency and congestion of signal traffic in large-scale brain networks. PLoS Comp Biol. 10:e1003427.
Moadab G, Bliss-Moreau E, Amaral DG. 2015. Adult social behavior with familiar partners following neonatal amyg-dala or hippocampus damage. Behav Neurosci. 129:339–350.
Nauta WJH, Ebbesson SOE. 1970. National Institute of
Neurological Diseases and Stroke., Puerto Rico University. In: Contemporary research methods in neuroanatomy. New York: Springer-Verlag.
Pandya DN, Van Hoesen GW, Mesulam MM. 1981. Efferent con-nections of the cingulate gyrus in the rhesus monkey. Exp Brain Res. 42:319–330.
Pinching AJ, Powell TP. 1971. Ultrastructural features of trans-neuronal cell degeneration in the olfactory system. J Cell Sci. 8:253–287.
Raper J, Wilson M, Sanchez M, Machado CJ, Bachevalier J. 2013. Pervasive alterations of emotional and neuroendocrine responses to an acute stressor after neonatal amygdala lesions in rhesus monkeys. Psychoneuroendocrinology. 38: 1021–1035.
Reveley C, Seth AK, Pierpaoli C, Silva AC, Yu D, Saunders RC, Leopold DA, Ye FQ. 2015. Superficial white matter fiber sys-tems impede detection of long-range cortical connections in diffusion MR tractography. Proc Natl Acad Sci USA. 112: E2820–E2828.
Ripolles P, Marco-Pallares J, de Diego-Balaguer R, Miro J, Falip M, Juncadella M, Rubio F, Rodriguez-Fornells A. 2012. Analysis of automated methods for spatial normalization of lesioned brains. NeuroImage. 60:1296–1306.
Rohlfing T, Kroenke CD, Sullivan EV, Dubach MF, Bowden DM, Grant KA, Pfefferbaum A. 2012. The INIA19 template and NeuroMaps Atlas for primate brain image parcellation and spatial normalization. Front Neuroinform. 6:27.
Roy AK, Shehzad Z, Margulies DS, Kelly AM, Uddin LQ, Gotimer K, Biswal BB, Castellanos FX, Milham MP. 2009. Functional connectivity of the human amygdala using resting state fMRI. NeuroImage. 45:614–626.
Rubinov M, Sporns O. 2010. Complex network measures of brain connectivity: uses and interpretations. NeuroImage. 52:1059–1069.
Saleem KS, Logothetis N. 2007. A combined MRI and histology atlas of the rhesus monkey brain in stereotaxic coordinates. London; Burlington, MA: Academic.
Schaechter JD, Moore CI, Connell BD, Rosen BR, Dijkhuizen RM. 2006. Structural and functional plasticity in the somatosen-sory cortex of chronic stroke patients. Brain. 129:2722–2733.
Scott JA, Grayson D, Fletcher E, Lee A, Bauman MD, Schumann CM, Buonocore MH, Amaral DG. 2016. Longitudinal analysis of the developing rhesus monkey brain using magnetic res-onance imaging: birth to adulthood. Brain Struct Funct. 21: 2847–2871.
Shen K, Bezgin G, Hutchison RM, Gati JS, Menon RS, Everling S, McIntosh AR. 2012. Information processing architecture of functionally defined clusters in the macaque cortex. J Neurosci. 32:17465–17476.
Stefanacci L, Amaral DG. 2000. Topographic organization of cor-tical inputs to the lateral nucleus of the macaque monkey amygdala: a retrograde tracing study. J Comp Neurol. 421: 52–79.
Stefanacci L, Amaral DG. 2002. Some observations on cortical inputs to the macaque monkey amygdala: an anterograde tracing study. J Comp Neurol. 451:301–323.
Styner M, Knickmeyer R, Joshi SC, Coe C, Short SJ, Gilmore J. 2007. Automatic brain segmentation in rhesus monkeys. Proc SPIE. 6512:65122L–65128.
Thomas C, Ye FQ, Irfanoglu MO, Modi P, Saleem KS, Leopold DA, Pierpaoli C. 2014. Anatomical accuracy of brain connections derived from diffusion MRI tractogra-phy is inherently limited. Proc Natl Acad Sci USA. 111: 16574–16579.
Tustison NJ, Avants BB, Cook PA, Zheng Y, Egan A, Yushkevich PA, Gee JC. 2010. N4ITK: improved N3 bias correction. IEEE Trans Med Imaging. 29:1310–1320.
Vargha-Khadem F, Gadian DG, Watkins KE, Connelly A, Van Paesschen W, Mishkin M. 1997. Differential effects of early hippocampal pathology on episodic and semantic memory. Science. 277:376–380.
Vargha-Khadem F, Isaacs E, Muter V. 1994. A review of cogni-tive outcome after unilateral lesions sustained during child-hood. J Child Neurol. 9(Suppl 2):67–73.
Vogt BA. 2005. Pain and emotion interactions in subregions of the cingulate gyrus. Nat Rev Neurosci. 6:533–544.
Vogt BA, Pandya DN. 1987. Cingulate cortex of the rhesus mon-key: II. Cortical afferents. J Comp Neurol. 262:271–289. Vogt BA, Vogt L, Farber NB, Bush G. 2005. Architecture and
neu-rocytology of monkey cingulate gyrus. J Comp Neurol. 485: 218–239.
Wieloch T, Nikolich K. 2006. Mechanisms of neural plasticity following brain injury. Curr Opin Neurobiol. 16:258–264. Zaitsev M, Hennig J, Speck O. 2004. Point spread function
map-ping with parallel imaging techniques and high acceleration
factors: fast, robust, and flexible method for echo-planar
imaging distortion correction. Magn Reson Med. 52:
1156–1166.
Zalesky A, Fornito A, Bullmore ET. 2010. Network-based statis-tic: identifying differences in brain networks. NeuroImage. 53:1197–1207.
Zasler ND, Katz DI, Zafonte RD. 2013. Brain injury medicine: principles and practice. New York, NY: Demos Medical Pub.

![Figure 4. No significant differences between lesioned and con- con-trol animals were found in terms of total intracranial or tissue volumes, despite a trend towards lower subcortical gray matter in the lesioned animals (t[12] = 1.99, P = 0.075, Cohen’s d =](https://thumb-eu.123doks.com/thumbv2/123doknet/14935929.665814/6.892.205.678.115.688/figure-significant-differences-lesioned-animals-intracranial-subcortical-lesioned.webp)