Imaging of Vascular Smooth Muscle Cells with Soft X-Ray
Spectromicroscopy
Julia Sedlmair,1,* Sophie-Charlotte Gleber,2 Semra Öztürk Mert,3Michael Bertilson,4
Olov von Hofsten,4Jürgen Thieme,5 and Thomas Pfohl3,6
1Institute for X-Ray Physics, Georg-August-University Göttingen, Friedrich-Hund-Pl. 1, D-37077 Göttingen, Germany 2Argonne National Laboratory, APS, 9700 S. Cass Avenue, Building 401, Argonne, IL 60439-4837, USA
3Max-Planck-Institute for Dynamics and Self-Organization, Bunsenstr. 10, D-37073, Göttingen, Germany 4Biomedical and X-Ray Physics, Department of Applied Physics, Royal Institute of Technology, AlbaNova,
SE-106 91 Stockholm, Sweden
5Brookhaven National Laboratory, NSLS II, Building 817, Upton, NY 11973, USA
6Department of Chemistry, University of Basel, Klingelbergstr. 80, CH-4056, Basel, Switzerland
Abstract: Using X-ray microscopy and spectromicroscopy, vascular smooth muscle cells ~VSMCs! were imaged, prepared without using additional embedding material or staining, but by applying simple, noncryo fixation techniques. The cells were imaged with a compact source transmission X-ray microscope and a scanning transmission X-ray microscope ~STXM!. With the STXM, spectromicroscopy was performed at the C K-edge and the Ca LIII,II-edges. VSMCs were chosen because of their high amount of actin stress fibers, so that the actin cytoskeleton should be visible. Other parts of the cell, such as the nucleus and organelles, were also identified from the micrographs. Both in the spectra and the images, the effects of the different preparation procedures were observable. Furthermore, Ca hotspots were detected and their density is determined.
Key words: X-ray microscopy, vascular smooth muscle cells, spectromicroscopy, NEXAFS, calcium, radiation damage
I
NTR ODUCTIONMicroscopic investigations of cells face the challenge of how much the samples are altered in the preparation procedure to obtain an exact image of the cells in their natural state. Regarding solely imaging methods, complementary tech-niques are used. Standard fluorescence and light microscopy reaches its resolution limit at about 200 nm as stated by Abbé ~d⫽ l/~2n sin a!!. A way to achieve a higher resolu-tion is the applicaresolu-tion of STED microscopy ~stimulated emission depletion; Egner & Hell, 2005; Willig et al., 2006!, STORM ~stochastic optical reconstruction microscopy; Huang et al., 2008, 2009!, or PALM ~photoactivated local-ization microscopy; Betzig et al., 2006; Rust et al., 2006!. The advantage of these methods is that the samples are still alive, but certain molecules have to be marked with photo-switchable fluorescent dyes. Detecting the fluorescent signal, resolutions down to 10–20 nm have been shown. However, this is not the natural state of the cells, and furthermore, only the stained parts of the cells can be seen, whereas the rest has to be imaged using other techniques, often involv-ing lower resolution and more preparation of the cells.
Electron microscopy has developed to be one of the primary imaging techniques ~Resch et al., 2002; Small et al., 2008; Studer et al., 2008!. The low natural contrast and the small penetration depth of electrons require the cells to be fixed and cut into small sections of less than 0.5 mm. Before slicing, the cells have to be embedded, a process that might
have a significant impact on the cellular structure ~McDer-mott et al., 2009!.
Using X-ray microscopy, no staining of the samples is needed because natural contrast results from the absorption coefficient, which depends directly on the elemental compo-sition and thickness variations in a sample ~Yamamoto et al., 1998; Meyer-Ilse et al., 2001!. Additionally, the chem-ical state analysis of low Z elements is hard to access with electron microprobes. The spectral range between the K-shell absorption edges of C ~4.36 nm ⫽^ 284.2 eV! and O ~2.28 nm⫽^ 543.1 eV! is called the “water window.” In this spectral region water absorbs much less than organic speci-mens ~Kirz et al., 2009!, i.e., cells can be imaged in water layers of up to 10 mm diameter. This also enables tomo-graphic studies of cells ~Larabell & Le Gros, 2004; Parkinson et al., 2008; McDermott et al., 2009; Schneider et al., 2010!. Currently, the best resolution achieved with X-ray micro-scopes is 12 nm ~Chao et al., 2009!. Because of the high radiation dose, however, the samples for tomography also need to be chemically or cryogenically fixed ~Beetz & Jacob-sen, 2003!.
In addition to yielding clear images, X-rays also provide the possibility to gain chemical information of a sample using near edge X-ray absorption fine structure ~NEXAFS! spectroscopy ~see the Spectromicroscopy section!. For in-stance, the calcification of cells ~Benzerara et al., 2004! or their ability to process sulfur ~Norlund et al., 2009! can be studied. X-ray spectromicroscopy has already been applied to study different cells ~Benzerara et al., 2004; Fleet & Liu, 2009; McDermott et al., 2009!, and to gain information
Received April 7, 2011; accepted July 30, 2011 *Corresponding author. E-mail: [email protected]
M
icroscopy
M
icroanalysis
about the chemical bindings in environmental samples or polymers ~Smith et al., 2001; Hitchcock et al., 2005; Mitrea et al., 2008; Solomon et al., 2009; Thieme et al., 2010!. Fixing preparation techniques for such samples are often avoided to prevent chemical changes and to enable simple handling. The basic principle of this technique, which was applied to some of the cell samples, is described in more detail in the Materials and Methods section.
In the following section, the effect of the preparation process on cell samples is investigated. Vascular smooth muscle cells ~VSMCs! were selected because of their high amount of actin, a basic protein of the cytoskeleton. VSMCs are the major part of blood vessel walls, regulating the blood pressure by alternating contraction and relaxation. Vessel diseases such as atherosclerosis develop if these cells proliferate ~hypertrophy and/or hyperplasia!. Often, these changes of the cells are also observed in the phenotype. Imaging of VSMCs is often achieved by applying light microscopy and electron microscopy, for which the cells are fixed and cut into thin slices ~Thyberg, 2000!. Here, the cells are studied at the C K-edge and Ca LII,III-edges, to find out
which parts of the cells are discernible from their structure and to gain insights from additional spectroscopic informa-tion. A feasible sample thickness at the C- and Ca-edges is in the range of a few micrometers. Because the VSMCs are comparably thin, it is possible to work with energies at the Ca LIII,II-edges in absorption, without depending on much
more elaborate fluorescence yield experiments at higher energies.
Starting with fixed, dried, and fluorescence marked cells, we continued with fixed cells in an aqueous environ-ment. To perform imaging-only studies and to prove that high-resolution micrographs of cells are also feasible with small X-ray sources, we also used the compact transmission X-ray microscope ~TXM! developed by the H. Hertz group at the KTH in Stockholm ~Berglund et al., 2000; Takman et al., 2007; Bertilson et al., 2009!. Thereafter, dry but unfixed cells were investigated, and the last step involved living cells kept in a medium between two Si3N4-membranes.
Both high-resolution imaging and spectromicroscopic stud-ies involve high-radiation doses. This issue is discussed in the Radiation Damage section.
M
ATERIALS ANDM
ETHODSSample Preparation
VSMCs, purchased from Coriell Institute of Medical Re-search ~Camden, NJ, USA!, were grown on Si3N4-membranes
~frame: 5 ⫻ 5 mm2, thickness 200 mm, window: 1.5 ⫻
1.5 mm2, thickness 100 nm, from Silson Ltd.,
Northhamp-ton, UK! and treated further depending on the planned experiment.
For an improved adhesion of the cells, the Si3N4
-membranes were coated with collagen ~conc. 1 mg/mL! for 10 min and afterward rinsed with ultrapure water ~MilliQ!. The cells, cultivated in a tissue culture dish, were dissociated with trypsin ~Invitrogen GmbH, Karlsruhe, Germany!, pi-petted into a Falcon tube, and spun down ~800 rpm, 10 min!. After removing the supernatant, the pellet was resuspended in medium, and the cells were spread over the Si3N4-membranes in a tissue culture dish, filled with
me-dium ~90% low glucose DMEM, 9% fetal calf serum, 1% penicillin-streptomycin, all from Invitrogen!. The cells were incubated for 1 day ~378C, 5% CO2!. In Figure 1 the
preparation of the different cell samples is illustrated.
Immobilization of VSMCs
The preparation of the dried and aqueous fixed samples is essentially the same apart from the drying ~see steps I and II in Fig. 1!. For the fixation, the medium was removed from the Si3N4-membranes and paraformaldehyde ~4% PFA,
0.06% 1M NaOH in PBS! was filled into the culture dishes, and left there for about 15 min on ice. After removing the PFA solution, the VSMCs on the membranes were rinsed with ultrapure water a few times and put into Eppendorf vessels, containing ultrapure water, for transport. For the X-ray experiments the Si3N4-membranes were taken out of
the vessel and either left in air to dry or covered with a second Si3N4-membrane and sealed with glue, forming a
wet chamber.
For staining, the membranes with the fixed cells were washed and put into a solution of 0.5% Triton-100 ~in PBS! at room temperature for 10–20 min. The labels rhodamine phalloidin ~for the actin filaments, 2.5%! and DAPI ~for the nucleus, ;0.25%! were dissolved in 1% BSA solution and Figure 1. Sketch of the preparation procedures. The drawings show a cell adhered to a Si3N4-membrane in a petri dish and the further preparations to ~I! dried and fixed, ~II! aqueous and fixed, ~III! dried and unfixed, and ~IV! unfixed and living cell samples.
the cells were left in the solution for 1 h at room tempera-ture. Then the Si3N4-membranes were washed and later
stored in ultrapure water. The fluorescent images were re-corded with an Olympus BX51 microscope, using a 40⫻ objective. The subsequent preparation at the X-ray micro-scope was the same as for the fixed cells without dyes.
VSMCs Transported Alive
For the experiments with unfixed cells, the culture medium was replaced by a CO2-independent medium ~Invitrogen!.
That way, the cells were cultivated for use outside the biolaboratory at the beamline of the storage ring. There was no difference in appearance whether the cells were only transported in the new medium or if they had already grown in it.
For the experiments with dry unfixed cells, the Si3N4
-membranes were taken out of the medium, rinsed with ultrapure water, and allowed to dry before they were glued to an aluminum shim and mounted into the X-ray micro-scope ~Fig. 1, step III!.
Samples of living cells were prepared by taking out a Si3N4-membrane of the CO2-independent medium,
care-fully drying it on the bottom side and gluing it to an aluminum shim. A second Si3N4-membrane was placed and
glued on top forming a wet chamber ~Fig. 1, step IV!, as described in the preparation of the aqueous fixed cells.
Spectromicroscopy
The transmitted intensity I of X-ray photons ~with incident intensity I0!passing through a sample is described via the
Lambert-Beer law, I ⫽ I0e⫺md, with the aforementioned
absorption coefficient m and sample thickness d. m depends on the wavelength and thus the energy of the incoming photons.a At certain energies, core electrons from inner
shells are excited and a jump in the absorption occurs. Around this absorption edge, some of the electrons are excited to higher unoccupied atomic or molecular orbitals, resulting in modulations in the measured absorption spec-trum and thereby providing information about the chemi-cal elements and the binding forms within a sample. This technique is called NEXAFS spectroscopy and explicitly explained in Stöhr ~1992!.
The combination of spatial and spectral information is X-ray spectromicroscopy. A stack of images is recorded using small energy increments ascending over an absorp-tion edge. After alignment of the images, each pixel of the image contains a NEXAFS spectrum of that sample spot.
Instrumentation
Compact Source Microscope at KTH Stockholm
A detailed description of the compact transmission X-ray microscope ~cTXM! in Stockholm is found in Takman et al.
~2007! and Bertilson et al. ~2009!. A laser is focused onto a jet of methanol, generating a plasma that emits line radia-tion at 368 eV; hence, stacks or spectra cannot be recorded. In the microscope, the radiation is focused directly onto the sample by a condenser, and the objective zone plate ~spatial resolution here ;30 nm! is situated between sample and charge-coupled device ~CCD! detector, creating an enlarged image. The exposure times were in the range of several minutes.
Scanning Transmission X-Ray Microscope at BESSY II
Scanning transmission X-ray microscopy in combination with NEXAFS spectroscopy was performed at the electron storage ring BESSY II in Berlin ~highest achievable spatial resolution ;50 nm per pixel!. The setup of the instrument is described in detail in Wiesemann ~2003! and Wiesemann et al. ~2001!. The sample was mounted onto a scanning stage, then prefocused and aligned via a built-in visible-light microscope. In the scanning transmission X-ray micro-scope ~STXM!, the X-rays are focused via a zone plate and an order sorting aperture to a spot that is raster-scanned over the sample. A CCD detector recorded the transmitted intensity of the incident beam passing through the speci-men. To obtain spectroscopic data of the bound carbon and calcium in the samples, stacks of images were recorded, tuning the energy with a focused spherical grating mono-chromator ~Guttmann et al., 2007! around the C K-edge ~280–300 eV! and the Ca LII,III-edges ~342–357 eV!, with a
stepsize of 0.2 eV. Being a chromatic optical element, the zone plate was repositioned for every energy step. The dwell times per pixel for the images were between 2–6 ms.
Analysis
The evaluation of the X-ray data consisted of three comple-mentary parts: For the visual information of the high-resolution images, which also allowed for comparison of the samples before and after taking stacks, ImageJ was used. The image stacks were processed using “stack_analyze,” a program written by Chris Jacobsen ~Jacobsen et al., 2000; Lerotic et al., 2004!. The images of a single stack were aligned and spectra were extracted. The spectra were used to estimate the radiation dose ~Beetz & Jacobsen, 2003!. A linear pre-edge background was subtracted from each spec-trum, defining the zero line, and the spectra were smoothed using a sliding box algorithm with a width of two points. The spectra of the C K-edge were normalized by setting the highest data point to 1. The spectra from the stacks were evaluated using published NEXAFS data from polymer and cell science ~Bertsch & Hunter, 2001; Lawrence et al., 2003; Benzerara et al., 2004; Neu et al., 2010!.
R
ESULTS ANDD
ISCUSSIONImaging
Electromicroscopic images and images from other cells, e.g., fibroblasts, were used for comparison and to discern cell organelles and ultrastructure ~Yamamoto et al., 1998; Thy-aFrom here, the radiation will be described by energies, instead of the
wavelengths. The conversion formula is l ~nm!⫽ hc/eE ~eV!, with l the wavelength in nm, h Planck’s constant, c the speed of light, e the elemen-tary charge, and E the energy in eV.
berg, 2000; Meyer-Ilse et al., 2001; Greco et al., 2006; Schneider et al., 2010!, due to the lack of comparable X-ray spectromicroscopy studies on VSMCs.
Fixed Cells
First, experiments with dried and fixed cells were carried out using the compact TXM at Stockholm, testing whether stress fibers, recognizable from fluorescent images, can also be observed in X-ray micrographs ~Fig. 2!. The fluorescent image in the inset of Figure 2a has been magnified, turned into a half-tone, and used as the “grid” of the collage. The stress fibers and the nucleus with one nucleolus are clearly visible. In particular, in the round X-ray micrograph in the lower right, the finer actin fibers of the cytoskeleton are discernible. It is, however, hard to distinguish other objects, apart from what might be mitochondria ~arrow!.
In Figure 2b, a composition of STXM images taken at BESSY II is shown, again with an inset of the fluorescent image. Comparing fluorescent and X-ray images, the thicker actin bundles are identified. In the X-ray images, smaller features and more parts of the cytoskeleton are also discern-ible. Since they are not visible in the fluorescent image, they are not part of the actin network. The black granules, about 300 nm in size, might be lysosomes or endosomes ~Yama-moto et al., 1998!. Mitochondria, having a slightly more absorbing membrane, are indicated by white arrows. In the nucleus, several nucleoli are visible. Left of the nucleus, a
“holey” structure is observed that could be the remainder of a Golgi apparatus, often found close to nuclei.
In the third dry and fixed cell ~Fig. 2c!, the lamellipo-dium was imaged with higher resolution than the rest. The nucleus, nucleoli, and black granules are visible in the central cell part. The holey, less absorbing structure around the nucleus is more prominent here. The image demon-strates that possible differences between fluorescent marked and unmarked cells, stemming from the fluorescent mark-ing procedure, are not visible in the structure of the X-ray images of the cells.
To find out how the contrast of the fixed cell changes in water and to restore eventual collapsed structures and wrin-kles originating from the drying process, the experiments were repeated with fixed cells in an aqueous environment ~see Fig. 3!. A collage of images covering of a whole fixed cell in aqueous environment is depicted in Figure 3a. A 5⫻ zoom of the section marked with a box is shown in Fig-ure 3b. The sample thickness was estimated to be about 4 mm. Although the absorption of the water is only 10% of the absorption of the organic sample material, the contrast is less sharp than in the dry cell samples, which complicates the recognition of inner cell organelles like mitochondria. Small but dense clusters, assumedly lysosomes, are visible. Apart from that, nucleoli are hardly observable, perhaps due to the fact of not having their own membrane. From comparison with the fluorescent marked cell, the structures Figure 2. Collages of images of fixed and dried cells, the insets
show the fluorescent images ~FLUO!. ~a! The X-ray image was recorded with the cTXM ~pixel size 30 nm at 368 eV!; ~b, c! the images were taken with the STXM at 300 eV with a smallest pixel size of 100 nm.
Figure 3. Collages of images from a fixed cell in water, with pixel sizes ranging from 50 to 250 nm, recorded at 300 eV. ~a! Images are depicted of a fixed and fluorescent marked cell, with the fluores-cent image in the inset; ~b! image shows a smaller area of the cell, but with an additional 5⫻ zoom.
observable in the nucleus area seem to be outside and on top or below the nucleus and part of the actin network and the cytoskeleton. The area around the nucleus has a struc-ture, different from the parts of the cell that are closer to the border. Close to the nucleus, the cell exhibits a holey struc-ture, as also observed in Figure 2a,b, where less photons are absorbed. In this part of the cell, the endoplasmic reticulum and Golgi apparatus could be located, which are found close to or around the nucleous in cells. The outer parts of the cells exhibit a smooth structure, with thick stress fibers and also very dense and actin rich parts, as can be proved from the inset in Figure 3a. Especially in the parts of the collage with the highest resolution ~pixel size of 50 nm!, thicker and thinner parts are very distinct.
Cells without Fixation
Unfixed but dried cells were imaged to have specimens to compare with the originally living cells. Cellular network and organelles certainly look different after the cell has dried, but in contrast to the fixed cells, nothing of the cell material gets washed away. Although the cell has partly disintegrated during the drying process, the nucleus is still visible in Figure 4. Bearing in mind that nucleoli are not membrane-bound structures but are distinguished by their function, it is not surprising that they are not as easily recognized as in the experiments with the fixed and dried VSMCs. However, some X-ray dense spots are located in the nucleus, which could be nucleoli. Besides, a region with holes can be seen around the nucleus as well as the lamelli-podium ~white arrow! and even some small tethers ~black
arrow!. Since it was not expected to resolve any fine struc-tures in the dried VSMCs, the smallest pixel size in Figure 4 has been set to only 120 nm.
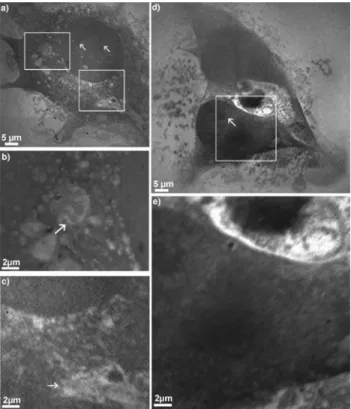
For the experiments with the living VSMCs, extreme care was taken that the cells did not dry out. That means a cell was alive until the first X-ray image was recorded. The collages of X-ray micrographs of initially living cells in CO2-independent medium are shown in Figure 5. The first
cell ~Fig. 5a–c! grew completely in the medium, while the two just separating cells ~Fig. 5d,e! were grown in normal medium and then transferred to CO2-independent
me-dium. In Figure 5a, structures in the nucleus absorbing slightly more than the rest of it are noticeable, which could be nucleoli ~small arrows!. In the region marked with the upper box in Figure 5a and magnified in Figure 5b, presum-ably a mitochondrion ~arrow! and some endosomes ~dark spots! are visible. In this cell, the region around the nucleus also exhibits the less absorbing and holey structure as seen in Figure 3, indicating the endoplasmic reticulum or a Golgi apparatus; this can be seen in more detail in Figure 5c, the magnified image of the lower box in Figure 5a. The out-stretched parts of the cell again display smoother tissue indicating actin fibers, as seen in Figure 3.
The two separating cells in Figures 5d and 5e seem to be thicker, making internal structures harder to identify due Figure 4. Collage of images of a nonfixed dried cell, recorded with
the STXM at 300 eV, with a smallest pixel size of 120 nm; the inset shows the light microscope image.
Figure 5. Collages of X-ray micrographs of initially living VSMCs in CO2-independent medium, with a smallest pixel size of 50 nm, recorded at 300 eV. ~a! A cell grown in this medium; magnification of cell parts showing, what is supposedly ~b! a mitochondrion and ~c! part of the endoplasmic reticulum. ~d! Two separating VSMCs, originally grown in regular medium, the left cell has been imaged with higher resolution; a magnification of the region around the nucleus is shown in image e.
to the much stronger absorption. The left cell was imaged with higher resolution and is also depicted enlarged in Figure 5e. The cells are not completely separated yet, and some of the tissue, which connects both cells, is noticeable between them and in the membrane of the left cell ~arrow in Fig. 5d!.
In all cell images, natural contrast makes it possible to distinguish larger cell organelles, the nucleus and areas rich in ~actin! fibers, if present. For aqueous samples, imaging is more difficult because of the additional absorption of the water, and a longer dwell time is necessary. It is not surprising that the contrast in the unfixed cells ~Figs. 4, 5! is not as sharp and the cytoskeleton is not as clearly visible as in case of the fixed cells ~Figs. 2, 3! because the immobiliza-tion procedure mainly preserves the cytoskeleton and most of the other cell material and cytoplasm is removed. This also applies to the area surrounding the cells. Whereas in case of the fixed cells, the borders of the cells are well de-fined, and the originally living cells exhibit a lot more tissue around them. Therefore, the experiments of the dry and fixed and the living cells yielded the most instructive images. In addition, the precision of Figure 2a demonstrates the ability of imaging delicate objects such as cells and tissue with a compact source. If only the microscopic information is of interest, using a microscope working with a laboratory X-ray source is feasible.
Spectromicroscopy
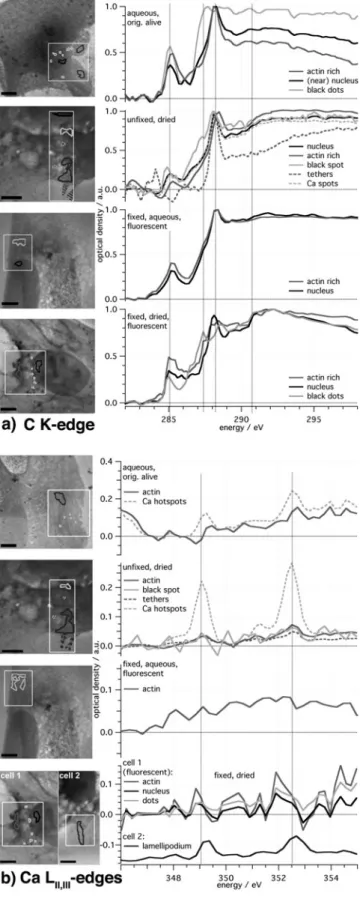
The results of the spectromicroscopic studies are shown in Figure 6. As regions of interest ~ROIs! in the cell samples, we chose areas with supposedly high actin content, the nucleus, and, if present, special or noticeable parts such as the black granules or localized spots of high Ca absorption, Ca hotspots, which were identified from the Ca spectra of the samples. These hotspots did not arise from the prepara-tion procedure because they were found in almost all cells. Their occurrence is limited to the cytoskeleton part of the cells. No hotspots were found close to the nuclei. If possible, the same regions of the samples were used for spectromicros-copy at the C K-edge and Ca LII,III-edges. At first, the spectra
at the C K-edge are discussed because the effect of the choice of the ROIs and the preparation method are better visible here. Spectra for polysaccharides, lipids, DNA, pro-teins ~albumin and fibrinogen as model!, and CaCO3from
the literature were used as reference spectra ~Lawrence et al., 2003; Benzerara et al., 2004; Hitchcock et al., 2009; Wang et al., 2009!. Data from other published NEXAFS experi-ments also supported the peak assignment, e.g., in Bâldea et al. ~2007! and Kolczewski et al. ~2006!. Peak positions of reference data are listed in Table 1.
C K-Shell Absorption Edge
The main features visible at the C K-edge are the peaks resulting from transitions to the following orbitals, pCC* at
285 eV ~aromatic rings!, pC*⫽C at 286 eV ~phenolic!, pC*⫽O
at 288.2 eV ~carbonyl!, and pC*⫽O at 289 eV ~carboxyl,
CaCO3!. For the Ca LII,III-edges only, the two peaks of the
Figure 6. NEXAFS spectra from distinct areas from the cells, prepared in the four described different ways: ~a! at the C K-edge ~280–300 eV, stepsize 0.2 eV! and ~b! at the Ca LIII,II-edges ~346– 355 eV, stepsize 0.2 eV!. The images all have a size of 30⫻ 30 mm2. The unfixed and dried respectively fixed, dried, and fluorescent marked cells, of which the spectra were recorded, are also depicted in Figures 2c and 4.
edges are of interest because the resulting spectra are too noisy to analyze any further features.
For the dry and fixed cells, the spectra of the nucleus, the actin rich part, and the black granules differ strongly at energies below 291 eV. The black spots exhibit the smallest peak at 285 eV but have two noticeable peaks at 287.5 and 288.5 eV. The spectrum shows features similar to reference spectra of lipids and proteins. The spectrum from the area in the nucleus has a prominent peak at 288.2 eV and, at least partly, combines characteristics of spectra of nucleic acid and polysaccharide. The spectrum of the actin rich area has the highest pC*⫽C peak but no strong resonance around
289 eV, which makes it harder to compare with the reference spectra, but a combination of the two spectra of the model proteins albumin and fibrinogen seems to be the best guess. The spectra of the fixed cell in aqueous environment do not show remarkable differences apart from the pC*⫽C peak at
285 eV being slightly higher for actin than for the nucleus region.
For the unfixed, dried cell, the spectrum of the nucleus area looks similar to the one of the fixed dry cell, but the part between 285 and 288.5 eV is different and appears more like the reference nucleic acid in Lawrence et al. ~2003!. The identified Ca hotspots interestingly have a C spectrum that is almost exactly like the spectrum of the nucleus region. In the spectrum of the black spot, several smaller peaks are found between 286 and 290 eV. A super-position of the reference spectra of lipid, saccharide, and protein might lead to a similar structure. The actin rich part has a signature similar to the spectra of the two model proteins. The tethers show a NEXAFS signature, which differs from the other spectra. There is no peak at 285 eV, but rather at 284 eV. This shift might be caused by the selection of I0 or results from transitions in unsaturated
carbohydrate chains ~Wang et al., 2009!. The rest of the spectrum resembles the reference spectrum of fibrinogen.
Regarding the ~initially! living cell, the spectrum of the nucleus area again has the smallest pC*⫽C peak, and
com-pared to the dried unfixed cell, the shoulder around 287 eV
is steeper, and there is no new rise at energies above 290 eV. The aromatic and the carbonyl ~288.2 eV! peaks from an originally living cell are higher than in the spectra of the unfixed but dried cell. Furthermore, the ratio pC*⫽C
/pC*⫽Oof
the area of high actin amount is higher in the living cell. In the spectral region of 290 eV, where the transitions 1s r sC*⫺C, sC*⫺Oare located, the dried cell shows more
absorp-tion than the living cell, again in comparison with the car-bonyl peak. This means that less aromatic rings and less C⫽O-double bonds are present in the unfixed and dried cell. A comparison of the C K-edge NEXAFS spectra dem-onstrates the influence of the preparation. For instance, in the dry state, different parts of the fixed cell exhibit different spectra, but in the wet state the sample has almost the same C K-edge signature for regions in the nucleus and regions rich in actin. The water seems to damp out smaller reso-nances. The most striking difference between the fixed and the unfixed VSMC samples is the comparably higher peak at 288.2 eV, where the resonances of the C⫽O carbonyl bonds in peptides are located, demonstrating that the fixing pro-cess preserves only the network structures, but not the chemical composition. In spite of differences between the reference and the recorded spectra, it was possible to iden-tify similar peaks and to draw conclusions about the molec-ular composition of the ROIs in the cell.
It should be noted that the reference spectra are re-corded from pristine substances. Furthermore, these sub-stances are not in their cellular environment and apart from that the preparation process additionally may also alter the shape of the spectra.
Ca LII,III-Shell Absorption Edges
It is well known from the literature that Ca is bound within the actin filaments of the cytoskeleton ~F-actin!. Some au-thors state that F-actin in cells is partly used to store Ca2⫹
~Lange & Gartzke, 2006!. Therefore, the intention was to identify actin bundles or actin rich areas due to the Ca signature—but the Ca signal was too uniform over the cell area. However, in the unfixed cells localized spots of very high Ca amount, so-called Ca hotspots, were detected. These Ca hotspots could be Ca sparks or buffs ~Parker et al., 1996; Janiak et al., 2001; Zenisek et al., 2003; Cheng & Lederer, 2008; McGeown, 2010! that have also been detected in cells before, but since the time dependence was not monitored, this is not specified in further details.
The height of the peaks is proportional to the Ca concentration within the ROIs. For the fixed and dried cells, this means that in the lamellipodium of cell 2, Ca is trace-able, but the spectra of cell 1 are very noisy and the Ca peaks are hardly visible, if present ~see last panel in Fig. 6b!. Apart from the difference in chosen ROIs, this could also be because cell 1 is fluorescence marked, whereas cell 2 is not, leaving out several steps of preparation.
No Ca was detected in the fixed cell in aqueous me-dium, which could stem from the dissolution of Ca2⫹in the surrounding water. In the unfixed dried cell, the Ca peaks are well discernible especially in the tethers, which proves Table 1. Energy Positions and Assignments of Features of the
Absorption Spectra of the C K-Edge and the Ca LII,III-Edges, Gained from the Areas in the Cells as Depicted in Figure 6. Position
~eV! Transition Comment
285.1 pC⫽C* Aromatic
286.0 pC⫽C* Phenolic and/or ketonic 287.1 sC⫺H* , 3s, p
C⫽C* C~ring! heterobound, OH groups 288.2 pC⫽O* Amide carbonyl groups ~peptide
bond in proteins!, ketonic 288.9 pC⫽O* Carboxylic groups in polysaccharides,
CaCO3 290.0 sC⫺X* X: N, P, F, . . . .291 sC⫺C* , s
C⫺O* Broad peaks ;349 Ca LIII-edge
that the detected Ca in the dried unfixed cell is not a remainder of the dried buffer. In the living cell the Ca signal is still perceivable, but much weaker than in the case of the dried cell; but again, Ca2⫹ is presumably dissolved in the medium. In both unfixed cells, small spots of high Ca concentrations were detected. Verification of Ca in the living cell proves that the Ca and the hotspots in the dried cell are not resulting from the dried medium.
From the spectra it is also possible to give a semiquan-titative estimation of the C and Ca concentration in the cells ~Buckley, 1995!. The density of carbon in the cells can be estimated using
rCtC⬇
oD300 eV⫺ oD280 eV
mcell,300 eV⫺ mcell,280 eV
~1!
with r the volume density and t the thickness of the sample. The optical density oD is the expression in the exponent of the Lambert-Beer law I⫽ I0e⫺oD describing the intensity I
transmitted through a sample, with incident intensity I0.
Standard values were used from CXRO ~2011! to approxi-mate mcellfor a cell of the composition 60% H, 24% O, 10%
C, and 2% N. For the cells, the values of the spectra of the whole cell area ~shown in Fig. 7d! were used, yielding values of rCtCin the range of 1⫺ 2.5 ⫻ 10⫺5g/cm3{cm. In turn,
the Ca concentration was estimated via
rCatCa⬇
~oD352 eV⫺ oD345 eV!⫺ ~ mcell,352 eV⫺ mcell,345 eV!rcelltcell
mCa,352 eV⫺ mCa,345 eV
. ~2! For the dry and fixed VSMC sample ~cell 2!, this yielded a Ca concentration of ;0.2 ng/cm3 for the lamellipodium.
The Ca concentration of the unfixed cells is roughly two times higher—unfixed, dry: ;0.4 ng/cm3; living ;0.5 ng/
cm3. Furthermore, the calculations for the unfixed cells also
revealed about two times higher concentrations for the Ca hotspots ~unfixed, dry: ;0.8 ng/cm3, living ;0.7 ng/cm3!,
than for the actin rich areas.
Unlike for the spectra of the C K-edge, conclusions about the molecular composition cannot be drawn from the Ca LII,IIIspectra. However, the findings again demonstrate
how invasive the preparation can be. Due to the fixation process, almost half of the Ca and the Ca hotspots of a cell are lost.
Radiation Damage
Radiation damage was observed in all cells. Some examples are shown in Figure 7. The dry and fixed samples were the least affected ~Fig. 7a!, followed by the unfixed, dried cell. In these two cases, only little thinning, or mass loss, of the irradiated part was visible. In addition, this was only ob-served after recording multiple images of one area with high resolution. Even then, the cellular structures were still visi-ble; only the absorption had decreased.
Thinning was more severe for the aqueous samples due to the fact that small parts of matter rapidly diffuse when they are detached from the cells by X-radiation. Apart from
that, the cell borders of the living samples blur, thin parts become broader, and X-ray opaque clusters form, as can be seen in Figure 7b,c. Figure 7 depicts the spectra of the cell parts shown in Figure 6. It proves that the thinning of the cells is most severe for the fixed and aqueous cells because the transmission for this specimen is highest. Not only thinning, but also carbon clustering effects are noticeable, e.g., the spectrum of the originally alive cell shows a higher absorption between 292 and 300 eV than the unfixed and dry cell, although the mass loss was higher due to diffusion. Because of the radiation damage, statements about the features of the spectra at energies higher than 293 or 294 eV are not discussed in the Spectromicroscopy section. At this point, the stack area had already been imaged about 50 times, and one can assume that the absorption spectra are affected by thinning and clustering effects. However, spec-troscopic investigations on living cells without cryofixation are feasible because the loss in chemical bonds is almost Figure 7. Examples for the observed radiation damage. ~a! The fixed and dried cell from Figure 2c is shown before ~top! and after ~bottom! recording two stacks of in total 143 images. ~b! Image of an originally alive cell before and after taking a series of 17 images with sub-100 nm resolution of a smaller area of the cell; ~c! the first and the last image of the series. ~d! Spectra of the whole parts of the cells seen in Figure 6; details are given in the text.
equal for cryo and room temperature experiments; about 2% per MGy of the C⫽O bonds are destroyed ~Beetz & Jacobsen, 2003; Beetz, 2004; Wang et al., 2009!.
The spectra in Figure 7c were also used to calculate the dose D applied to the sample during the experiments, using
D⫽ 2NArehc
ftf2
hD2A ~3!
with NAAvogadro’s constant, rethe classical electron radius,
h Planck’s constant, c the speed of light, A the atomic weight
of the substance ~AC⫽ 12!, h the detector efficiency, f the
flux traversing the sample ~in 103 photons/s!, t the dwell
time in ms, and the pixel size D2in nm2, and f
2the oscillator
strength, which is depending on the energy ~Thompson et al., 2001!. With f2, E⫽ f2,300 eV E 300 eV oDE oD300 eV , ~4!
we could estimate the radiation dose D for one pixel per image and by summing f2, Eover the energies the radiation
dose Dstackper pixel per stack. With a flux of approximately
8⫻ 106photons/s, dwell times of 2 ms and 3 ms, t⫽ 52%, D and Dstackwere calculated for a stack of 96 images at the C edge and are listed in Table 2. The average dose D was calculated for E⫽ 290 eV and is in the range of 104–105Gy
per image; the total dose for one stack is about 106–107Gy.
According to Kirz et al. ~2009!, about 105 Gy lead to
structural changes in biologic specimens, but also experi-ments applying doses of 107 Gy have been reported with
only small structural changes ~Song et al., 2008!.
C
ONCLUSIONThe X-ray microscopy study of VSMCs presented here demonstrated that the intracellular structures can be im-aged. Comparison with fluorescent pictures of fixed cells enabled us to determine actin rich parts and thick actin bundles. The images recorded with the compact TXM are comparable to the ones gained with the STXM at BESSY II regarding absorption contrast and resolution.
Although only reference spectra of pristine DNA, lip-ids, and model proteins could be used, similar spectral patterns were found and the cell parts in the ROIs could be assigned. By means of the Ca spectra, it could be shown that the concentration in the fixed cells is only half as high as for
the unfixed cells. In the latter, isolated Ca hotspots were detected, and the concentration of Ca in these distinct locations could be estimated to be two times higher than in the actin rich parts of the unfixed VSMCs. Using equation ~2!, the Ca concentration in the cells and the hotspots was estimated. Since no comparable results from the literature was found, an interpretation needs further studies. The spectra also showed the need to carefully prepare spectro-scopic experiments because of the danger of destroying the sample due to radiation damage. In the case of the detection of Ca, elemental mapping might have given better results. On the other hand, the thin samples allowed for experiment-ing in transmission mode, for which the radiation dose is much smaller.
The influence of the different preparation methods is observable in the experiments. While the absorption con-trast of the cytoskeleton is improved by fixation of the cells, it is harder to recognize such structures in the unfixed cells. The results qualitatively show how much of the cell matter is actually lost during the fixation process.
Further experiments shall focus on cells that have been marked with green fluorescent protein to enable the assign-ment of structures of the cytoskeleton of unfixed or even living cells in X-ray images. Apart from the Ca edges exper-iments also involving energies around the N ~409.9 eV! or O ~523 eV! K-edges, or in general other absorption edges of elements in the water window, could yield additional data for determining the intracellular structures. Because of the radiation damage, tomography of nonvitrified cells is not possible. However, taking just a few images at different angles could provide further information about the spatial arrangements of the organelles and structures of a cell ~Gleber, 2009!.
A
CKNOWLEDGMENTSWe wish to thank Prof. H. Hertz, head of the Biomedical and X-Ray Physics Group at the Royal Technical University ~KTH! in Stockholm, for the valuable collaboration and the opportunity to work with the compact TXM. We also thank the staff at BESSY II, in particular P. Guttmann, for provid-ing excellent experimentprovid-ing conditions. This work was funded by the DFG ~Deutsche Forschungsgesellschaft! within the collaborative research program “SFB 755 - Nanoscale Photonic Imaging.”
R
EFER ENCESBâldea, I., Schimmelpfennig, B., Plaschke, M., Rothe, J., Schirmer, J., Trofimov, A.B. & Fanghänel, T. ~2007!. C 1s near edge X-ray absorption fine structure ~NEXAFS! of substi-tuted benzoic acids—A theoretical and experimental study.
J Electron Spectrosc 154, 109–118.
Beetz, T. ~2004!. Soft X-ray diffraction imaging with and without lenses and radiation damage studies. PhD thesis. Stony Brook, NY: Stony Brook University.
Beetz, T. & Jacobsen, C. ~2003!. Soft X-ray radiation-damage studies in PMMA using a cryo-STXM. J Synchrotron Rad 10~3!, 280–283.
Table 2. Radiation Doses per Pixel per Image ~D! and per Stack ~Dstack!; Details about the Values are Given in the Text.
Sample D ~Gy! Dstack ~Gy! Dried, fixed 2.2⫻ 105 1.5⫻ 107 Aqueous, fixed 3.3⫻ 104 1.8⫻ 106 Dried, unfixed 7.9⫻ 104 4.9⫻ 106 Living 2.4⫻ 104 1.5⫻ 107
Benzerara, K., Yoon, T., Tyliszczak, T., Constantz, B., Spormann, A. & Brown, G.B., Jr. ~2004!. Scanning transmis-sion X-ray microscopy study of micro-bial calcification.
Geo-biol 2~4!, 249–259.
Berglund, M., Rymell, L., Peuker, M., Wilhein, T. & Hertz, H.M. ~2000!. Compact water-window transmission X-ray micros-copy. J Microsc 197~3!, 268–273.
Bertilson, M.C., von Hofsten, O., Thieme, J., Lindblom, M., Holmberg, A., Takman, P.A.C, Vogt, U. & Hertz, H.M. ~2009!. First application experiments with the Stockholm com-pact soft X-ray microscope. J Phys Conf Ser 186, 012025. Bertsch, P.M. & Hunter, D.B. ~2001!. Applications of
synchrotron-based X-ray microprobes. Chem Rev 101, 1809–1842.
Betzig, E., Patterson, G.H., Sougrat, R., Lindwasser, O.W., Olenych, S., Bonifacino, J.S., Davidson, M.W., Lippincott-Schwartz, J. & Hess, H.F. ~2006!. Imaging intracellular fluo-rescent proteins at nanometer resolution. Science 313~1642!, 810–813.
Buckley, C.J. ~1995!. Measuring and mapping in mineralized tissues by absorption difference imaging. Rev Sci Instrum 66~2!, 1318–1321.
Chao, W., Kim, J., Rakewa, S., Fischer, P. & Anderson, E.H. ~2009!. Demonstration of 12 nm resolution fresnel zone plate lens based soft X-ray microscopy. Opt Express 17~20!, 17669–17677.
Cheng, H. & Lederer, W. ~2008!. Calcium sparks. Physiol Rev 88~4!, 1491–1545.
CXRO ~2011!. X-Ray Interactions with Matter. Berkeley, CA: Cen-ter for X-Ray Optics, Lawrence Berkeley National Laboratory ~retrieved Jan. 2011!.
Egner, A. & Hell, S.W. ~2005!. Fluorescence microscopy with super-resolved optical sections. Trends Cell Biol 15~4!, 207–215. Fleet, M.E. & Liu, X. ~2009!. Calcium L2, 3-edge XANES of carbonates, carbonate apatite, and oldhamite ~CaS!. Am
Min-eral 94~8–9!, 1235–1241.
Gleber, S.-C. ~2009!. Soft X-ray stereo microscopy for investiga-tion of dynamics and elemental distribuinvestiga-tion of colloidal sys-tems from the environment. PhD thesis. Gottingen, Germany: Georg-August-University.
Greco, T., Hodara, R., Parastatidis, I., Heijnen, H., Dennehy, M., Liebler, D. & Ischiropoulos, H. ~2006!. Identification of nitrosylation motifs by site-specific mapping of the s-nitrosocysteine proteome in human vascular smooth muscle cells. Proc Nat Acad Sci 103~19!, 7420–7425.
Guttmann, P., Heim, S., Werner, S., Niemann, B., Follath, R. & Schneider, G. ~2007!. X-ray microscopy at the new U41-FSGM beam line. BESSY—Annual Report 2007, pp. 297–300. Hitchcock, A., Morin, C, Zhang, X. & Araki, T. ~2005!. Soft
X-ray spectromicroscopy of biological and synthetic polymer systems. J Electron Spectrosc 144–147, 259–269.
Hitchcock, A.P., Dynes, J.J., Lawrence, J.R., Obst, M., Swer-hone, G.D.W., Korber, D.R. & Leppard, G.G. ~2009!. Soft X-ray spectromicroscopy of nickel sorption in a natural river biofilm. Geobiol 7~4!, 432–453.
Huang, B., Wang, W., Bates, M. & Zhuang, X. ~2008!. Three-dimensional super-resolution imaging by stochastic optical re-construction microscopy. Science 319~5864!, 810–813. Huang, X., Nelson, J., Kirz, J., Lima, E., Marchesini, S., Miao,
H., Neiman, A., Shapiro, D., Steinbrenner, J., Stewart, A., Turner, J. & Jacobsen, C. ~2009!. Soft X-ray diffraction micros-copy of a frozen hydrated yeast cell. Phys Rev Lett 103~19!, 198101.
Jacobsen, C, Wirick, S., Flynn, G. & Zimba, C. ~2000!. Soft X-ray spec-troscopy from image sequences with sub-100 nm spatial resolution. J Microsc 197~2!, 173–184.
Janiak, R., Wilson, S., Montague, S. & Hume, J. ~2001!. Hetero-geneity of calcium stores and elementary release events in canine pulmonary arterial smooth muscle cells. Am J Physiol 280~1!, C22–C33.
Kirz, J., Jacobsen, C. & Howells, M. ~2009!. Soft X-ray micro-scopes and their biological applications. Q Rev Biophys 28~1!, 33–130 ~reprint of 1995!.
Kolczewski, C., Püttner, R., Martins, M., Schlachter, A.S., Snell, G., Santanna, M.M., Hermann, K. & Kaindl, G. ~2006!. Spectroscopic analysis of small organic molecules: A comprehensive near-edge X-ray-absorption fine-structure study of C6-ring-containing molecules. J Chem Phys 124~3!, 034302. Lange, K. & Gartzke, J. ~2006!. F-actin-based Ca signaling—A critical comparison with the current concept of Ca signaling. J
Cell Physiol 209~2!, 270–287.
Larabell, C.A. & Le Gros, M.A. ~2004!. X-ray tomography gen-erates 3-D reconstructions of the yeast, Saccharomyces
cerevi-siae, at 60 nm resolution. Mol Biol Cell 15~3!, 957–962.
Lawrence, J., Swerhone, G., Leppard, G., Araki, T., Zhang, X., West, M. & Hitchcock, A.P. ~2003!. Scanning transmission X-ray, laser scanning, and transmission electron microscopy mapping of the exopolymeric matrix of microbial biofilms.
Appl Environ Microbiol 69~9!, 5543.
Lerotic, M., Jacobsen, C., Schäfer, T. & Vogt, S. ~2004!. Cluster analysis of soft X-ray spectromicroscopy data. Ultramicroscopy 100, 35–57.
McDermott, G., Le Gros, M.A., Knoechel, C.G., Uchida, M. & Larabell, C.A. ~2009!. Soft X-ray tomography and cryogenic light microscopy: The cool combination in cellular imaging.
Trends Cell Biol 19~11!, 587–595.
McGeown, G. ~2010!. Gl brown lecture 2010: Seeing is believing: Imaging ca2⫹-signalling events in living cells. Exp Physiol 95~11!, 1049–1060.
Meyer-Ilse, W., Hamamoto, D., Nair, A., Leliévre, S.A., Den-beaux, G., Johnson, L., Pearson, A.L., Yager, D., Le Gros, M.A. & Larabell, C.A. ~2001!. High resolution protein local-ization using soft X-ray microscopy. J Microsc 201~3!, 395–403. Mitrea, G., Thieme, J., Guttmann, P., Heim, S. & Gleber, S. ~2008!. X-ray spectromicroscopy with the scanning transmis-sion X-ray microscope at BESSY II. J Synchrotron Rad 15~1!, 26–35.
Neu, T.R., Manz, B., Volke, F., Dynes, J.J., Hitchcock, A.P. & Lawrence, J.R. ~2010!. Advanced imaging techniques for assess-ment of structure, composition and function in biofilm sys-tems. FEMS Microbiol Ecol 72, 1–21.
Norlund, K.L.I., Southam, G., Tyliszcak, T., Hu, Y., Karunka-ran, C., Obst, M., Hitchcock, A.P. & Warren, L.A. ~2009!. Microbial architecture of environmental sulfur processes: A novel syntrophic sulfur-metabolizing consortia. Org Geochem 43~23!, 8781–8786.
Parker, I., Choi, J. & Yao, Y. ~1996!. Elementary events of insp3-induced ca2⫹ liberation in xenopus oocytes: Hot spots, puffs and blips. Cell Calcium 20~2!, 105–121.
Parkinson, D.Y., McDermott, G., Etkin, L.D., Le Gros, M.A. & Larabell, C.A. ~2008!. Quantitative 3-D imaging of eukaryotic cells using soft X-ray tomography. J Struct Biol 162~3!, 380–386. Resch, G.P., Goldie, K.N., Krebs, A., Hoenger, A. & Small, J.V. ~2002!. Visualisation of the actin cytoskeleton by cryo-electron microscopy. J Cell Sci 115~9!, 1877–1882.
Rust, M.J., Bates, M. & Zhuang, X. ~2006!. Sub-diffraction-limit imaging by stochastic optical reconstruction microscopy ~STORM!. Nat Methods 3~10!, 793–796.
Schneider, G., Guttmann, P., Heim, S., Rehbein, S., Mueller, F., Nagashima, K., Heymann, J.B., Müller, W.G. & McNally, J. ~2010!. Three-dimensional cellular ultrastructure resolved by X-ray microscopy. Nat Methods 7~12!, 985–987.
Small, J.V., Auinger, S., Nemethova, M., Koestler, S., Goldie, K.N., Hoenger, A. & Resch, G.P. ~2008!. Unravelling the structure of the lamellipodium. J Microsc 231~3!, 479–485. Smith, A.P., Urquhart, S.G., Winesett, D.A., Mitchell, G. &
Ade, H. ~2001!. Use of near edge X-ray absorption fine struc-ture spectromicroscopy to characterize multicomponent poly-meric systems. Appl Spectrosc 55~12!, 1676–1681.
Solomon, D., Lehmann, J., Kinyangi, J., Liang, B., Heymann, K., Dathe, L., Hanley, K., Wirick, S. & Jacobsen, C. ~2009!. Carbon ~1s! NEXAFS spectroscopy of biogeochemically rele-vant reference organic compounds. Soil Sci Soc Am J 73~6!, 1817.
Song, C., Jiang, H., Mancuso, A., Amirbekian, B., Peng, L., Sun, R., Shah, S.S., Zhou, Z.H., Ishikawa, T. & Miao, J. ~2008!. Quantitative imaging of single, unstained viruses with coherent X rays. Phys Rev Lett 101~8!, 158101.
Stöhr, J. ~1992!. NEXAFS Spectroscopy. Berlin, Germany: Springer. Studer, D., Humbel, B. & Chiquet, M. ~2008!. Electron micros-copy of high pressure frozen samples: Bridging the gap between cellular ultrastructure and atomic resolution. Histochem Cell
Biol 130~5!, 877–889.
Takman, P.A.C., Stollberg, H., Johansson, G., Holmberg, A., Lindblom, M. & Hertz, H.M. ~2007!. High-resolution com-pact X-ray microscopy. J Microsc 226~2!, 175–181.
Thieme, J., Sedlmair, J., Gleber, S.-C, Prietzel, J., Coates, J., Eusterhues, K., Abbt-Braun, G. & Salome, M. ~2010!. X-ray spectromicroscopy in soil and environmental sciences. J
Syn-chrotron Rad 17~2!, 149–157.
Thompson, A.C, Attwood, D.T., Gullikson, E.M., Howells, M.R., Kim, K.J., Kirz, J., Kortright, J.B., Lindau, I., Pi-anatta, P. & Robinson, A.L. ~2001!. X-ray Data Booklet, 2nd ed., Thompson, A.C. & Vaughan, D. ~Eds.!. Berkeley, CA: Law-rence Berkeley National Laboratory.
Thyberg, J. ~2000!. Differences in caveolae dynamics in vascular smooth muscle cells of different phenotypes. Lab Invest 80~6!, 915–929.
Wang, J., Morin, C., Li, L., Hitchcock, A.P., Scholl, A. & Doran, A. ~2009!. Radiation damage in soft X-ray microscopy.
J Electron Spectrosc 170~1–3!, 25–36.
Wiesemann, U. ~2003!. The scanning transmission X-ray micro-scope at BESSY II. PhD thesis. Göttingen, Germany: Institute for X-Ray Physics, University of Göttingen.
Wiesemann, U., Thieme, J., Früke, R. & Guttmann, P. ~2001!. Construction of a scanning transmission X-ray microscope at the undulator U-41 at BESSY II. Nucl Instrum Methods A 467–468, 861–863.
Willig, K., Rizzoli, S., Westphal, V., Jahn, R. & Hell, S. ~2006!. STED microscopy reveals that synaptotagmin remains clus-tered after synaptic vesicle exocytosis. Nature 440, 935–939. Yamamoto, A., Masaki, R., Guttmann, P., Schmahl, G. &
Ki-hara, H. ~1998!. Studies on intracellular structures of COS cells by X-ray microscopy. J Synchrotron Rad 5~3!, 1105–1107. Zenisek, D., Davila, V., Wan, L. & Almers, W. ~2003!. Imaging
calcium entry sites and ribbon structures in two presynaptic cells. J Neurosc 23~7!, 2538–2548.