A multi-imaging approach to study the root-soil interface
Texte intégral
Figure
Documents relatifs
In this context, we aim to examine the relationships between root traits and soil physical properties directly after traffic to obtain a preview of the potential effects of roots
Here, in order to study pearl millet root system in field conditions, we developed a model to estimate root length density (total length of roots per unit of soil volume; RLD) from
As plant roots are capable of decreasing the concentration of K + from several hundreds of micromoles per dm 3 in the bulk soil down to concentrations in the micromolar range at
The high contrast between crops as regard to soil structure and root distribution is likely to affect both the long term production and environmental impacts of
For a very dense root network, representative for roots growing in a flooding soil or in medium, one can consider the root density distribution and define a continuous model for
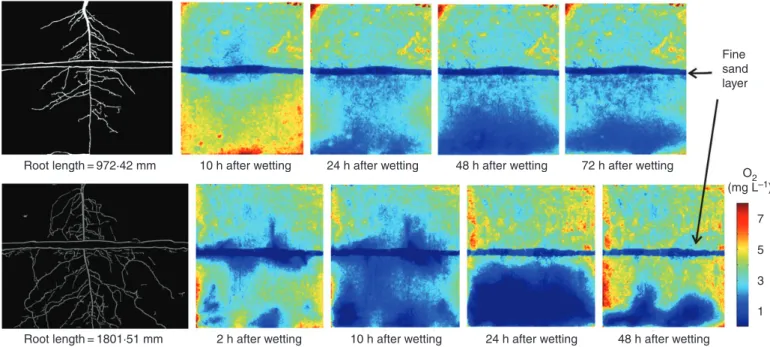
The distribution of soil saturation ( s u,i , Plot c) shows the propagation of multiple wetting fronts through the soil profile, while the distributions of root surface area ( S Ar,i
The RIC method was thus found to be suita- ble for studying 2-D relationships between the soil, tillage and the sugarcane root distribution in the field. Keywords: sugarcane,
Shoot and root dry and fresh weight of 12-day old maize plants grown in standard soil conditions or in SF-ROBS were assessed: a shoot and root length (cm), b shoot and root fresh
