Melting of Biotite + Plagioclase + Quartz Gneisses: the Role of H2O in the Stability of Amphibole
16
0
0
Texte intégral
(2) JOURNAL OF PETROLOGY. VOLUME 41. schlieren included in the parent rock. The schlieren consist of biotite–hornblende gneisses with biotite > hornblende, whereas the veins contain much more hornblende than relic biotite. The inner part of the massif consists of an in situ granodioritic to tonalitic dome. Geochemical investigations demonstrated that the bulk composition of the migmatites was comparable with that of the parent rocks. Therefore, the melting process occurred under near-isochemical conditions, disregarding the volatiles (Bu¨sch et al., 1974). On the basis of these observations, Bu¨sch et al. (1974) proposed that the granodioritic to tonalitic melts formed by anatexis of biotite–plagioclase paragneisses under low-P, high-T conditions. This would require hornblende to be generated from melting of biotite + plagioclase + quartz according to the reaction Bio + Plag + Qtz =Hbl + Sph + An-rich Plg + (Kfs + An-poor Plg + H2O + Qtz)melt. In the biotite-bearing high-grade Archaean gneiss terrane (Northern Gallatin Range, Montana, USA) a trondhjemite–tonalite sequence was subjected to amphibolite to granulite metamorphic conditions (Mogk, 1992). Textural relationships and bulk chemical compositions suggest that the amphibole–quartz-bearing lenses can be interpreted as neosomes generated during the anatexis of the surrounding biotite-bearing gneiss. Mogk (1992) deduced an equilibration temperature of 680–735°C at pressures of [8 kbar; such temperatures are at least 100°C lower than the minimum temperatures obtained from appropriate fluid-absent (dehydration) melting reaction experiments (Le Breton & Thompson, 1988; Thompson, 1988; Vielzeuf & Holloway, 1988). Consequently, Mogk (1992) suggested that the formation of migmatites in the trondjemite–tonalite gneisses is the result of incongruent melting of biotite-bearing gneisses producing amphibole and granitic melt, according to the generalized reaction Bio + Plg (I) + Qtz + Epi + (H2O)fluid =Hbl + Plg (II) + Kf-rich granitic melt. The occurrence of hornblende in migmatites related to hornblende-free biotite, plagioclase and quartz (BPQ) gneisses requires a mechanism whereby amphibole is generated during partial melting of BPQ assemblages. This experimental study was designed to determine the P–T–aH2O conditions under which amphibole can be generated from BPQ assemblages during the anatexis of normal (35 km, >0 kbar) to thickened (70 km, >20 kbar) gneissic crust in collision orogeny.. PREVIOUS STUDIES Experimental studies on a wide range of synthetic and natural compositions provide information on the melting. NUMBER 5. MAY 2000. of BPQ assemblages. Studies have been conducted at H2O saturation, a condition important only for the final stages of crystallization of hydrous magma, but of little relevance to dehydration-melting of hydrous minerals in the absence of a free fluid phase (Burnham, 1979; Thompson, 1982, 1990; Clemens, 1990). More recently, studies on dehydration-melting of BPQ assemblages have focused on the determination of the vapour-absent solidus of crustal rocks (Le Breton & Thompson, 1988; Vielzeuf & Holloway, 1988; Vielzeuf & Montel, 1994; Patin˜oDouce & Beard, 1995; Dooley & Patin˜o-Douce, 1996) and the relative fertility (in terms of granitic melt produced during dehydration-melting reactions) of these crustal rocks. From these studies we know that two-mica (biotite and muscovite) pelites are two or three times more fertile than biotite pelites in the same P–T range because of restricted solid solution in muscovite compared with biotite (Gardien et al., 1995). Metagreywackes produce larger volumes of granitic melt than metapelites as a result of their higher Na2O contents (Patin˜o-Douce & Johnston, 1991; Thompson, 1996) and the increased Fe/Mg ratio in biotite. These previous studies have demonstrated that the dehydrationmelting of BPQ assemblage between 800 and 900°C and between 10 and 15 kbar generates granitic melt and a granulitic residual assemblage consisting of garnet (or spinel or cordierite)–pyroxene (Opx and/or Cpx)–biotite (Maaløe & Wyllie, 1975; Patin˜o-Douce & Johnston, 1991; Vielzeuf & Montel, 1994). Amphibole is present in these experiments either as a relic phase inherited from the starting material (Skjerlie & Johnston, 1993) or because H2O was added to the system (Conrad et al., 1988; Johnston & Wyllie, 1988; Patin˜o-Douce & Beard, 1995). Studies on diatexite melting in the presence of excess H2O generated hornblende from BPQ assemblages at low pressures (1–5 kbar) (Steuhl, 1969; Knabe, 1970; Mehnert et al., 1973; Hoschek, 1976; Conrad et al., 1988). Hoschek (1976) demonstrated that at 4 kbar variable plagioclase and biotite (Fe–Mg–Al) compositions spread out the melting interval of BPQ by more than 100°C. For albite-rich or anorthite-rich starting materials the formation of amphibole is limited to coexistence with Alpoor biotites. Starting materials containing intermediate plagioclase (An50) crystallize amphibole over the entire range of biotite compositions. The compositions of amphiboles depend on the Fe/Mg ratio of the biotite in the starting material. Tremolite is favoured by Mg-rich biotite, whereas cummingtonite crystallization requires Fe-rich biotite compositions. The effects of increasing amounts of H2O on synthetic granite and granodiorite compositions at 2 and 8 kbar were investigated by Maaløe & Wyllie (1975), Naney & Swanson (1980) and Naney (1983). These studies illustrated that decreasing water activity has the effect of. 652.
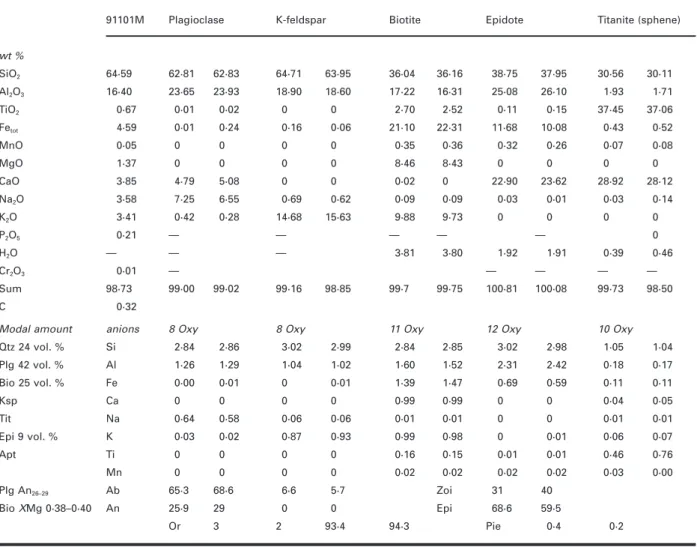
(3) GARDIEN et al.. MELTING OF GNEISSES. progressively raising the melting temperatures of plagioclase, alkali feldspar and quartz. More importantly, those studies revealed the relationships between quartzofeldspathic components and the stability fields of biotite, amphibole and pyroxene in the H2O-undersaturated region as a function of pressure, from 2 to 8 kbar. Conrad et al. (1988) investigated the water-saturated and undersaturated melting relationships of metaluminous dacite and peraluminous metagreywacke compositions at 10 kbar. Their 10 kbar results demonstrated that the amphibole stability field is confined to near-solidus conditions at low H2O activity.. EXPERIMENTAL PROCEDURES The starting material A sample of ‘banded’ gneiss from the middle sector of the Lepontine nappes (Ticino Valley, Switzerland) was used as starting material for this experimental study. The sample (91101) consists of 24 vol. % quartz, 25 vol. % biotite (XMg = 0·38–0·40), 42 vol. % plagioclase (An26–29), 9 vol. % total alkali feldspar (Or90), titanite, apatite and epidote. The bulk composition, together with representative mineral analyses, is given in Table 1. The sample was crushed and ground under alcohol in an agate mortar, resulting in a final grain size of >5 lm, then was dried at 110°C and stored in a desiccator.. Evolution of hornblende stability field Naney’s (1983) experiments show that the presence of hornblende requires a minimum of 4 wt % of H2O in the granodiorite system at 2 kbar, and >3 wt % of H2O at 8 kbar. Conrad et al. (1988) investigated the waterundersaturated melting of per- and metaluminous crustal compositions at 10 kbar, to constrain the origin of silicic magmas occurring in New Zealand. Their studies revealed that amphibole can be generated through an incongruent melting reaction forming amphibole from biotite at 10 kbar and aH2O = 0·5. At lower H2O activities (e.g. aH2O = 0·25), however, amphibole is not stable in the supersolidus region, and ortho- and clinopyroxenes form the stable Fe–Mg silicate paragenesis for dacite and greywacke starting compositions. Conrad et al. (1988) suggested that the breakdown of biotite producing K-feldspar might be completed before the onset of melting. An expansion of the amphibole stability field to lower wt % H2O with increasing pressure is indicated by the experiments of Naney (1983) and Conrad et al. (1988). This suggests that, at pressures in excess of 8 kbar, hornblende stability may overlap with conditions of dehydration-melting of BPQ. This possibility was considered and illustrated by Johnston & Wyllie (1988) in their fig. 3B and Van der Laan & Wyllie (1992) in their fig. 3C. Hence the occurrence of amphiboles in BPQ migmatites could be used to quantify the minimum H2O content of the parental magma. However, the stability of amphibole along the dehydration solidus of BPQ assemblages, and the minimum amount of H2O necessary to stabilize it, has not been investigated systematically in any of the aforementioned experimental studies. Therefore, this study was specifically designed to conduct partial melting experiments on a natural BPQ assemblage (with minor epidote, titanite and K-feldspar) to refine the amphibole stability field at near-solidus conditions and with added H2O contents of 0, 2 and 4 wt %.. Experimental methods The results of the experiments are shown in the SEM images in Fig. 1, and in Table 2. All experiments were performed with a non end-loaded piston-cylinder apparatus calibrated against the albite–jadeite–quartz equilibrium (600°C, 16·4 kbar, Johannes et al., 1971), the quartz–coesite transition at 1000°C and 2·97 GPa (Bohlen & Boettcher, 1980; Bose & Ganguly, 1995) and the fayalite–quartz–orthoferrosilite equilibrium at 1000°C and 14·1 kbar (Bohlen et al., 1980). Pressure was measured with a load cell and was kept constant during the experiments to within ±50 bars of the nominal value. Temperatures were measured using sheathed alumel– chrome (type K) thermocouples and the temperature stability was better than ±2°C. NaCl assemblies of 19 mm o.d. and 10 mm o.d. cylindrical graphite heaters were used as pressure medium for all experiments reported here. Approximately 10–20 mg of powdered sample was loaded together with the appropriate amounts of H2O (using a microsyringe) into 2·3 mm Ag70Pd30 capsules and welded shut. Three capsules were run simultaneously and near-isobaric quenching was accomplished by turning off the heating power at the pressure of the run. Potential Fe loss during the experiments was monitored by least-squares mass balance recalculation of the charges and by extensive X-ray mapping of characteristic Fe-Ka distribution along the capsule walls and quantitative measurement of Fe in the capsule adjacent to the charge. No Fe was detected in the capsule material and the difference between measured and calculated bulk melt compositions was always <0·04 wt % FeO, demonstrating that silver–palladium capsules can be as efficient as gold capsules in minimizing the problem of Fe loss during the experiment (at low pressures and temperatures). Experimental conditions and results are summarized in Table 2.. 653.
(4) JOURNAL OF PETROLOGY. VOLUME 41. NUMBER 5. MAY 2000. Table 1: Analysed bulk and mineral compositions of the starting material (91101M) 91101M. Plagioclase. K-feldspar. Biotite. Epidote. Titanite (sphene). SiO2. 64·59. 62·81. 62·83. 64·71. 63·95. 36·04. 36·16. 38·75. 37·95. 30·56. Al2O3. 16·40. 23·65. 23·93. 18·90. 18·60. 17·22. 16·31. 25·08. 26·10. 1·93. 1·71. 2·70. 2·52. 0·11. 0·15. 37·45. 37·06. wt % 30·11. TiO2. 0·67. 0·01. 0·02. 0. 0. Fetot. 4·59. 0·01. 0·24. 0·16. 0·06. 21·10. 22·31. 11·68. 10·08. 0·43. 0·52. MnO. 0·05. 0. 0. 0. 0. 0·35. 0·36. 0·32. 0·26. 0·07. 0·08. MgO. 1·37. 0. 0. 0. 0. 8·46. 8·43. 0. 0. 0. CaO. 3·85. 4·79. 5·08. 0. 0. 0·02. 0. 22·90. 23·62. 0. 28·92. 28·12. Na2O. 3·58. 7·25. 6·55. 0·69. 0·62. 0·09. 0·09. 0·03. 0·01. 0·03. 0·14. K 2O. 3·41. 0·42. 0·28. 14·68. 15·63. 9·88. 9·73. 0. 0. 0. 0. 1·91. 0·39. P 2 O5 H 2O. 0·21 —. Cr2O3 Sum. 0·01 98·73. C. —. —. —. —. — 3·81. —. — 99·00. 99·02. 99·16. 98·85. 99·7. —. 3·80 99·75. 1·92. 0 0·46. —. —. —. —. 100·81. 100·08. 99·73. 98·50. 0·32. Modal amount. anions. Qtz 24 vol. %. Si. 8 Oxy 2·84. 2·86. 8 Oxy 3·02. 2·99. 2·84. 2·85. 3·02. 2·98. 1·05. 1·04. Plg 42 vol. %. Al. 1·26. 1·29. 1·04. 1·02. 1·60. 1·52. 2·31. 2·42. 0·18. 0·17. Bio 25 vol. %. Fe. 0·00. 0·01. 0. 0·01. 1·39. 1·47. 0·69. 0·59. 0·11. 0·11. Ksp. Ca. 0. 0. 0. 0. 0·99. 0·99. 0. 0. 0·04. 0·05. Tit. Na. 0·64. 0·58. 0·06. 0·06. 0·01. 0·01. 0. 0. 0·01. 0·01. Epi 9 vol. %. K. 0·03. 0·02. 0·87. 0·93. 0·99. 0·98. 0. 0·01. 0·06. 0·07. Apt. Ti. 0. 0. 0. 0. 0·16. 0·15. 0·01. 0·01. 0·46. 0·76. Mn. 0. 0. 0. 0. 0·02. 0·02. 0·02. 0·02. 0·03. 0·00. Plg An26–29. Ab. 65·3. 68·6. 6·6. 5·7. Bio XMg 0·38–0·40. An. 25·9. 29. Or. 3. 0 2. 11 Oxy. 12 Oxy. Zoi. 0. Epi. 93·4. 94·3. 10 Oxy. 31. 40. 68·6. 59·5. Pie. 0·4. 0·2. All Fe is assumed to be FeO; H2O for biotite epidote and titanite is recalculated from stoichiometry.. Approach to equilibrium Patin˜o-Douce & Beard (1995) demonstrated with crystallization experiments that equilibrium compositions can be approached in dehydration-melting experiments at temperatures of >900°C in runs of >2 weeks in duration. Temperatures and run duration in this study are similar to those of Patin˜o-Douce & Beard (1995). Moreover, a number of observations support an acceptable approach to equilibrium: (1) compositions of biotite, amphibole, garnet and melt were found to change systematically throughout the P–T range investigated. These compositional trends include an increase of Ti of biotite with rising temperature, and an increase of Altot in amphibole and Ca in garnet with increasing pressure. Melt compositions show regular evolution of the Si, Al, Fe, Mg and Ca contents; a systematic evaluation of the behaviour of the alkali elements Na and K is hampered by the well-known problem. of alkali migration during electron probe analysis of small areas of hydrated alkali-bearing glasses. (2) Compositions of melt and minerals are nearly constant throughout any given charge, with the exception of relic plagioclase cores inherited from the starting materials. Disequilibrium between plagioclase and melt is a common problem in experimental studies (Vielzeuf & Holloway, 1988). (3) Plagioclase, amphibole and garnet developed subhedral to euhedral shapes. Moreover, profile analyses performed on euhedral garnets and amphiboles showed homogeneous compositions from the core to the rim.. Oxygen fugacity All but a few subsolidus experiments were conducted under H2O-undersaturated conditions. Therefore, conventional double-capsule oxygen buffering techniques. 654.
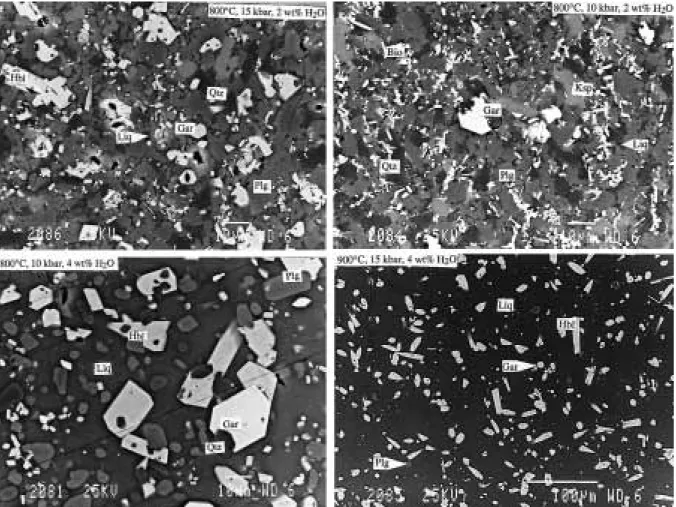
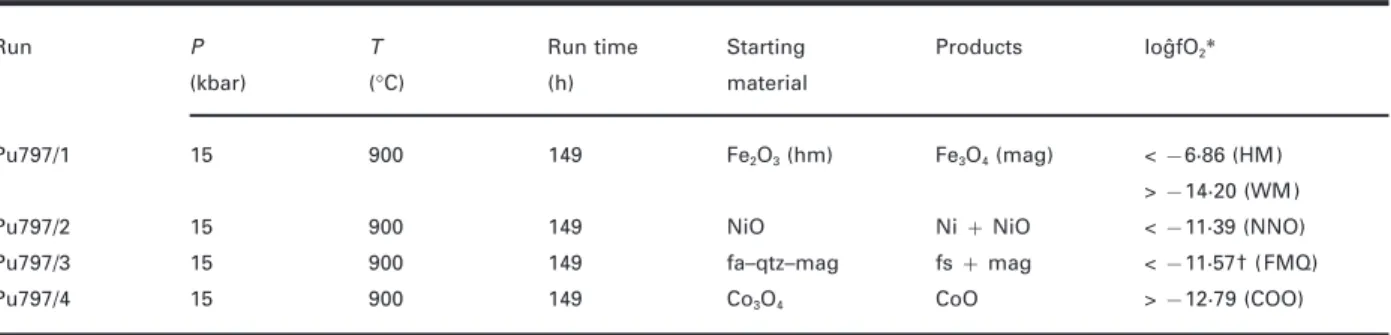
(5) GARDIEN et al.. MELTING OF GNEISSES. Fig. 1. Back-scattered electron micrographs of some experiments at 10 and 15 kbar.. could not be applied (Vielzeuf & Holloway, 1988; Skjerlie & Johnston, 1993). To constrain the intrinsic oxygen fugacity (f O2) imposed by the NaCl–graphite assembly on our samples during the BPQ experiments, we conducted an additional experiment at 900°C and 15 kbar (pu797, Table 3, Fig. 2), using the standard cell assembly. Instead of three sample capsules we loaded four 2·3 mm Ag50Pd50 capsules containing Fe2O3, NiO, Co3O4 and fayalite–magnetite–quartz all with 5–8 wt % H2O added (Table 3). The run duration of 149 h is comparable with the run times used for the BPQ experiments at 900°C (99–126 h). Oxidized starting materials were used except for the FMQ equilibrium. Reduction reactions proceed much faster than oxidation reactions (e.g. Ulmer & Luth, 1991; Frost & Wood, 1995). For the FMQ equilibrium equimolar proportions of synthetic fayalite, quartz and magnetite (3:3:2) were ground together under alcohol and loaded with 6·3 wt % H2O in the AgPd capsule. After termination of the run all charges were embedded in epoxy and ground to expose the centre of the capsules. The product phases were determined with Micro-Raman spectroscopy and electron microprobe. analyses, and are reported in Table 3. We observed reduction of Fe2O3 to Fe3O4, NiO to Ni, and Co3O4 to CoO; no cobalt metal was detected. The FMQ assemblage changed to orthoferrosilite + magnetite with relic quartz grains rimmed by ferrosilite; no fayalite was left from the starting material. The paragenesis fayalite + quartz is not stable above 13 kbar (Bohlen et al., 1980) and reacts to form orthoferrosilite (FeSiO3). However, thermodynamic calculations using the Holland & Powell (1998) thermodynamic database show that f O2 of the metastable FMQ equilibrium and of the stable FsMQ equilibrium (6FeSiO3 + O2 = 2Fe3O4 + 6SiO2) differ by <0·1 logˆf O2. The logˆf O2 values at 900°C and 15 kbar (Table 3, last column) were calculated using thermochemical and volumetric data from O’Neill (1987), Weast (1988) and O’Neill & Pownceby (1993). The intrinsic f O2 of the NaCl–graphite assembly is rather tightly constrained between the FMQ (FsMQ) and COO (2Co + O2 = 2CoO) equilibrium and is hence located between FMQ and FMQ − 1·2 (−11·57 > logˆf O2 > −12·79). The oxygen fugacity of the graphite–CO–CO2 equilibrium. 655.
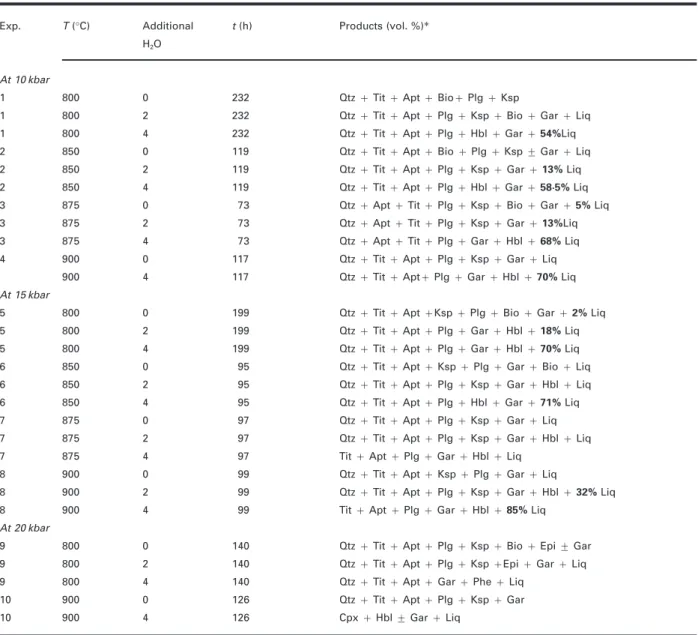
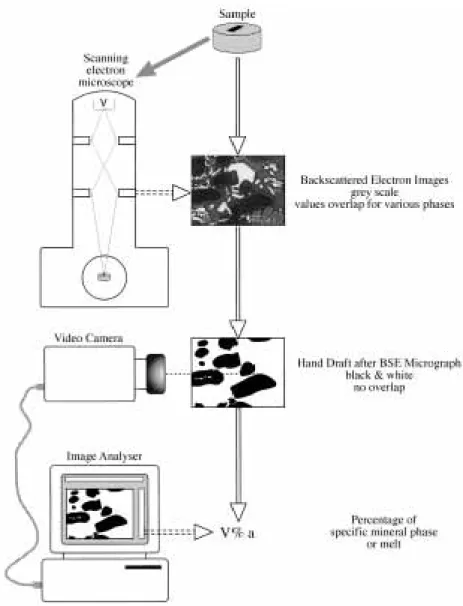
(6) JOURNAL OF PETROLOGY. VOLUME 41. NUMBER 5. MAY 2000. Table 2: Experimental run conditions and products; vol. % liquid measured by image analysis is given Exp.. T (°C). Additional. t (h). Products (vol. %)∗. H 2O. At 10 kbar 1. 800. 0. 232. Qtz + Tit + Apt + Bio+ Plg + Ksp. 1. 800. 2. 232. Qtz + Tit + Apt + Plg + Ksp + Bio + Gar + Liq. 1. 800. 4. 232. Qtz + Tit + Apt + Plg + Hbl + Gar + 54%Liq. 2. 850. 0. 119. Qtz + Tit + Apt + Bio + Plg + Ksp ± Gar + Liq. 2. 850. 2. 119. Qtz + Tit + Apt + Plg + Ksp + Gar + 13% Liq. 2. 850. 4. 119. Qtz + Tit + Apt + Plg + Hbl + Gar + 58·5% Liq. 3. 875. 0. 73. Qtz + Apt + Tit + Plg + Ksp + Bio + Gar + 5% Liq. 3. 875. 2. 73. Qtz + Apt + Tit + Plg + Ksp + Gar + 13%Liq. 3. 875. 4. 73. 4. 900. 0. 117. Qtz + Tit + Apt + Plg + Ksp + Gar + Liq. 900. 4. 117. Qtz + Tit + Apt+ Plg + Gar + Hbl + 70% Liq. 5. 800. 0. 199. Qtz + Tit + Apt +Ksp + Plg + Bio + Gar + 2% Liq. 5. 800. 2. 199. Qtz + Tit + Apt + Plg + Gar + Hbl + 18% Liq. 5. 800. 4. 199. Qtz + Tit + Apt + Plg + Gar + Hbl + 70% Liq. 6. 850. 0. 95. Qtz + Tit + Apt + Ksp + Plg + Gar + Bio + Liq. 6. 850. 2. 95. Qtz + Tit + Apt + Plg + Ksp + Gar + Hbl + Liq. 6. 850. 4. 95. Qtz + Tit + Apt + Plg + Hbl + Gar + 71% Liq. 7. 875. 0. 97. Qtz + Tit + Apt + Plg + Ksp + Gar + Liq. 7. 875. 2. 97. Qtz + Tit + Apt + Plg + Ksp + Gar + Hbl + Liq. 7. 875. 4. 97. Tit + Apt + Plg + Gar + Hbl + Liq. 8. 900. 0. 99. Qtz + Tit + Apt + Ksp + Plg + Gar + Liq. 8. 900. 2. 99. Qtz + Tit + Apt + Plg + Ksp + Gar + Hbl + 32% Liq. 8. 900. 4. 99. Tit + Apt + Plg + Gar + Hbl + 85% Liq. 9. 800. 0. 140. Qtz + Tit + Apt + Plg + Ksp + Bio + Epi ± Gar. 9. 800. 2. 140. Qtz + Tit + Apt + Plg + Ksp +Epi + Gar + Liq. 9. 800. 4. 140. Qtz + Tit + Apt + Gar + Phe + Liq. 10. 900. 0. 126. Qtz + Tit + Apt + Plg + Ksp + Gar. 10. 900. 4. 126. Cpx + Hbl ± Gar + Liq. Qtz + Apt + Tit + Plg + Gar + Hbl + 68% Liq. At 15 kbar. At 20 kbar. ∗Measured mode shown in bold type.. (CCO; Ulmer & Luth, 1991; Frost & Wood, 1995) falls in the same range (logˆf O2 = −12·17 at 15 kbar, 900°C). The intrinsic f O2 values of the NaCl–graphite assemblies used for the BPQ experiments are therefore most probably controlled by the presence of the graphite furnace in the assembly (CCO equilibrium). Oxygen fugacities at just below FMQ are well within the values measured for igneous crustal rocks and hence appropriate for the experiments on biotite–plagioclase–quartz assemblages reported in the subsequent sections.. ANALYTICAL TECHNIQUES AND RESULTS Recovered experimental charges were mounted in epoxy resin and ground to expose longitudinal sections through the centre of the capsules. Quantitative analyses were obtained using a CAMECA SX50 electron microprobe equipped with five wavelength-dispersive spectrometers. Operating conditions were 15 keV acceleration potential, 10 nA beam current and 8 lm beam-size for glass. 656.
(7) GARDIEN et al.. MELTING OF GNEISSES. Fig. 2. Temperature–logˆf O2 diagram at 15 kbar pressure showing the results of the experiment pu797 (Table 3) used to constrain the intrinsic f O2 of the NaCl–graphite assembly used for the BPQ experiments. Abbreviations and sources for the calculation of the solid–buffer equilibrium are given in Table 3 except for CCO: graphite–CO2–CO equilibrium (Ulmer & Luth, 1991; Frost & Wood, 1995). Up and down arrows indicate the direction in which the intrinsic f O2 has to be located at 900°C relative to the solid–buffer equilibrium. The intrinsic f O2 imposed by the assembly lies between FMQ and COO (= FMQ − 1·2), consistent with graphite buffering (CCO equilibrium).. analyses, and 20 nA and 1 lm beam-size for crystalline phases. Standards used were natural and synthetic oxides and silicates, and raw data were corrected using the PAP correction program. Sodium and potassium were analysed first to reduce the error caused by the alkali migration under the electron beam. Microprobe analyses for Na in hydrous granitic glass represent minimum values, because of Na volatilization. In some studies, the researchers discarded the Na2O content of the glass. analyses and recalculated it by mass balance (Patin˜oDouce & Johnston, 1991). In this study or in other similar studies (e.g. Skjerlie & Johnston, 1993) the determination of Na2O by mass balance was not possible because several phases (plagioclase, alkali feldspar, amphibole) contain significant amounts of Na and quantification of the modal amount of relic feldspar was very difficult. We did not quantify the Na loss during microprobe analysis but in the experiments at higher temperatures and at high H2O content we increased the beam diameter from 8 to 12 lm and we found that the Na2O content increased between 50 and 20%, giving us an estimate of Na loss during microprobe analysis. Glass analyses are reported in Table 4; each value represents an average of 10 analysed glass pools. The two different compositions reported for each condition in Table 4 correspond to the average of 10 analyses: the lower Na content was obtained with the 8 lm beam-size and the higher Na content was obtained with the 12 lm beam-size. Glass analyses of near-solidus experiments are not presented in the table because of the difficulty of obtaining reliable glass analyses in crystal-rich experiments using 8 lm electron beam-size; indeed, glass pools could not be analysed without interference with adjacent crystals. The melt fractions reported in Table 2 were determined from back-scattered electron (BSE) micrographs (Fig. 3) using image analysis. The precision of this method was estimated by Gardien et al. (1995) to be approximately ±3% relative. Compositional variables for garnet, plagioclase and amphibole coexisting with melt are also reported in Table 4. The phase equilibrium results at 10, 15 and 20 kbar. Table 3: Experimental run conditions and products to constrain intrinsicfO2 of the NaCl–graphite assembly used for the BPQ experiments Products. logˆfO2∗. Fe2O3 (hm). Fe3O4 (mag). < −6·86 (HM). 149. NiO. Ni + NiO. < −11·39 (NNO). 900. 149. fa–qtz–mag. fs + mag. < −11·57† (FMQ). 900. 149. Co3O4. CoO. > −12·79 (COO). P. T. Run time. Starting. (kbar). (°C). (h). material. Pu797/1. 15. 900. 149. Pu797/2. 15. 900. Pu797/3. 15. Pu797/4. 15. Run. > −14·20 (WM). hm, haematite; mag, magnetite; fa, fayalite; qtz, quartz; fs, orthoferrosilite (FeSiO3); HM, haematite–magnetite equilibrium; WM, wu¨stite–magnetite equilibrium; NNO, Ni–NiO equilibrium; FMQ, fayalite–quartz–magnetite equilibrium; COO, Co–CoO equilibrium. ∗fO2 calculated at 900°C and 15 kbar using thermodynamic and volumetric data from O’Neill (1987), Weast (1988) and O’Neill & Pownceby (1993). †Above 13 kbar the paragenesis fayalite + quartz reacts to orthoferrosilite (FeSiO3) (Bohlen et al., 1980). According to thermodynamic calculation using the Holland & Powell (1998) thermodynamic database the difference between the metastable FMQ and the FsMQ (6FeSiO3 + O2 = 2Fe3O4 + 6SiO2) oxygen buffer equilibria is <0·1 logˆf O2. The value of −12·77 corresponds to the logˆf O2 of the metastable FMQ equilibrium.. 657.
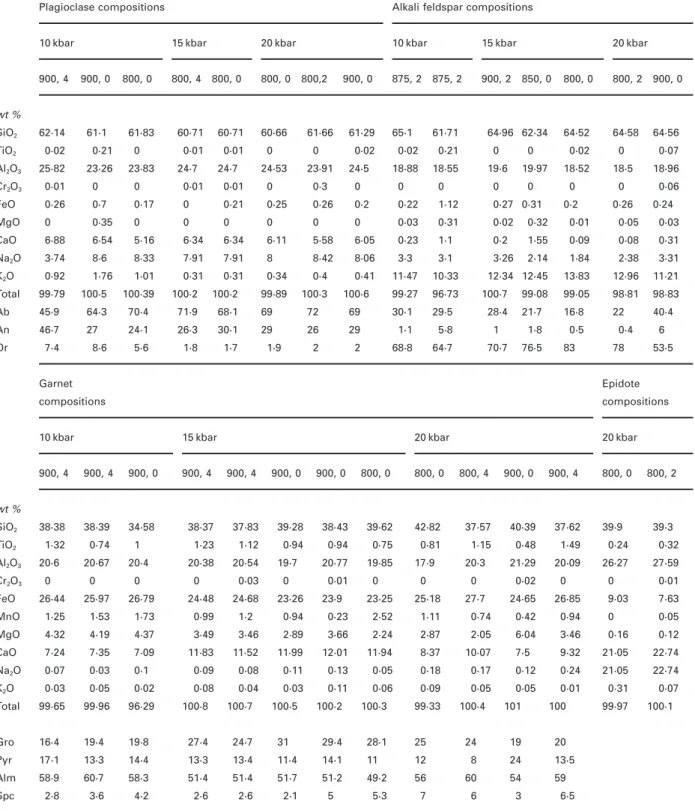
(8) JOURNAL OF PETROLOGY. VOLUME 41. NUMBER 5. MAY 2000. Table 4: Analysed mineral compositions from the experiments for each P (kbar), T (°C) and H2O (the last two values are given separated by a comma) Plagioclase compositions 10 kbar. Alkali feldspar compositions 15 kbar. 900, 4. 900, 0. 61·1. 20 kbar. 800, 0. 800, 4. 800, 0. 61·83. 60·71. 60·71. 0·01. 0·01. 800, 0. 10 kbar 800,2. 900, 0. 15 kbar. 875, 2. 875, 2. 65·1. 61·71. 900, 2. 20 kbar 850, 0. 800, 0. 800, 2. 900, 0. 64·52. 64·58. 64·56. wt % SiO2. 62·14. TiO2. 0·02. 0·21. Al2O3. 25·82. 23·26. 0 23·83. 24·7. 24·7. 60·66. 61·66. 0. 61·29. 0. 24·53. 0·02. 23·91. 24·5. 64·96 62·34. 0·02. 0·21. 0. 0. 18·88. 18·55. 19·6. 19·97. 0·02. 0. 0·07. 18·52. 18·5. 18·96. Cr2O3. 0·01. 0. 0. 0·01. 0·01. 0. 0·3. 0. 0. 0. 0. FeO. 0·26. 0·7. 0·17. 0. 0·21. 0·25. 0·26. 0·2. 0·22. 1·12. 0·27 0·31. MgO. 0. 0·35. 0. 0. 0. 0. 0. 0. 0·03. 0·31. 0·02. 0·32. 0·01. 0·05. 0·03. CaO. 6·88. 6·54. 5·16. 6·34. 6·34. 6·11. 5·58. 6·05. 0·23. 1·1. 0·2. 1·55. 0·09. 0·08. 0·31. Na2O. 3·74. 8·6. 8·33. 7·91. 7·91. 8. 8·42. 8·06. 3·3. 3·1. 3·26. 2·14. 1·84. 2·38. 3·31. K 2O. 0·92. 1·76. 1·01. 0·31. 0·31. 0·34. 0·4. 0·41. 11·47. 10·33. 12·34 12·45. 13·83. 12·96. 11·21. Total. 99·79. 100·5. 100·39. 100·2. 100·2. 99·89. 100·3. 100·6. 99·27. 96·73. 100·7. 99·08. 99·05. 98·81. 98·83. Ab. 45·9. 64·3. 70·4. 71·9. 68·1. 69. 72. 69. 30·1. 29·5. 28·4. 21·7. 16·8. 22. 40·4. An. 46·7. 27. 24·1. 26·3. 30·1. 29. 26. 29. 1·1. 5·8. 1. 1·8. 0·5. Or. 7·4. 5·6. 1·8. 1·7. 2. 2. 68·8. 64·7. 70·7. 76·5. 8·6. 1·9. 0. 0. 0. 0·2. 0·26. 83. 0·4 78. 0·06 0·24. 6 53·5. Garnet. Epidote. compositions. compositions. 10 kbar. 15 kbar. 900, 4. 900, 4. 900, 0. SiO2. 38·38. 38·39. 34·58. TiO2. 1·32. 0·74. 1. 20·67. 20·4. 20 kbar. 900, 4. 900, 4. 900, 0. 900, 0. 800, 0. 38·37. 37·83. 39·28. 38·43. 39·62. 1·23. 1·12. 0·94. 0·94. 0·75. 20·38. 20·54. 20·77. 19·85. 800, 0. 20 kbar 800, 4. 900, 0. 900, 4. 800, 0. 800, 2. 42·82. 37·57. 40·39. 37·62. 0·81. 1·15. 0·48. 1·49. 0·24. 0·32. 21·29. 20·09. 26·27. 27·59. wt %. Al2O3 Cr2O3. 20·6 0. 0. 0. 0. 0·03. 19·7 0. FeO. 26·44. 25·97. 26·79. 24·48. 24·68. 23·26. MnO. 1·25. 1·53. 1·73. 0·99. 1·2. 0·94. 0·01 23·9 0·23. 0. 17·9 0. 23·25. 25·18. 2·52. 1·11. 20·3 0. 0·02. 27·7. 24·65. 26·85. 0. 0·74. 0·42. 0·94. 39·9. 0. 39·3. 0·01. 9·03. 7·63. 0. 0·05. MgO. 4·32. 4·19. 4·37. 3·49. 3·46. 2·89. 3·66. 2·24. 2·87. 2·05. 6·04. 3·46. 0·16. 0·12. CaO. 7·24. 7·35. 7·09. 11·83. 11·52. 11·99. 12·01. 11·94. 8·37. 10·07. 7·5. 9·32. 21·05. 22·74 22·74. Na2O. 0·07. 0·03. 0·1. 0·09. 0·08. 0·11. 0·13. 0·05. 0·18. 0·17. 0·12. 0·24. 21·05. K 2O. 0·03. 0·05. 0·02. 0·08. 0·04. 0·03. 0·11. 0·06. 0·09. 0·05. 0·05. 0·01. 0·31. Total. 99·65. 99·96. 96·29. 100·8. 100·7. 100·5. 100·2. 100·3. 99·33. 100·4. 101. 100 20. Gro. 16·4. 19·4. 19·8. 27·4. 24·7. 31. 29·4. 28·1. 25. 24. 19. Pyr. 17·1. 13·3. 14·4. 13·3. 13·4. 11·4. 14·1. 11. 12. 8. 24. 13·5. Alm. 58·9. 60·7. 58·3. 51·4. 51·4. 51·7. 51·2. 49·2. 56. 60. 54. 59. Spc. 2·8. 3·6. 4·2. 2·6. 2·6. 2·1. 5. 5·3. 7. 6. 3. 658. 6·5. 99·97. 0·07 100·1.
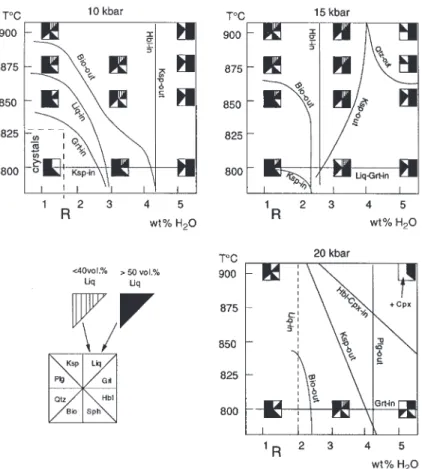
(9) GARDIEN et al.. MELTING OF GNEISSES. Amphibole compositions 10 kbar 850, 4. 15 kbar 900, 4. 850, 4. 20 kbar 900, 4. Biotite compositions. Phengite Cpx compositions. 10 kbar. 20 kbar. 20 kbar. 15 kbar. 900, 4. 900, 4. 800, 0. 875, 0. 800, 0. 850, 0. 800, 4. 900, 4. 900, 4. 35·9. 34·61. 49·4. 51·76. 51·89. wt % SiO2. 44·27. 42·34. 41·83. 41·04. 40·02. 40·97. 36·18. 38·01. TiO2. 1·65. 2·19. 1·17. 1·72. 1·06. 1·69. 2·61. 2·44. 1·44. 3·44. 1·44. 0·82. 0·83. Al2O3. 13·45. 13·43. 15·39. 15·71. 14·62. 18·55. 17·42. 16·35. 16·03. 27·88. 12·95. 13·07. Cr2O3. 0. 0. 0. 0. 16·6. 0·02. 0·01. FeO. 17·32. 19·79. 17·92. 17·69. 18·76. 17·49. 21·37. 0. 20·89. 0. 0. MnO. 0·29. 0·26. 0·33. 0·12. 0·16. 0·22. 0·17. 0·07. 0·29. 0·24. 0. 0·22. MgO. 7·97. 8·69. 7·54. 7·87. 7·74. 6·59. 8·32. 5·62. 8·57. 7·71. 1·63. 5·79. 5·1. CaO. 9·17. 9·67. 9·89. 9·93. 8·86. 8·18. 0·07. 0·58. 0·51. 0·33. 0·42. 13·37. 13·54. 22. 0 22·72. 0·01 3·5. 0·05 10·7. 0·06 10·08 0·13. Na2O. 1·97. 2·05. 2·3. 2·18. 4·84. 2·65. 0·17. 0·6. 0·62. 0·34. 0·88. 3·24. 3·48. K 2O. 1·04. 0·95. 1·62. 1·89. 1·43. 1·38. 9·56. 8·95. 8·51. 9. 8·74. 0·46. 0·43. H 2O. 1·96. Total. 99·09. 1·95 100·3. 1·96 99·95. 1·96 100·1. 1·9. 1·95. 3·86. 3·82. 3·82. 3·85. 4·52. 99·41. 99·78. 98·92. 99·17. 98·26. 99·01. 98·42. 0 99·39. 0 98·62. Total Fe is calculated as FeO, stoichiometric water is assumed for amphibole and mica.. are plotted in T–wt % H2O sections in Fig. 4. The rock itself contains 1·12 wt % H2O, mostly contained in biotite, and marked with an R in Fig. 4. Accessory minerals (titanite, ilmenite, zircon and apatite) are noted in Tables 1 and 2 but they are not considered in Fig. 4.. PHASE RELATIONS AT 10, 15 AND 20 KBAR The point marked R in Fig. 4 represents the starting compositions based on the water content of the rock, assuming that all water is contained in hydrous minerals (biotite and epidote). The dashed curves at 10 and 20 kbar indicate the inferred dehydration solidus. At 10 kbar, the biotite-out curve has a negative slope, indicating that the stability of biotite decreases with increasing amount of H2O in the system. Indeed, in the experiments reported here, the biotite-out curve is located between 875 and 900°C with no added water in the system. Epidote (present in the starting material) was not observed to be stable above the solidus at 10 kbar. Apatite occurs above the solidus and alkali feldspar is detected from the solidus up to 900°C. At 10 kbar the breakdown of alkali-feldspar (Kfsp-out) is observed when 4 wt % H2O is added to the system, and coincides with the occurrence of amphibole in the charges. Quartz and. plagioclase are present at all temperatures at 10 kbar, but the amounts of both phases decrease with increasing melt fraction. In runs containing 4 wt % of added H2O, the proportion of quartz is very small, indicating that the quartz-out curve is approached. The liquidus was not attained at 10 kbar. The experiments between 800 and 900°C with 4 wt % H2O added showed that amphibole is the dominant supersolidus phase coexisting with minor garnet and plagioclase. Plagioclase is progressively consumed and at 900°C nearly disappears from the solid assemblage. At 10 kbar, 4 wt % total H2O is required to stabilize amphibole between 800 and 900°C (see Fig. 4). At lower H2O contents, biotite is the stable hydrous Fe–Mg phase. At 15 kbar, with 2 and 4 wt % H2O added, biotite and epidote were not stable. The hbl-in curve is located between no added H2O and 2 wt % H2O added for all temperatures investigated. Quartz is abundant at 800°C and 4 wt % H2O added; it disappears between 875 and 900°C. Garnets are stable throughout the entire T–XH2O space investigated at 15 kbar. The garnet-in and hornblende-in curves intersect at 800°C and 2 wt % H2O added. The liquidus was never encountered, but at 900°C, 4 wt % H2O added, a large amount of melt (85 vol. %) coexisted with garnet as the dominant crystal phase accompanied by minor amphibole and plagioclase. Increasing the pressure from 10 to 15 kbar expands the. 659.
(10) JOURNAL OF PETROLOGY. VOLUME 41. NUMBER 5. MAY 2000. Fig. 3. Schematic representation of melt vol. % calculations from BSE micrographs obtained by a JEOL JSM 840 scanning electron microscope. Calculations were performed on redrawn BSE image for the melt proportion; the image was scanned with a video-camera and then analysed with a Macintosh computer.. amphibole stability field to lower H2O contents (of the system); a total amount of 3 wt % H2O is sufficient to stabilize amphibole in the supersolidus region in the temperature range 800–900°C. At 20 kbar and 800°C amphibole does not form as a stable phase as a result of the dehydration-melting reaction; it occurs only as small quench crystals associated with quench white mica. The solid assemblage consists predominantly of garnet and quartz. Plagioclase is present only at H2O contents of <4 wt %. Stable amphibole was found only at 900°C and 4 wt % H2O added, where it coexisted with clinopyroxene and garnet. The longitudinal cross-section of the charge at 900°C and 4 wt % H2O added exposed only two large garnet crystals (100 lm). This might indicate that the garnet-out curve. is approached. In contrast, abundant amphibole and clinopyroxene formed small euhedral crystals of 5–10 lm, which can be taken as an indication that hornblende and clinopyroxene-in curves were only marginally overstepped; plagioclase and quartz were absent. At 800°C, and with 0 and 2 wt % H2O, epidote is abundant.. 660. PHASE CHEMISTRY Alkali feldspar Alkali feldspar formed rounded grains 3–5 lm in diameter in experiments at subsolidus conditions or with very low abundance of melt. Alkali feldspar disappeared with increasing melt fraction. Ksp-out occurred when 4.
(11) GARDIEN et al.. MELTING OF GNEISSES. Fig. 4. Temperature–wt % H2O sections of our experiments (Table 2) at 10, 15 and 20 kbar. The bulk rock contains 1·16 wt % H2O (marked R). The wt % H2O axis shows the total amount of water in the system.. wt % of H2O was added to the system at 10 kbar and 20 kbar, and when 2 wt % of H2O was added at 15 kbar. In comparison with the alkali feldspar in the starting material (Ab6–Or94) the alkali feldspars analysed in the experimental charges have considerably higher Ab contents (17–40) (Tables 1 and 4). The albite component decreased with increasing pressure at 800°C (from Ab33 at 10 kbar to Ab17 at 20 kbar). With rising temperature the Ab content increased, as a result of increasing solid solution of the albite component in K-feldspar (e.g. at 20 kbar from Ab17 to Ab40).. and leaving an anorthite-enriched plagioclase residue. At constant temperature plagioclase becomes more sodic with increasing pressure (Table 4). This trend has been observed in other experimental studies (e.g. Patin˜o Douce & Beard, 1995) and reflects the consumption of the anorthite component of plagioclase by a garnet-forming reaction. This is all the more striking considering that the melt fractions increase with increasing pressure at constant temperature and H2O content, which would lead to a decrease of the albite component.. Plagioclase. Micas. Plagioclase was present in all runs at 10 and 15 kbar. At 20 kbar it was absent in runs containing 4 wt % additional H2O. In runs with low melt fractions, plagioclase crystals are homogeneous with compositions identical to those in the starting composition. At higher melt fractions, idiomorphic zoned crystals were present, exhibiting sharp transitions between relic cores (An25) and overgrowth rims (An30–47). The increase in anorthite content reflects the presence of a melt phase fractionating Na into the melt. Biotite crystals were abundant in runs with no added H2O, up to 875°C at 10 kbar and 850°C at 15 kbar. Runs with 2 wt % H2O added contain biotite only at 800°C. In runs with 4 wt % added H2O, small patches of relic biotites (2–3 lm) were observed at 800°C, but because of the small grain-size, quantitative analyses were not possible. The amount of biotite decreased with rising temperature, and increasing pressure and wt % H2O. Ti in biotite (Table 4) increased with temperature at constant. 661.
(12) JOURNAL OF PETROLOGY. VOLUME 41. pressure and decreased with pressure at constant temperature, as has been shown by Patin˜o-Douce (1993). The breakdown of biotite in runs containing 4 wt % added H2O occurred between 850 and 900°C at 10 kbar, and at >800°C at 15 and 20 kbar. In the presence of melt, biotite has higher MgO and TiO2 contents than biotite in subsolidus experiments. At 20 kbar, 800°C and 4 wt % added H2O, phengite developed as very small minerals (Table 3) with a diameter of <1 lm, suggesting that they were quench phases. The occurrence of phengite in this experiment could also be the result of a disequilibrium with the starting biotite, which is not stable under these conditions.. Amphibole Amphibole was always unzoned and present in runs with 2 and 4 wt % added H2O, but did not appear in experiments with no water added to the system. At 10 kbar, the presence of amphibole required 4 wt % added H2O, whereas at 15 kbar amphibole formed with 2 wt % added H2O. At 20 kbar, amphibole was present at 900°C and 4 wt % added H2O. The major compositional trends observed are an increase in total Al with increasing pressure [in agreement with the result of Patin˜o Douce & Beard (1995)] attributed to increasing Tschermaks component with increasing pressure (Schmidt, 1992), and decreasing Ca with increasing pressure consistent with increasing glaucophane component at high pressures. Al contents at 10 kbar are consistent with the Al-in barometer, but in garnet-bearing parageneses the Al content is lower than that suggested by the barometer, consistent with the results of Schmidt (1992).. MAY 2000. Clinopyroxene Clinopyroxene occurred as small crystals coexisting with amphibole and garnet only in the experiment at 20 kbar, 900°C and 4 wt % added H2O. Under these conditions the clinopyroxene contains >30% jadeite component (Table 4). At 10 kbar, the major difference from the results of Conrad et al. (1988) and Van der Laan & Wyllie (1992) is the lack of clinopyroxene. At 15 kbar, the major difference from the results of Patin˜o Douce & Beard (1995) is the lack of clinopyroxene.. Accessory minerals Epidote was observed only at 20 kbar, 800°C, and 0 and 2 wt % added H2O. It contains approximately equal zoisite and pistachite components. Ilmenite, zircon and titanite occurred at 10 and 15 kbar, whereas rutile occurred at 20 kbar (see Table 3).. Garnet Garnet was present at all experimental conditions investigated, except at 10 kbar, 800°C under fluid-absent conditions. Garnets appear as unzoned idiomorphic grains with inclusions of quartz and melt. The composition of garnet changed systematically with pressure and temperature: XMg decreased with increasing pressure and increased with rising temperature. Ca behaved in a more complex fashion; it increased with increasing pressure for a given temperature at 900°C from 0·61 atoms per formula unit (a.p.f.u.) at 10 kbar to 0·98 at 15 kbar; this trend has been observed in the experimental studies of Vielzeuf & Montel (1994). The Ca content then decreased to 0·80 a.p.f.u. at 20 kbar; the decrease in Ca content in garnets at 20 kbar may be due to the occurrence of epidote at 0–2 wt % H2O and of clinopyroxene at 20 kbar and 4 wt % H2O.. NUMBER 5. Melt Microprobe analyses of partial melts produced in experiments with 4 wt % added water only are given in Table 5, with the mineral phases (rims of plagioclase, hornblende, garnet and clinopyroxene) produced during each experiment. Quartz, core of plagioclase and reequilibrated biotite considered as residual phases from the starting material, are not reported in Table 5. The melt proportions (Table 2), which increase as a function of added H2O, were calculated from BSE micrographs by image analysis. In agreement with previous experimental studies (Vielzeuf & Montel, 1994; Gardien et al., 1995; Patin˜o Douce & Beard, 1995) the melt proportion is very small (<4 vol %) if no H2O is added to the hydrate-bearing starting material even at high temperatures (900°C). With 4 wt % added H2O, a strong increase of the melt fraction to 50 or 60% is observed even at temperatures as low as 800°C. All the melts are granitic (Fig. 5), the SiO2 content ranges between 65 and 69 wt %, and they are peraluminous (Table 5). However, the exact nature of the melt cannot be calculated rigorously, because Na loss during microprobe analysis of hydrous alkali-rich glasses tends to accentuate the peraluminous nature of melts. The largest variation in the compositions of the melts is observed for the K2O contents. For runs with 4 wt % added H2O, the K2O monotonically decreases with rising temperature at 10 and 15 kbar (from >3·6–4 wt % at 800°C to 2·2–2·4 wt % at 900°C). The progressive consumption of biotite with rising temperature would produce an increase in the K2O content in the melt as the residual phases (Plg, Grt, Hbl) incorporate either no or only small amounts of K2O (see Table 4). However, the biotite consumption is accompanied by an increase. 662.
(13) 663. 0·02. 0·34. 1·52. 1·36. 3·59. 92·15. Gro(20). An(24). AlT(2·34). MnO. MgO. CaO. Na2O. K2 O. Total. Gar. Plg. Hbl. 92·95. 4·12. 3·93. 1·45. 0·31. 0·09. 1·79. 14·16. 0. 89·84. 3·02. 0·47. 2·18. 0·25. 0·07. 1·74. 15·3. 0. 0·2. 68·32. 8. 89·76. 2·9. 0·74. 2·27. 0·27. 0·03. 1·84. 15·35. 0. 0·19. 67·53. 12. AlT(2·33). An(47). Gro(16). 91·45. 2·41. 1·12. 1·74. 0·2. 0·02. 1·52. 14·5. 0·03. 0·27. 69·14. 8. 91·23. 2·5. 1·51. 1·76. 0·22. 0·04. 1·58. 14·16. 0·02. 0·26. 69·18. 12. AlT(2·69). An(27). Gro(28). 89·21. 3·44. 0·86. 1·62. 0·18. 0·04. 0·9. 14·69. 0. 0·13. 67·35. 8. 89·82. 3·46. 1·03. 2·87. 0·15. 0. 0·78. 14·27. 0·3. 0·95. 66·27. 12. 89·16. 3·26. 0·25. 1·82. 0·15. 0. 0·83. 14·79. 0. 0·15. 68·18. 8. 850°C. 91·07. 3·2. 1·07. 1·95. 0·17. 0. 1·41. 15·38. 0·03. 0·17. 67·69. 12. AlT(2·75). An(26). Gro(26). 88·52. 2·19. 0·56. 1·59. 0·14. 0. 0·86. 14·74. 0. 0·18. 68·27. 8. 900°C. 89·9. 2·22. 0·83. 1·63. 0·14. 0·04. 0·96. 14·89. 0. 0·18. 68·96. 12. Gro(24). 90·32. 4·39. 3·2. 2·3. 0·29. 0·05. 1·92. 13·91. 0. 0·18. 65·08. 8. 800°C. 20 kbar. 89·21. 3·61. 4·92. 1·7. 0·58. 0. 2. 14·63. 0. 0·43. 66·29. 12. AlT(3·2). Gro(20). 91·57. 3·68. 3·11. 1·33. 1·26. 0·06. 1·67. 15·31. 0·04. 0·33. 64·78. 8. 900°C. 92·33. 3·21. 4·53. 4·8. 1·76. 0·07. 1·27. 15·21. 0·03. 0·62. 60·83. 12. Compositional variables for coexisting solid phases (Plg, Hbl, Grt) are indicated. The analyses were acquired using a 15 keV acceleration potential and 10 nA beam current with beam-sizes 8 lm and 12 lm. Values are averages of 10 analyses.. 1·95. FeO. 0. Cr2O3. 14·49. 0·51. TiO2. Al2O3. 66·76. 68·39. SiO2. 0·43. 12. size (lm): 8. Beam. 800°C. 900°C. 800°C. 875°C. 15 kbar. 10 kbar. Table 5: Compositions of granitic liquids (glass) from this work at 10, 15 and 20 kbar, at various temperatures and 4 wt % H2O. GARDIEN et al. MELTING OF GNEISSES.
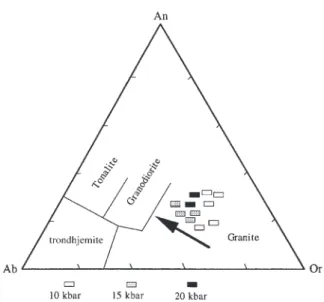
(14) JOURNAL OF PETROLOGY. VOLUME 41. Fig. 5. Normative orthoclase, albite and anorthite contents (wt %) of experimentally produced melts. Fields after Barker (1979).. in the melt fraction, and the resultant dilution causes an overall decrease of the K2O content of the melt. In summary, partial melts at all pressures and temperatures are Al2O3–SiO2 rich and CaO–MgO poor, and coexist with garnet and amphibole or clinopyroxene at high pressure (20 kbar). From Fig. 5 we observe a rather homogeneous granitic composition of the melt varying from an orthoclase-rich composition at 10 kbar to an orthoclase-poor (tending towards granodioritic) composition at 15 and 20 kbar. Estimated H2O contents for experiments with 4 wt % added H2O, based on mass balance calculations, are in the range 6–9 wt % H2O in the melt. This compares reasonably with the total of the microprobe analyses of the quenched glasses (Table 5), which are in the range of 89–93, indicating H2O contents of 7–11 wt %. The H2O contents are below the saturation levels (Burnham, 1979) at the pressures and temperatures of our experimental runs, with decreasing aH2O with increasing pressure.. DISCUSSION AND CONCLUSIONS The principal aim of this study was to delimit the conditions of amphibole formation during partial melting of a previously amphibole-free biotite–plagioclase–quartz assemblage that has a widespread occurrence in Archaean to recent gneiss terranes. Experimental (Naney, 1983; Conrad et al., 1988; Johnston & Wyllie, 1988; Van der Laan & Wyllie, 1992) and field (Mogk, 1992) studies demonstrate that the bulk composition is not the dominant factor controlling amphibole stability in these rocks:. NUMBER 5. MAY 2000. hornblende is observed as a constituent of migmatites formed in a variety of amphibole-free intermediate to granitic and pelitic source rocks, such as peraluminous, pelitic metasediments (Schumacher & Robinson, 1987; Visser & Senior, 1990) and metaluminous, granodioritic plutonic rocks (McGregor, 1979). The results of the present and previous (Naney, 1983; Conrad et al., 1988; Johnston & Wyllie, 1988; Van der Laan & Wyllie, 1992) experimental studies, however, imply that at all pressures relevant for melting within the crust, the addition of external H2O is required to stabilize amphibole during the anatexis of biotite–plagioclase–quartz assemblages. One possible source for the additional H2O necessary to produce amphibole during granulite facies anatexis is adjacent rocks in which subsolidus breakdown of hydrous phases is occurring to produce typical granulite facies paragenesis containing K-fsp, garnet, aluminosilicate, pyroxenes and Fe(–Ti) oxides in pelitic and mafic compositions. Amphibole cannot be generated by fluid-absent dehydration-melting of BPQ at any pressure higher than the shallow multivariant intersections with biotite–amphibole dehydration. Although dehydration-melting of BPQ gneisses could generate amphibole at the intersection with the H2O-saturated solidus at relatively low pressures (>1–3 kbar, Kenah & Hollister, 1983; Pattison & Harte, 1988) this would require temperatures in excess of 750°C at depths of <10 km. Such P–T conditions are only attained through mantle magma intrusion or raising of the asthenosphere through continental extension (e.g. Wickham & Oxburgh, 1988; Thompson, 1990). In conclusion, the experimental results at pressures of 10, 15 and 20 kbar and temperatures ranging from 800 to 900°C are in agreement with previous dehydrationmelting studies at fluid-absent conditions, which showed that amphibole is not stable below the fluid-absent solidus in granitic and gneissic systems. The present study reveals that at pressures >8 kbar, amphibole stability does not overlap with conditions of fluid-absent dehydration-melting of BPQ. This places doubt on the possibility considered by Johnston & Wyllie (1988) and Van der Laan & Wyllie (1992) that the amphibole stability field expands into the fluid-absent region for BPQ compositions. However, amphibole generation is favoured with increasing pressures; at 15 kbar and 20 kbar <2 wt % of additional H2O is required to stabilize amphibole, whereas at 10 kbar >2 wt % addition of H2O to the system is necessary. The decreasing amount of additional H2O required to stabilize amphibole in intermediate to granitic calc-alkaline compositions with increasing pressure could be used to estimate the minimum H2O content present in the parent magma at the onset of amphibole crystallization.. 664.
(15) GARDIEN et al.. MELTING OF GNEISSES. REFERENCES Barker, F. (1979). Trondhjemite: definition, environment and hypotheses of origin. In: Barker, F. (ed.) Trondhjemites, Dacites and Related Rocks. Development in Petrology, 6. Amsterdam: Elsevier, pp. 1–12. Bohlen, S. R. & Boettcher, A. L. (1982). The quartz–coesite transformation: a precise determination of an effect of other components. Journal of Geophysical Research 87, 7073–7078. Bohlen, S. R., Essene, E. J. & Boettcher, A. L. (1980). Reinvestigation and application of olivine–quartz–orthopyroxene barometry. Earth and Planetary Science Letters 47, 1–10. Bose, K. & Ganguly, J. (1995). Quartz–coesite transition revisited: reversed experimental determination at 500–1200°C and retrieved thermochemical properties. American Mineralogist 80, 231–238. Burnham, C. W. (1979). The importance of volatile constituents. In: Yoder, H. S. (ed.) The Evolution of the Igneous Rocks (Fiftieth Anniversary Perspectives). Princeton, NJ: Princeton University Press, pp. 439–482. Bu¨sch, W., Schneider, G. & Mehnert, K. R. (1974). Initial melting at grain boundaries, part II: Melting in rocks of granodioritic, quartzdioritic and tonalitic composition. Neues Jahrbuch fu¨r Mineralogie, Monatshefte 8, 345–370. Clemens, J. D. (1990). The granulite–granite connexion. In: Vielzeuf, D. & Vidal, Ph. (eds) Granulites and Crustal Evolution. NATO ASI Series 311. Dordrecht: Kluwer Academic, pp. 25–36. Conrad, W. K., Nicholls, I. A. & Wall, V. J. (1988). Water-saturated and undersaturated melting at 10 kbar: evidence for the origin of silicic magmas in the Taupo Volcanic Zone, New Zealand, and other occurrences. Journal of Petrology 29, 765–803. Dooley, D. F. & Patin˜o Douce, A. E. (1996). Vapor-basement melting of F- and Ti-rich phlogopite + quartz; effects on phlogopite stability and melt composition. American Mineralogist 81, 202–212. Frost, D. J. & Wood, B. J. (1995). Experimental measurements of the graphite C–O equilibrium and CO2 fugacities at high temperatures and pressure. Contributions to Mineralogy and Petrology 121, 303–308. Gardien, V., Thompson, A. B., Grujic, G. & Ulmer, P. (1995). Experimental melting of biotite + plagioclase + quartz ± muscovite assemblages and implications for crustal melting. Journal of Geophysical Research 100(B8), 15581–15591. Holland, T. J. B. & Powell, R. (1998). An internally consistent thermodynamic data set for phases of petrological interest. Journal of Metamorphic Geology 16, 309–343. Hoschek, G. (1976). Melting relations of biotite + plagioclase + quartz. Neues Jahrbuch fu¨r Mineralogie, Monatshefte H.2, 79–83. Johannes, W., Bell, P. M., Mao, H. K., Boettcher, A.. L., Chipman, D. W., Hays, J. F., Newton, R. C. & Seifert, F. (1971). An interlaboratory comparison of piston-cylinder pressure calibration using the albite breakdown reaction. Contributions to Mineralogy and Petrology 32, 24–38. Johnston, A. D. & Wyllie, P. J. (1988). Constraints on the origin of Archean trondhjemites based on phase relationships of Nuˆk gneiss with H2O at 15 kbar. Contributions to Mineralogy and Petrology 100, 35–46. Kenah, C. & Hollister, L. S. (1983). Anatexis in the Central Gneiss Complex, British Columbia. In: Atherton, M. P. & Gribble, A. (eds) Migmatites, Melting and Metamorphism. Nantwich: Shiva, pp. 142–162. Knabe, W. (1970a). Anatexis von Quartz–Plagioklas–Biotites Metamorphiten. Geologisches Jahrbuch 89, 1–32. Knabe, W. (1970b). Reaktionen des Biotites bei der Anatexis. Geologisches Jahrbuch 88, 355–372. Le Breton, N. & Thompson, A. B. (1988). Fluid-absent (dehydration) melting of biotite in metapelites in the early stages of crustal anatexis. Contributions to Mineralogy and Petrology 99, 226–237.. Maaløe, S. & Wyllie, P. (1975). Water content of a granite magma deduced from the sequence of crystallization determined experimentally with water-undersaturated conditions. Contributions to Mineralogy and Petrology 52, 175–191. McGregor, V. R. (1979). Archean gray gneisses and the origin of the continental crust: evidence from the Godthaab region, W Greenland. In: Barker, F. (ed.) Trondhjemites, Dacites and Related Rocks. Amsterdam: Elsevier, pp. 169–204. Mehnert, K. R., Bu¨sch, W. & Schneider, G. (1973). Initial melting at grain boundaries of quartz and feldspar in gneisses and granulites. Neues Jahrbuch fu¨r Mineralogie, Monatshefte 4, 165–183. Mogk, D. W. (1992). Ductile shearing and migmatization at mid crustal levels in an Archean high grade gneiss belt, northern Gallatin Range, Montana, USA. Journal of Metamorphic Geology 10, 427–438. Naney, M. T. (1983). Phase equilibria of rock forming ferromagnesian silicates in granitic systems. American Journal of Sciences 283, 993–1033. Naney, M. T. & Swanson, S. E. (1980). The effect of Fe and Mg on crystallization in granitic system. American Mineralogist 65, 639–653. O’Neill, H. St (1987). Quartz–fayalite–iron and quartz– fayalite–magnetite equilibria and the free energy of formation of fayalite (Fe2SiO4) and magnetite (Fe3O4). American Mineralogist 72, 67–75. O’Neill, H. St & Pownceby, M. I. (1993). Thermodynamic data from redox reactions at high temperatures. I. An experimental and theoretical assessment of the electrochemical method using stabilized zirconia electrolytes, with revised values for the Fe–‘FeO’, Co–CoO, Ni–NiO and Cu–Cu2O oxygen buffers, and new data for the W–WO2 buffer. Contributions to Mineralogy and Petrology 114, 296–314. Patin˜o Douce, A. E. (1993). Titanium substitution in biotite: an empirical model with application to thermometry, O2 and H2O barometries, and consequence for biotite stability. Chemical Geology 108, 132–162. Patin˜o Douce, A. E. & Beard, J. M. (1995). Dehydration-melting of biotite gneiss and quartz amphibolite from 3 to 15 kbar. Journal of Petrology 36, 707–738. Patin˜o Douce, A. E. & Johnston, A. D. (1991). Phase equilibria and melt productivity in the pelitic system: implications for the origin of peraluminous granitoids and aluminous granulites. Contributions to Mineralogy and Petrology 107, 202–218. Pattison, D. R. M. & Harte, B. (1988). Evolution of structurally contrasting anatectic migmatites in the 3 kbar Ballaguish aureole, Scotland. Journal of Metamorphic Geology 6, 475–494. Schmidt, M. W. (1992). Amphibole composition in tonalite as a function of pressure: an experimental calibration of the Al-in-hornblende barometer. Contributions to Mineralogy and Petrology 110, 3304–3310. Schumacher, J. C. & Robinson, P. (1987). Mineral chemistry and metasomatic growth of aluminous enclaves in gedrite–cordieritegneiss from southwestern New Hampshire, USA. Journal of Petrology 28, 1033–1073. Skjerlie, K. P. & Johnston, A. D. (1993). Fluid-absent melting behavior of an F-rich tonalitic gneiss at mid-crustal pressures: implications for the generation of anorogenic granites. Journal of Petrology 34, 785–815. Steuhl, H. (1969). Die experimentelle Metamorphose und Anatexis eines Parabiotitgneises aus dem Schwarzwald. Chemie der Erde 21, 413–449. Thompson, A. B. (1982). Dehydration melting of crustal rocks and the generation of H2O-undersaturated granitic liquids. American Journal of Science 282, 1567–1595. Thompson, A. B. (1988). Dehydration melting of crustal rocks. Rendiconti della Societa Italiana di Mineralogia e Petrologia 43, 41–60. Thompson, A. B. (1990). Heat, fluids, and melting in the granulite facies. In: Vielzeuf, D. & Vidal, Ph. (eds) Granulites and Crustal Evolution. NATO ASI Series 311. Dordrecht: Kluwer, pp. 37–57.. 665.
(16) JOURNAL OF PETROLOGY. VOLUME 41. Thompson, A. B. (1996). Fertility of crustal rocks during anatexis. Transactions of the Royal Society of Edinburgh: Earth Sciences 87, 1–10. Ulmer, P. & Luth, R. W. (1991). The graphite–COH fluid equilibrium in P, T, fO2 space: an experimental determination to 30 kbar and 1600°C. Contributions to Mineralogy and Petrology 106, 265–272. Van der Laan, S. R. & Wyllie, P. J. (1992). Constraints on Archean trondhjemite genesis from hydrous crystallization experiments on Nuˆk Gneiss at 10–17 kbar. Journal of Geology 100, 57–68. Vielzeuf, D. & Holloway, J. R. (1988). Experimental determination of the fluid-absent melting reactions in the pelitic system. Contributions to Mineralogy and Petrology 98, 257–276. Vielzeuf, D. & Montel, J. M. (1994). Partial melting of metagreywackes. Part I: Fluid absent experiments and phase relationships. Contributions to Mineralogy and Petrology 117, 375–394. Visser, D. & Senior, A. (1990). Aluminous reaction textures in orthoamphiboles-bearing rocks: the pressure–temperature evolution of the high-grade Proterozoic of the Bamble sector, south Norway. Journal of Metamorphic Geology 8, 231–246. Weast, R. C. (1988). CRC Handbook of Chemistry and Physics. Boca Raton, FL: CRC Press. Wickham, S. M. & Oxburgh, E. R. (1988). Evolution of the lower crust. Nature 333, 119–120.. 666. NUMBER 5. MAY 2000. APPENDIX: ABBREVIATIONS FOR MINERALS USED IN FIGURES AND TABLES Qtz. quartz. Hbl. hornblende. Plg. plagioclase. Als. aluminosilicate (Al2SiO5). Ksp. alkali feldspar. Apt. apatite. Bio. biotite. Alm. almandine. Liq. liquid (granitic melt). Amp. amphibole. Epi. epidote. Tit. titanite (sphene). Cpx. clinopyroxene. Phe. phengite. Crd. cordierite. V. H2O vapour. Gar. garnet.
(17)
Figure
+5
Documents relatifs
The problem is that since the limit of at zero does not exist (if you look at the graph of the function you’ll see that it oscillates wildly near zero) we have no right to
Palaeontologists and neontologists have claimed that large lung-breathing marine tetrapods such as ichthyosaurs had a lower density than seawater, implying that their carcasses
Figure 1 : Nombre de demandes d’activité partielle pour motif de Coronavirus depuis le 1 er mars et nombre de salariés concernés.. Source : ASP-DGEFP-Dares – Extraction du SI
1) At the melting point the resonance signal drops to an unmeasurable small value in a very limited temperature interval. Line broadening by diffusion could not be
&sum6 - L'indice de rdfraction nl et lldpaisseur de la couche de transition (Q.L.L.) h la surface dlun cristal de glace h tdrature juste en-dessous du point de fusion
Enstatite transformation toward a disordered structure begins at 80±13 GPa, well below melting conditions, with the 194. appearance of two diffuse rings, labelled P1
Enstatite transformation toward a disordered structure begins at 80±13 GPa, well below melting conditions, with the 194. appearance of two diffuse rings, labelled P1
To investigate how the different release kinetics of R848 from the NP affect cell stimulation over time, we incubated burst-free NP in cell culture medium at 37 °C for 1 to 24
