Structural dynamics of calmodulin and troponin C
Ernest L.Mehler1, Hare! Weinstein2
Juan-Luis Pascual-Ahuir and
Department of Physiology and Biophysics, Mount Sinai School of Medicine of the City University of New York, New York, NY 10029, USA
'Permanent address: Department of Structural Biology, Biocenter, University of Basel, Basel, Switzerland
2To whom correspondence should be addressed
We present the results of computational simulation studies of the structures of calmodulin (CAM) and troponin C (TNC). Possible differences between the structures of these molecules in the crystal and in solution were suggested by results from some recent experimental studies, which implied that their conformations in solution may be more compacted than the characteristic dumbbell shape observed in the crystal. The molecular dynamics simulations were carried out with the CHARMM system of programs, and the environment was modeled with a distance-dependent dielectric permittivity and discrete water molecules surrounding the proteins at starting positions identified in the crystals of CAM and TNC. Methods of macromolecular structure analysis, including linear distance plots, distance matrices and a matrix representation of hydrogen bonding, were used to analyze the nature, the extent and the source of structural differences between the computed structures of the molecules and their conformations in the crystal. Following the longest simulation, in which intradomain structure was conserved, the crystauographicaUy observed dumbbell structure of the molecule changed due to a kinking or bending in the region of the central tether helix connecting the two Ca2+-binding domains which moved into close proximity. The resulting structure correlates with experimental observations of complexes between CAM and peptides such as melittin and mastoparan. Analysis of the corresponding pair distance distribution functions in comparison to experimental results suggests the dynamic existence of a non-negligible fraction of the compacted structure in aqueous solutions of CAM. In this more nearly globular shape, CAM reveals to the environment two interior pockets that contain a number of hydrophobic residues, in agreement with NMR data suggesting involvement of such residues in the binding of inhibitors and proteins to CAM.
Key words: Ca2+-binding domains/calmodulin/dumbbell
structure/molecular dynamics simulations/troponin C
Introduction
Calmodulin (CAM) and troponin C (TNC) are small, acidic proteins consisting of 148 and 162 amino acid residues respectively; each binds four Ca2+ ions per molecule (Strynadka
and James, 1989). Calcium binding is essential for the activation of these proteins to perform a variety of physiological functions [for reviews see Cox etal. (1988); Wnuk (1988) and references therein]. Some experimental evidence suggests that both proteins undergo conformational changes induced by the binding of
Ca2 +, and that the structural modifications expose hydrophobic
groups that are essential for the interactions of CAM and TNC with proteins and ligands (LaPorte et al., 1980; Tanaka and Hidaka, 1980; Burger et al., 1984; Dalgarno et al., 1984b; Follenius and Gerard, 1984). The two proteins have different affinities for Ca2+, in that TNC contains two high-affinity sites (Kj ~ 10~7 M) and two low-affinity sites ( ^ ~ 10~5 M)
(Wnuk, 1988), whereas in CAM the IQ values of all sites are much more similar and are in the range 10~5—10~6 M (Cox et al., 1988).
The crystallographic structures reported recently for CAM (Babu et al., 1988) and for TNC (Herzberg and James, 1988) represent some interesting variations in the usual structural patterns observed in globular proteins (Creighton, 1984). In particular, the structures observed in the crystals are far from being optimally packed and exhibit a characteristic dumbbell shape. The two lobes consist of calcium-binding domains comprised of pairs of EF-hands (Kretsinger, 1982) connected by a linking helical structure that is mostly exposed to solvent. The centers of mass of the two domains are separated by ~ 40 A. However, indirect evidence for a compaction in the structure of CAM comes from experiments in which mutations and chemical modifications were used to produce structural rearrangements such as a forced bending of the D/E helix tether (Persechini and Kretsinger, 1988a,b).
Results from several recent small angle X-ray scattering (SAXS) studies on CAM and TNC have suggested possible differences between the extended dumbbell structures in the crystal, and conformations adopted in solution. The studies have been carried out on uncomplexed CAM (Seaton et al., 1985; Heidorn and Trewhella, 1988; Matsushima et al., 1989) or TNC (Hubbard et al., 1989), with various stoichiometries of bound Ca2+, and also on CAM complexed with melittin (Kataoka et al., 1989), with mastoparan (Matsushima et al., 1989) and with a synthetic peptide corresponding to residues 577—603 of rabbit skeletal muscle myosin light chain kinase (Heidorn et al., 1989). Taken together, the results for the uncomplexed proteins present an unclear picture. They may indicate some compaction of the structures in solution (Heidorn et al., 1989; Matsushima et al., 1989), but this cannot be concluded with certainty due to differences in the results obtained from SAXS experiments that led to different conclusions presented by their authors (Seaton et al., 1985; Hubbard et al., 1988; Kataoka et al., 1989). However, CAM complexed to proteins unequivocally exhibits compaction in the same type of experiments. The evidence from such experiments seems to agree on a decrease by — 4 A in the radii of gyration of the complexed proteins, consonant with a compaction that reduces the maximal distance in the CAM molecule by - 2 0 % . Additional evidence for compaction of the uncomplexed protein at physiological pH in solution comes from resonance energy transfer studies. Using Tb3 + as donor
positioned in the Ca -binding sites of the N-terminal domain of TNC, and an acceptor attached to Cys98 in the C-domain, Wang et al. (1987) observed a decrease in the distance between
E.L.Mehler, J.-L.Pascual-Ahuir and H.Weinstein
the donor and acceptor of 25 ± 10 A in going from a pH of 5.0 to 6.8. More recently, Wang (1989) used the same method to show a similar compaction of CAM at neutral pH. As the pH was lowered to 5, the structure was found to stretch out, and was reported to be more similar to that observed in the crystal (Wang, 1989).
Experimental studies as well as computational simulations performed on globular proteins suggest that their solution structures do not vary too much from the observed crystal structures (McCammon, 1987; Brooks et al., 1988). Given the extended architecture of CAM and TNC, it is reasonable to ask if this preservation of structure also holds for these two proteins, or if interactions between solvent and the exposed D/E helix tether (Babu etal., 1988; Herzberg and James, 1988) lead to differences between solution and crystallographic structures. The elucidation of structure — function relationships for these molecules requires information on the major structural changes that could occur in different solution environments as a result of calcium binding (e.g. see Klevit, 1987). We present here the results of a study of the structures of Ca2+-bound CAM and TNC in solution
performed with computer simulation techniques in order to help identify the most likely modifications of the structures observed in the crystal. Such simulations explore the energetic accessibility of the modified structures, and touch on their possible functional relevance. The computational exploration is particularly timely because the complete structural characterization of these proteins in solution still presents a major challenge for current NMR techniques (Wright, 1989). Cm the other hand, the results available from the experimental studies have provided elements of structural information at atomic resolution that are essential for the performance and calibration of computational simulations. For such studies, the results from SAXS and energy transfer studies serve as points of comparison to help solve the central problem of such computational simulations, i.e. validation of the resulting structures.
Materials and methods
Energy minimization and dynamics in model solvent environments All calculations were carried out with the CHARMM system of programs using default parameters (Brooks et al., 1983), i.e. the nonbonded interaction cutoff is 7.5 A used with the CHARMM shift function, except where noted. The paramet-rization of Ca2+ was taken from Hori et al. (1988). Preliminary
energy minimization was carried out to relax the coordinates of crystallographic water molecules, as well as residues 1 - 4 and
148 of CAM, which had to be placed by optimization because no crystallographic coordinates had been reported for them. Prior to any dynamics runs, full energy optimizations were carried out for all the structures to relax them in the model environments used to account for solvent effects as described below. Each structure was first heated in 5° steps over a period of 6 ps to 300 K, equilibrated (20-80 ps) and the dynamics simulation was continued until the structure had stabilized or was rejected according to the criteria for structure selection given in a subsequent section. A structure was considered stable if the average coordinates from a 40 ps trajectory showed atomic r.m.s. deviations of < - 0 . 8 A for most atoms. In all cases the structures stabilized after ~ 100-150 ps of dynamics, but in some cases the dynamics trajectories were continued in order to ensure that the structure remained stable over an additional 100-150 ps. Not only structural r.m.s. fluctuations but also those of the energy were monitored and found to remain stable over this time period. Finally, the average structure was optimized
to eliminate obvious stereochemical artifacts such as flips of carboxylate oxygens. No external constraints were used in the calculations, and each of the runs defined in Table I was carried out independently.
Consideration of the effect of solvent
The most direct way to account for solvent effects in computer simulations is explicidy to include enough waters to surround the entire molecule with several solvation layers that reproduce the effect of solvent. Due to the large size of the noncompacted structure of CAM or TNC, such an approach would require 8000—10 000 water molecules. Consequendy, it is more appropriate for the initial calculations reported here to model the solvent effect using simpler approximations (Mehler and Eichele,
1984; Harvey, 1989; Mehler, 1990).
A linear, distance-dependent dielectric permittivity (e) was used to screen the electrostatic component of the potential, thereby partially accounting for bulk effects. The crystallographically observed waters were used to model some of the specific inter-actions between protein and the first solvation layer (coordinates for 69 and 157 crystal waters were included with the X-ray structures of CAM and TNC respectively). For each protein two cases were considered: (i) e = r without crystal waters, referred to as CAM-1 or TNC-1, in runs 1 and 4; and (ii) e = r with crystal waters, referred to as CAM-2 or TNC-2 in runs 2 and 5 (see Table I). Thus, the simulations are carried out essentially in vacuum, with solvent effects modeled as outlined in points (i) and (ii) above.
Methods for macromolecular structural analysis
All r.m.s. differences listed in the tables were calculated on the basis of alpha-carbon positions only. Inclusion of all backbone atoms in the comparison was found to produce only marginal differences in the r.m.s. values. The first four residues of CAM, which were very mobile and not reported in the crystallographic structure, were omitted from the interdomain r.m.s. calculations. For detailed structural analyses we used the results from the following methods that are based on two-dimensional transforms of the structures.
The linear distance plot (LDP). The LDP serves to analyze the secondary structure of a polypeptide from atomic coordinates. The spectrum-like aspect of the plot lends itself to pattern-recognition analysis that can be used to identify components of secondary structure and define their boundaries. Repeated motifs of secondary structure are readily located in the results of the LDP analysis, and protein structures can be compared without considering their amino acid sequences by identifying regions of insertions and deletions, as well as conformational changes. The procedure has been described in detail elsewhere (Liebman et al., 1985), and is briefly oudined here. The analysis starts with the partitioning of the protein structure into segments (neighborhoods) containing N amino acids following an alpha-carbon, from residue 1 in the sequence to (N^-N), where NM is the total number of amino acids in the polypeptide. The sum of the distances (5) between the alpha-carbon origin of a neighborhood and each of its neighbors yields a characteristic value that reflects the conformation of the polypeptide chain within each segment. For example, for an ideal alpha-helix containing 10 amino acids (N^, = 20), and a selected segment size of 4 (N = 4), the sum of distances (5) will be identical for residues 1 - 6 because the components, i.e. the distances between alpha-carbons in the alpha-helix, are constant. The parameter 5 reflects the overall curvature of the polypeptide chain because the values are unique to a certain folding pattern constructed from
'virtually bonded' alpha-carbon atoms. By plotting 5 calculated for each neighborhood versus the residue number of the atom of origin of the segment, one obtains a spectrum-like decomposition of the overall conformation that can be interpreted by comparison to 5 values obtained from structures of ideal homopolymers [see Figure 7 in Liebman et al. (1985) for an example of such a calibration]. A difference LDP (DLDP) can be obtained by subtracting the value of the 5 parameter for each corresponding residue in the compared species. This provides a fine definition of the degree of similarity and the extent of the regions in which the two structures, 51 and 5 1 ' , differ.
The distance matrix (DM) analysis. This is a convenient transformation of the three-dimensional structural data as described by Phillips (1970), Nishikawa et al. (1972) and Kuntz (1975) for representing the organization of protein secondary and tertiary structure into structural domains. The method was shown to be useful for comparisons of both homologous and non-homologous protein structures (Liebman and Weinstein, 1985; Liebman et al., 1985). The algorithm for the construction of DM is based on the list of all alpha-carbons in the order of the amino acid sequence, from amino to carboxy terminus. For a protein composed of N amino acid residues, the matrix is square, symmetrical and of order N, with each ijth element being the distance between the alpha-carbon (/) and the alpha-carbon 0); all the diagonal elements are zero. A graphic version of the matrix is achieved by generating graphic elements (symbols or colors) representing distances within certain preset ranges, i.e. a different symbol, color or shading for each range. The matrix highlights regions of contact within the structure that are close together in three-dimensional space, although they may be distant in amino acid sequence. Short distances between distant residues result from the tertiary folding of the protein. The contours that appear farther from the diagonal represent close distances between sequence-distant i and j residues and are therefore indicative of the tertiary structure and the folding of the protein. From analysis of a great number of polymers and comparisons with known structures, certain shading patterns have been identified as corresponding to well-defined structures such as alpha-helices, parallel and antiparallel beta-sheet structures, etc., as well as tertiary structural patterns resulting from the interactions of sheets, turns and helices [see Liebman et al. (1985) and references therein].
Hydrogen-bonding patterns
Hydrogen bonding is known to be of primary importance in stabilizing both secondary and tertiary structure in proteins, and H-bonding patterns are characteristic of various structural motifs commonly found in proteins. An easily interpretable representation of such patterns is obtained by recasting them in a distance matrix (DM)-like format. Since the details of the technique with a number of applications are presented elsewhere (Factor and Mehler, 1991) only a brief description is given here. A scan is made for all potential proton donor —acceptor pairs in the protein and they are classified as being H-bonded if the pairs fall within pre-assigned thresholds for separation and bond angle (default values are: separation s 3 . 3 A; angle s 120°). The H-bonds can be further identified for each residue as main chain —main chain (m-m), main chain—side chain (m-s) or side chain—side chain (s-s) and combinations of these types. A plot following the same principles as the DM plot described above is generated from the list of H-bonds, with the type indicated by an appropriate color or symbol. Both the normal DMs and H-bond DMs are used below to discuss secondary and tertiary
Table I. Definition of the runs and model environments in the various schemes, and global comparisons of results from dynamics runs to the crystal structures CAM and TNC
Scheme Run Model* Trajectory R.m.s. (A)b
CAM CAM-0 CAM-1 CAM-2 Tether TNC TNC-1 TNC-2 0 1 2 3C 4 5 environ- length (ps) mem f = 1 83 e = r 283 t = r; 366 (H2O)n e = r, 306 e = r 286 e = r; 246 (H2O)t N-domain (EF1) (EF2) 5.4 (3.4) (4.1) 5.4 (3.1) (3.0) 3.1 (3.0) (23) 2.7 (2.4) (1.2) 2.5 (2-0) (1.2) Tether 3 0 1.0 2.4 4.6 0.6 2.1 C-domain (EF3) (EF4) 4.2 (3.9) (1 9) 5 2 (4.0) (23) 2.5 (1.6) (1.6) 3.7 (2-4) (4.1) 2.5 (1.2) (2-6)
'(H2O)j are the crystaUographk waters, with n = 69, m = 7 and k = 157. bAll values are relative to the corresponding structure in the crystal.
This run is for a structure including only the linker helix residues 73-84.
TaWe II. Interdomain separations, radii of gyration and maximum
calculated from the Ca2+-bound structures in the various dynamics Run CAM X-ray 0 (CAM-0) 1 (CAM-1) 2 (CAM-2) Solution (CAM Solution (CAM Solution (CAM TNC X-ray 4 (TNC-1) 5 (TNC-2) Solution (TNC
runs for CAM and TNC and in
only/1 + melittin)1 + mastoparan/ only)* Interdom." sep.-CM (A) 37.6 37.8 30.5 24.6 40.7 35.3 28.6 crystal, in results solution Ki 22, 22 20 17 21 17 17 22 20 18 23 '(A) .0 .2 .3 .2 3 ± 0.2 .85 ± 0.13 .8 ± 0.3 .7 .8 .2 ± 0.3 distances from the 4.C(A) 64.4 70.9 75.7 57.9 63 ± 2 47.5 67.8 63.1 58.8 70 •Separation of centers of mass of domains.
''Radius of gyration calculated with CHARMM, excluding waters.
cMaximal intratomic distance in the molecule. dHeidom and Trewhella (1988)
eKataoka « al. (1989).
fMatsushima a al. (1989).
«Hubbard et al (1988).
structural changes observed in CAM and TNC that result from the different runs defined in Table I.
Criteria for structure selection
It is clear that if the solution structure of a system differs considerably from the crystal structure, this difference will be reflected in r.m.s. deviations larger than the 1-1.5 A values usually found from molecular dynamics simulations of systems in which the solution structure simply fluctuates around the one established from crystallography. Computer simulation used to search for possible deviations of solution structures from crystallographic ones must consider the following conundrum:
E.L.Mehler, J.-L.Pascual-Ahuir and H.Weinstein
i'.s tooB to 16.00 to 2< ooB to 2 ooi to c.ooB
H B 5 - S B IH .'•»$£ H / 5 - S mm/s-sB
n m CUE o a e.ooB to it K to 24.008 to s.oo* to «.ooB
ffigtt I H J i H l 5-SB IH /iKii H / S-S / H / s-sB
V ^ - j - - 4- -4 - I - I - J- 4- - I - i _J _ l _ I— J_ _L —1 I— 4—
iti e.00B ti 1600 to H.tofl U> 32.M* tl « { * •
B »-sB i-sB M / >-i •• H / s-s >-s / s-s* H / K-S / s-sB
Fig. 1. Distance matrix representations of the molecular structure of CAM (lower triangle) and hydrogen bonding distance matrices for the corresponding structures (upper triangle). The color code is identified on top for the distance matrix (DM) and the hydrogen bond matrix (HBM). Note that the diagonals of the upper and lower triangles are offset for clarity. The representations are for the following energy minimized structures of CAM: (A) from the crystal structure coordinates; (B) CAM-1, after dynamics run 1; (C) CAM-2, after dynamics run 2; according to definitions in Table I.
artifactual structures that reflect the shortcomings of the simulation techniques must be identified and rejected, but the criteria of acceptability cannot be so stringent as to eliminate potentially reasonable candidates for alternative structures. As we aimed to search for plausible alternative structures, we based the selection on structural criteria rather than on the r.m.s. differences. Thus, we selected for analysis structures that showed compactions in which the two Ca-binding domains moved closer together due to a bending or kinking in the region of the linker (residues 7 5 - 8 5 in CAM; 85 - 9 5 in TNC), achieved with con-servation of intradomain secondary and tertiary structure. Candidate structures were rejected if they appeared to be
denatur-ing as indicated by loss of secondary and/or tertiary structure. A secondary level of comparison in support of this selection process is provided by the structural similarity of the domains of CAM, both of which are also similar to the Ca2+-bound
C-terminal domain of TNC. The preservation of this interdomain similarity according to the structure-selection process thus bears on the validity of the dynamics structure.
Experimentally observed solution structures are not available for CAM or TNC. In the absence of even a simulation study using explicit water molecules, no control structures are available to evaluate the validity of the approximate structures obtained here. To have some indication, albeit a negative one, of the
OH CSOE: o to e.t»B to u.to to 2t.«M to i oo" m « . « • ntm I H J H-M s - J H / » - S P H / S - S
R n tat t to e.od to is oc t> uoM to s . »r to « i d
BCIIE IHJ »-M i l H / H l H/H H / ^ # M/IH/S-J t r v r ' ' ' ' •••" > • _ • ' ^ ^ ' ' • i J _ _ ' _ i_ L L _L _ _ J _ l _ ' _ i _ _ ! _ [ _ i _ l_ L _ . „ _ _ ' _ • _ • _ . _ < _ H 9
:--7
" I T I
-—^ —i —! — (— -o t-o e.Mi t-o i t » wait u.vM to 2Mb to v.otl J M/S-5 W-S / 5-sS H / H / •Fig. 2. Distance matrix and hydrogen bond matrix representations as described in Figure 1, for the following energy-minimized structures of TNC: (A) from the crystal structure coordinates, (B) TNC-1, after dynamics run 4; (C) TNC-2, after dynamics run 5; according to definitions in Table I.
reliability of the present approximations, the simulation of CAM in vacuum (CAM-0) has also been carried out, and the results are described.
Results and discussion
Overview of results from dynamics simulations
In remarkable contrast to commonly reported results from molecular dynamics calculations on globular proteins, all the simulations of CAM and TNC exhibited profound changes from the starting structures obtained from the corresponding crystallo-graphic data. The definitions of model environments, trajectory lengths and differences, resulting from r.m.s. superpositions of
the structures in the crystal on those obtained from dynamics runs for both proteins, are summarized in Table I.
The changes were initially monitored by extracting a coordinate set from the trajectory every 5 ps and calculating the distance between the centers of mass (CM) of the two Ca2+-binding
domains. With the exception of CAM-O, the interdomain center of mass separations started to decrease after - 2 0 - 4 0 ps of dynamics. The domains appeared to have come to their new equilibrium positions after — 100-150 ps of dynamics. Table II presents three quantities related to the overall dimensions of the equilibrium structures of CAM and TNC. Comparison of the values of these quantities obtained from the dynamics runs, to the values from the X-ray structure shows that, except
E.L.Mehler, J.-L.PascuaJ-Ahuir and H.Weinstein
A
B
.CA MAIN 65MAIN.89
Fig. 3. Superposiuon of the alpha-carbon structures of (A) CAM (in green) and TNC (in red) obtained from CAM-2 and TNC-2. The criterion for
superposition was the best fit of the C-terminal domain. (B) The central linker region (residues 65-89) from the crystallographic structure (heavy line), and from CAM-2, and CAM-a to CAM-d. The superposition was optimized for best fit of the linker helbc, residues 7 3 - 8 4 in all six structures
for CAM-O, the overall dimensions of the molecules have decreased. Thus, the conformational changes produced by dynamics runs in the model environments have moved the N-terminal and C-terminal domains closer together yielding a more compacted structure.
For both CAM and TNC the structures with e = r and including crystal waters were much more compacted than the structures obtained excluding the crystallographic waters. The r.m.s. differences between the C- and N-terminal domains of structures from dynamics and from crystallography become large for CAM-0 and CAM-l, whereas for CAM-2 and both TNC structures they are substantially smaller (Table I). In the structures obtained for CAM-l and TNC-1 the r.m.s. deviation of the central tether helix D/E is very small, although both structures exhibit some compaction. This indicates that the compaction in runs 1 and 4 cannot be due to bending or kinking of that helix, but must be due to some other deformation.
All the discrete solvent molecules included in runs 2 and 5 for CAM and TNC remained in contact with the protein throughout the trajectories. The average distances of the water oxygen from the nearest protein atom in the crystal structures were 3.1 ± 0.8 and 3.2 ± 0.8 A for CAM and TNC respectively. The initial minimizations moved the water molecules closer to the protein, to average distances of 2.8 ± 0.3 and 2.9 ± 0.4 A respectively. These average distances did not change much during the simulations, and reached final values of 2.7 ± 0.3 and 2.8 ± 0.3 A. Although many of the individual water molecules moved considerably throughout the trajectories, most of the residues that were observed to be in contact with one or more water molecules in the crystal structure were still making such contacts in the final average structure (e.g. 65% in CAM-2).
Comparison of the r.m.s. values in Table I illustrates the difficulty inherent in relying exclusively on this quantity when simulation has generated structural changes. The r.m.s. data suggest two types of change leading to very large r.m.s. for CAM-0 and CAM-l, and intermediate r.m.s. values for the other structures. Yet the data in Table II suggest that CAM-0 is very different from CAM-l, and reflects similar disparities for the other structures. In fact the quantities in Table n suggest three groups, each with similar simulation results: CAM-0; CAM-l and TNC-1; and CAM-2 and TNC-2. As will be shown below, this classification from Table D more closely reflects the effects of simulation on the structures of CAM and TNC than the classification implied by the r.m.s. values.
The structure of the isolated CAM tether helix D/E (residues 73-84) was also explored separately in run 3, with simulations under the same conditions as used in run 2 (Table I), in order to probe the effects of the interactions of this helix with the two Ca-binding domains. The resulting r.m.s. deviations are > 4 A from both the structure in the crystal and CAM-2, indicating that changes in the tether reflect both the effects of a solvent environment and the results of intramolecular interactions.
The r.m.s. comparisons listed in Table I are further decomposed to provide values for each EF hand. The results show that in a number of cases these r.m.s. differences are substantially smaller than the r.m.s. of the whole domain, indicating that the main conformational change occurs in the region linking the two EF hands contained in the domain. The flexibility of such a linker region in solution has also been demonstrated recently from NMR measurements in the related structure of the EF-hand Ca2+
-binding protein calbindin where this linker region was shown to be structurally the most labile (Chazin et al., 1989). Since such linker segments form part of the surface of the domain
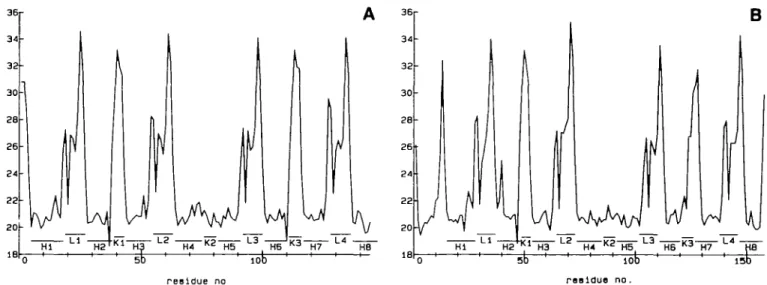
IB residue no H4 K2 H3 L 3 H6 * 3 H7 L* HB 63 83 reaidue no. 1 0r
B
Fig. 4. Linear distance plot representations of CAM (A) and TNC (B) from the crystaJlographic coordinates. Elements of secondary structure arc identified as H (helix), L (loop) and K (linker segment). The tether helix includes helices H4 and H5, as well as the linker region K2.and are exposed to solvent, their greater flexibility seems to be reasonable. Furthermore, because the EF hands are the functional units of these Ca2+-binding proteins, with significant
conservation of structure in the Ca-binding domains, it is gratifying to find that during the dynamics simulations these local structures are preserved, in spite of the major changes induced in the other portions of the molecules.
As will be shown below, the structures of CAM-2 and TNC-2 most closely satisfy the conditions for acceptably modified structures as outlined in Materials and methods. The degree of compaction indicated by the quantities listed in Table II is found to be considerably smaller for CAM-1 and TNC-1 than for CAM-2 and TNC-2 respectively. Comparison of the calculated radii of gyration (Rg) with results from experiments in solution (Table H) suggests that the degree of compaction of CAM-2 is closer to that observed for Ca-bound CAM complexed with small peptides (Heidom etal., 1989; Kataoka et al., 1989; Matsushima et al., 1989), whereas the Rg from CAM-1 is still closer to the values for uncomplexed CAM in solution. In contrast, the average change in separation of Ala88 to the Ca2+ in the N-terminal
domain is ~ 1.5 and 11 A for CAM-1 and CAM-2 respectively. These values can be compared to the change in distance observed by Wang et al. (1987) in TNC [Ala88 in CAM is sequentially aligned with Cys98 of TNC which was the binding site for the energy transfer acceptor used by Wang et al. (1987)]. The comparison suggests that the compaction of CAM-2 is closer to the compaction of TNC at a pH of 6.8 that is implied by the results of Wang et al. (1987). It is noteworthy that compared with the crystallographic structures, the r.m.s. values of the EF-hands in the structures calculated with crystallographic waters (CAM-2 and TNC-2) are substantially smaller for CAM-2 and TNC-2 (1.9 ± 0.7 A) than for CAM-1 and TNC-1 (2.8 ± 0.9 A), although CAM-2 and TNC-2 exhibit greater global changes than CAM-1 and TNC-1. This finding is consistent with the closer adherence of CAM-2 and TNC-2 to the selection criteria defined in Materials and methods.
The contact achieved between the Ca2+-bound domains of
CAM-2 is clearly evidenced by the DM plot for that structure, shown in Figure 1(C) in comparison to the DM of the crystal-lographic structure (Figure 1A). The substantial change in separation between the two domains is larger for CAM than for TNC, as shown by a comparison of results in Figures 1 and 2. In spite of the large changes in tertiary structure following
63 83 r-aaidue no.
123
Fig. 5. Difference linear distance plots calculated for the difference between the structure of CAM in the crystal, and the computed structures from (A) CAM-1 and (B) CAM-2. The broken lines identify the standard deviations, a (see values in Table HI).
dynamics runs in both CAM and TNC (Figures 1C and 2C respectively), the C-terminal domains of CAM-2 and TNC-2 remain remarkably similar, as shown by the superposition of the two domains in Figure 3(A). The interdomain r.m.s. difference between the C-terminal domains of CAM and TNC is 1.4 A for
E.L.MehJer, J.-L.Pascual-Ahuir and H.Weinstein 1 0 r 0 — 20 40 60 BO 100 120 140 residue no
B
K 2 i ^ - L 3 "Sg-Ka-1 20 60 BO 100 120 140 reBldue noPig. 6. Difference linear distance plots for TNC comparing the crystal structure to results from (A) TNC-1 and (B) TNC-2. See legend to Figure 5 for
details.
the crystal structures, and increases only to 2.5 A as a result of the dynamics simulations producing CAM-2 and TNC-2.
Given the absence of bulk solvent in the simulations performed here, it is important to consider whether the structural changes observed in CAM-2 and TNC-2 could be the result of in-appropriately strong electrostatic interactions between fully ionized groups in the two domains. Although this possibility cannot be ruled out entirely because the linear dielectric constant used in the simulations would be too weak to prevent such interaction, a number of considerations suggest that this is an unlikely explanation for the observed compaction. First is the fact that by using a distance cutoff of 7.5 A for the nonbonded interactions, the calculated electrostatic interaction between the charged residues at greater separation is reduced to zero, thus modeling a complete screening which is probably not unreasonable for charges at large separations at physiological ionic strength. In addition, both domains carry a net negative charge ( — 7.748 and —6.748 for the N- and C-terminal domains respectively), so that a net repulsive interaction between them should become operative as they come closer to each other. Second, it has been shown (MehJer, 1990) that in a range of 3 - 1 0 A the distance-dependent dielectric constant does exhibit linear behavior (albeit with a slope of ~6.5), indicating that, in the range of distances within the cutoff used here, the functional form of both the electrostatic energy and its gradient is correct.
Results from a series of simulations presented recently (Pascual-Ahuir and Weinstein, 1991) and discussed in detail elsewhere further support the robustness of the convergence of the CAM structure to a compacted form, by showing that the compaction is obtained from trajectories starting with different initial conditions. All the runs were started from the crystallo-graphic data for the protein and the 69 waters (see Materials and methods), but in some the initial energy minimization was carried out in two steps: first with a frozen tether, and then for the entire structure (e.g. CAM-a). In another group of runs in this series, 14 additional water molecules were hydrogen-bonded to residues in the region of the tether, increasing the total number to 83, and the entire structure was minimized before the start of the simulation (CAM-b; CAM-c). Finally, another group started from a structure obtained from the minimization of the apo-protein and 83 water molecules; after minimization, the four Ca2+ ions were repositioned in the loops and the entire structure
TaWe III. The standard deviation (a) for difference linear distance plots
(DLDP) calculated between the values of LDPs for the crystal structures and the results of the various dynamics runs of CAM and TNC
Run • ( A ) CAM-l CAM-2 TNC-1 TNC-2 1 77 1.49 1 85 I 38
Table IV. H-bond analysis of dynamics runs
Run" Number of H-bonds R.m.s
CAM-0 CAM-l CAM-2 TNC-1 TNC-2 Conserved X-ray-dynb 82 95 116 102 113 Lost in a helixc 27 22 7 24 14 Gained in a helixd 9 14 13 5 3 Lost in D/E linker0 3(11) 2(6) 1 (1) 2(6) 4(6) H-bonds 0.29 0.22 0 23 0.24 021 (mean) (0.15) (0 07) (0.07) (0.04) (0 08) "Run numbers as defined in Table 1
'The number of H-bonds present in both the crystallographic and the dynamics structure.
cNumber of a helix H-bonds found in the crystallographic, but not in the
dynamics structure.
dNumber of helix H-bonds found in ihe dynamics structure, but not in the
crystal.
'Number of helix H-bonds lost from helix tether region: in CAM 77 — 85 (and in the entire stretch 65-92), in TNC 8 7 - 9 5 (and in the entire stretch
75-102).
fR.m s change in H-bond length between crystal and dynamics structures (in A).
was reminimized (CAM-d). All these structures converged to compacted forms with Rg values similar to that calculated here for CAM-2, i.e. 17.7, 17.0, 18.2 and 16.4 for CAM-a to CAM-d respectively. The commonality of the compaction result is evidenced in Figure 3(B) which shows a superposition of the alpha-carbon structures of the central linker regions in the converged average structures from these runs, from CAM-2 and from the crystal structure of CAM.
Most of the structural comparisons show that, on an intradomain basis, the response of CAM and TNC to dynamics
using a given model is very similar. At the same time the overall tertiary structure of TNC does not respond in the same way as CAM (see below). This difference could be due to the fact that the N-terminal domain of TNC has no bound Ca2+. Because of
this relationship in the structural response of the two molecules to dynamics, the discussion below will concentrate on CAM, including results from TNC only to illustrate the most important similarities and differences.
Effects of the simulations on the secondary structures of CAM and TNC
The effect of dynamics on secondary structure is most directly analyzed and represented with the linear distance plots (LDP) and difference LDPs (DLDP) (Liebman et al., 1985). The LDPs calculated for the crystallographic structures of CAM and TNC are presented in Figure 4 (A and B respectively). The remarkable regularity of the helix-loop-helix supersecondary structure in the Ca-binding EF-hand motif is clearly identified from the LDP plots; the similarity of the domains with bound calcium in the two molecules becomes evident from inspection of Figure 4. The secondary structure of the N-terminal domain of TNC without Ca2+ maintains a clear pattern of similarity to the other domains,
suggesting that binding of two additional calcium ions to this domain mainly affects its tertiary structure (compare patterns in Figures 1A and 2A).
The differences between the secondary structures of the proteins in the crystal and in the results of the various dynamics runs are presented in the form of DLDP representations in Figures 5 and 6 for CAM and TNC respectively. The dashed lines in these figures represent the first standard deviation, a, of the differences (given in Table III) between the two LDPs for which the DLDP is calculated. The absolute value of a gives an indication of the global similarity in secondary structure, whereas the peaks that fall outside a indicate the positions of greatest deviation.
The structure of CAM obtained from the calculations in vacuum (CAM-0) exhibits very large distortions that are delocalized over the entire peptide chain. Moreover, the value of a (2.48 A) is also much larger than for the other simulations. Direct examination of the structure of CAM-0 shows the chain to be stretching out and unfolding. The run was therefore discontinued after 83 ps of dynamics. It is clear that the dynamic behavior of CAM-0 is totally different from either CAM-l or CAM-2, demonstrating the strong effect of the model environments on the latter two simulations.
The DLDP of CAM-l (Figure 5A) indicates that the distortions from the crystallographic structure are distributed over large segments of the sequence. Especially in the C-terminal domain, secondary structural elements have changed over considerable ranges of the sequence. At the same time the segment including the tether (designated K2) has remained relatively unchanged. Because the intradomain secondary structure has changed, whereas the tether region has not, this structure violates our criteria for an acceptable structure (see Materials and methods). In contrast, the DLDP of CAM-2 (Figure 5B) shows a large change in secondary structure in the interdomain tether around residue 80, and fairly long stretches of intradomain structure for which the variations are smaller than a. Additional deformation is seen around loops LI, L3 and the regions HI - L I and K3, but other changes that are larger than a seem to be localized to just one or two amino acid residues rather than to entire elements of secondary structure. Consequently, CAM-2 seems to satisfy the criteria for acceptable structures defined in Materials and methods (see further analysis below).
For TNC-1, the r.m.s. differences between the N-and
Fig. 7. Superposition of alpha-carbon structures of CAM from crystal
structure coordinates (in yellow) and the result of CAM-2 (in green), according to a criterion of optimal superposition of the Ca2+-binding regions
in the C-terminal domain.
C-terminal domain given in Table I are smaller than for the CAM-l but the pattern of the DLDP is similar to that of CAM (cf. Figures 5 and 6), although the a of TNC-1 is larger. Thus, large segments in the C-terminal domain depart from the secondary structure observed in the crystal, indicating that the structural modifications produced by the simulation in TNC-1 also do not meet the criteria for an acceptable change. The DLDP of TNC-2 (Figure 6B) exhibits much the same characteristics as the corresponding DLDP of CAM-2 (Figure 5B), but the deviations are somewhat smaller with a peak in the interdomain tether as well as some smaller peaks at the intradomain linkers. The first few residues (1 — 14) are not part of the EF-hand motif and also show some larger distortions.
Results in Table HI show that the a values for CAM-l and TNC-1 are 20 and 40% respectively larger than for CAM-2 and TNC-2. The environment models for the latter two runs represent the most complete accounting of the environmental effects in the set of approximations used here, and from the results discussed so far these appear to be the only two runs which meet the criteria for acceptable compaction given in Materials and methods. As will be shown below, where we consider the secondary and tertiary structure together, CAM-2 and TNC-2 do meet all the criteria for acceptable, compacted structures.
Hydrogen-bonding patterns and the compaction of the structure The hydrogen bond matrix (HBM) representations of the crystallographic structures of CAM and TNC are given in Figures 1 and 2 respectively (upper triangles). In these plots, alpha-helices are identified by sets of m-m interactions along the fourth position above the main diagonal. The EF-hand motif also is clearly displayed in this representation by the repeating patterns of helical-nonhelical-helical H-bonds. The HBM plots also show that
E.L.MehJer, J.-L.Pascual-Ahuir and H.Weinstein A 0.4! o 'if re •ay ; • 0 0 0 .3 .2 .1 0.0 B 0 4 q c> II < O 2 0 40 60 80
Pair distance (A) r. 0.4
0.3
20 40 60 80 Pair distance (A)
o n to 0.2 0.1 0.0 20 40 60 80 Pair distance (A)
Fig. 8. Pair distribution functions (see text) for CAM calculated from (A) crystal structure coordinates, (B) CAM-2 coordinates and (C) a combination of the
functions in (A) and (B), according to equation (1), with a = 0.71.
there are no interdomain H-bonds, reflecting the large separation of the domains as seen in the corresponding DMs. The Ca2 +
binding loops are characterized by a richness of H-bonds, primarily of m-s type, which mainly involves residues belonging to the loop (intraloop H-bonds). A further characteristic of the Ca2+-bound domains is the paucity of H-bonding between EF
hands. CAM appears to have only two or three non-EF hand H-bonds in the N-terminal and C-tenminal domains respectively, whereas TNC has only one in its C-terminal domain. The m-m interactions in CAM between residues 27 and 63, and between 100 and 136, as well as 113 and 149 in TNC, link the binding loops in an approximate anti-parallel beta-sheet conformation. This conformation is also seen in the corresponding DMs (Figures 1A and 2A) as the green regions around the elements (6O;3O) and (125;100) in the DM of CAM, and element (150;110) in the DM of TNC. These H-bonds are located at the N-terminal end of the C-terminal loop and in the middle of the N-terminal loop in all three domains. Comparisons of the N-terminal domain of TNC (without bound Ca2+) to the Ca2+-bound domains
reveals the differences between them. First, the domain without Ca2+ shows a paucity of intraloop H-bonds, and second, it
contains a number of additional intradomain H-bonds which are not intra-EF hand. Interestingly, the antiparallel beta-sheet structure between the two loops is somewhat more extended here than in the domains containing Ca2+.
Examination of the H-bonding patterns of the alpha-helices in the X-ray structures (Figures 1A and 2A) shows a number of regions where the helices are distorted. Moreover, comparison of TNC with CAM indicates that these distortions are more extensive in the latter. Of particular interest are the irregularities exhibited in the helix linking the two domains (73 — 85 in CAM and 85 - 9 5 in TNC). Such deviations from the ideal alpha-helix
geometry were originally recognized by Babu et al. (1988) from the large deviations from ideal values for the phi and psi angles of residues 7 8 - 8 1 . Having lost the stabilization from the H-bonds, these distorted regions in CAM may be expected to show greater flexibility because the irregularities are greater than in TNC.
The upper triangles in Figure 1 (B and C) present the HBMs for the CAM-1 and CAM-2 structures respectively. The CAM-1 structure (Figure IB) shows tendencies toward artifactual denaturation in the loss of alpha-helical structure and the cluster of s-s-type H-bonds between the C-terminal domain and the tether. The extent of denaturation observed in the HBM (Figure 1B) that is constructed from the average coordinates of the run from 243 to 283 ps, was already seen after ~ 170 ps of the dynamics and only little additional distortion was observed during the last 100 ps. A final point that was already noted from the r.m.s. deviations (Table I) is that in these simulations the tether helix including the segment 7 0 - 8 0 remains relatively unchanged from its conformation in the crystal, in spite of the fact that the structure compacts. Thus the compaction must be due to the distortions observed in the other portions of the protein. The structure of TNC-1 shows similar trends in the observed structural changes as CAM-1 (cf. upper triangles in Figures IB and 2B). The HBM matrix of CAM-2 (Figure 1C) shows an essentially perfect preservation of the four EF-hands. Indeed, examination of the number of alpha-helix H-bonds shows that these helices increased in regularity compared with the X-ray structure. Furthermore it is seen that the interloop beta-sheet structure has also become somewhat more regular and that the increase in H-bonds between the EF hands is also fairly small. The preservation of the domain architecture is also demonstrated in the corresponding DM plot (lower triangle, Figure 1C). In
addition, the distortion in the central part of the tether helix can be seen also in the DM, but the increasing regularity of the beta-sheet structure is not easily identified.
The compaction that is so obvious in the DM (cf. lower triangles in Figure 1A and C) is not as evident in the HBM, but the structural change is indicated by the interdomain H-bonds connecting residues 41 and 42 with 126, and 41 with 128. The observations for CAM-2 are also applicable to the structure of the Ca2+-bound domain of TNC-2 (Figure 2C). Here too there
is essentially perfect preservation of the EF-hands, although the compaction is extensive. The N-terminal domain, however, is somewhat more irregular, as may be observed from the DM (lower triangle, Figure 2C).
Results of the H-bond analysis are summarized in Table IV. The structures in the crystals of CAM and TNC contain a total of 176 and 193 H-bonds respectively. The number of conserved H-bonds in the dynamics structures follows the other trends observed in the analysis, i.e. CAM-0 conserves these H-bonds the least, and CAM-2 the most. In TNC most of the loss of H-bonds is in the N-terminal domain. On average, the H-bonding distances decrease slightly in the dynamics structures with standard deviations ranging from 0.2 to 0.3 A. The loss of H-bonds in the tether reigon also suggests that in CAM-2, where only one H-bond is lost, the changes leading to compaction are occurring in the distorted region of the tether, where H-bonds are not present. Since the D/E tether of TNC is less distorted, there is a concomitantly greater loss of tether H-bonds as seen from the results for TNC-2 given in Table IV.
Figure 7 presents the alpha-carbon chain drawings of the CAM structure in the crystal and from CAM-2. The latter more closely resembles a compact globular protein than the X-ray structure and the bend is clearly seen. The N-terminal domain has also swung around somewhat, coming closer to the C-terminal domain, but it is still well behind the latter domain, thus allowing only a few direct interdomain H-bonds to form (see Figure 1C). The N-terminal domain of TNC behaves differently due to the absence of the Ca2+, so that it is difficult to compare the
alpha-carbon chain for the molecule in the crystal to TNC-2 in the way presented in Figure 7 for CAM. As indicated by the superposition shown in Figure 3(A), it is not possible to bring TNC into a similar alignment as the CAM structure. Consequently, the similarities between the results of the simulations on the two systems, noted above, are all the more remarkable. Figure 3(A) shows that especially the binding loops and first turns of the associated helices are very similar in both secondary and tertiary structures. The structural similarity of these domains observed in the X-ray structures is thus conserved throughout the simulations, in spite of the fact that they were carried out completely independently of each other.
Effect of structural changes on solvent accessibility
In CAM-1, the solvent accessible surface of 34 of the 52 charged residues decreases by > 20% compared with the crystal structure, whereas only one charged residue shows an increase by >20%. In comparison, the number of surface-charged groups that lose >20% solvent accessibility in CAM-2 is only 28, and the number whose accessibility increases is now 5. Thus, the 67 crystallo-graphic waters (considered in CAM-2, but not in CAM-1) reduce the number of charged residues which lose accessible surface by —10%. The movement of surface-charged residues into the protein, and a concomitant reduction in global surface area, are well known artifacts of simulations performed in vacuum. However, the influence of this type of artifact on the structure is unclear because the reduction in number of charged groups
losing surface area is much larger in the N-terminal domain than in the C-terminal domain, although the r.m.s. difference from the X-ray structure is larger for the former (Table I).
The difference between CAM-1 and CAM-2 is greater when the exposure of the hydrophobic groups is compared. In CAM-1, 35 of the 65 hydrophobic groups gain >20% accessible surface area and 14 residues lose >20%, whereas in CAM-2 only 15 hydrophobic residues gain surface area and 23 lose >20%. Because the structure of CAM studied here has all four Ca2+
bound, the observed modifications may have direct functional significance. Figure 7 shows that the protein seems to have assumed a somewhat globular shape. Reorientation of the Ca2+-binding domains forms an 'S'-like shape that reveals two
interior pockets to the environment. These pockets contain a number of hydrophobic patches. The possible involvement of such hydrophobic sites in the affinity for Ca2+ has been pointed
out (Sekharudy and Sundaralingam, 1988), and various experi-mental studies have implicated hydrophobic patches in the interaction of CAM with small molecular inhibitors (Dalgarno etal., 1984a,b; Lukasetal., 1985; Strynadka and James, 1989), peptides (Klevit etal., 1985; Persechini and Kretsinger, 1988b) and proteins (Heidorn et al., 1989; Persechini and Kretsinger,
1988a,b; Weber etal, 1989).
A recent NMR and molecular modeling study of calmidazolium binding to CAM and TNC (Reid et al., 1990) identifies residues that could form hydrophobic contacts with the phenyl moiety of the ligand, and proposes models of interaction that are consistent with the measurements. In the N-terminal domain, the aromatic residues closest to the ligand binding site are proposed to be Phel9, Phel2, Phe68, Phel6 and Phe65—in order of increasing distance from the ligand. The first four in this group of hydrophobic residues belong to those that have gained >20% accessible surface area in CAM-2. In the C-terminal domain the residues Phe92, Phel41, Phe89, Tyrl38, Tyr99 and Hisl07 are proposed by Reid et al. (1990) to be closest to the ligand, in order of increasing distance. The first two gain > 20% accessible surface in CAM-2 compared with the crystal structure, and the last four have about the same accessible surface area in CAM-2 as in the X-ray structure.
Coordination of the Ca2* ions
A sensitive test of the reliability of the parametrization of the empirical potential function and the model of the environment is obtained from a consideration of the ion coordination, with the expectation that the coordination observed in the crystal structure would be conserved in the averaged dynamics structures. In both CAM and TNC the coordination number for Ca2+ is 7
for all EF hands with water contributing one ligand at each site (Herzberg and James, 1985; Babu et al., 1988). This coordination is not conserved in the simulation, with the main changes arising from bidentation of two of the three glutamic acids coordinating to Ca2+. Changes in total coordination from 7 to 9 are indicated
by a move of the oxygens from distances of 2.3 and 3.5 A from the Ca2+ in the crystal structure, to - 2 . 5 A for both oxygens
in the dynamics structure. This is the case for EF hands I - H I of CAM. The fourth EF-hand of CAM shows clear bidentation only for Glul31, whereas the distances for Glul33 are 2.79 and 2.44 A for 051 and O62 respectively. Thus the coordination for this case is closer to 8.
In TNC the situation is slightly different: for EF-hand I only GlulO6 is bidentated, but the simulation allows O52 of Glul 14 to approach to 2.5 A. This residue is not coordinated to Ca2+
in the crystal structure. For the other EF-hand, Glul42 is bidentated, whereas the distances of the oxygens of Glul46 are
E.L.MehJer, J.-L.Pascual-Ahuir and H.Weinstein
2.47 and 2.62 A, giving an effective coordination between 8 and 9.
The experimental uncertainty in determining whether a carboxylate Ca2+ ligand is mono- or bidentate was recently
illustrated by results of refinement for the crystal structure of parvalbumin (Kumar et al., 1990), which showed that Glu62 had been considered to form a monodentated ligand at 1.9 A resolution, but appears to be bidentated at 1.5 A resolution. The reasons for the observed rearrangement of the Ca2+ ligands in
the course of the dynamics simulation are not clear at present, but the change may be attributable to inadequate modeling of the solvent environment and/or to the neglect of polarization in the empirical potential functions. Whether or not a more appropriate representation of the environmental screening effects through a scaled dielectric permittivity or explicit inclusion of solvent will improve these coordination patterns should be established by results from further investigations.
Pair distribution Junctions
Calculation of this function from the structures discussed above facilitates direct comparison to the experimental data obtained for various forms of CAM and TNC in solution. Figure 8(A) clearly shows two well-separated maxima corresponding to the presence of the two globular CA-binding domains in CAM at the far ends of the extended helical linker. In the calculation for CAM-2 (Figure 8B) the second maximum has completely disappeared, yielding a profile typical for compact globular proteins. Some of the results obtained from SAXS measurement in solutions (Heidorn and Trewhella, 1988) yield pair distribution functions with profiles that lie somewhere between these two extremes. The recent study by Matsushima et al. (1989) also gives the pair distribution functions for the CAM complex with mastoparan in solution, obtained from the SAXS scattering profiles. Comparison of Figure 8(B) with the pair distribution function for the CAM - mastoparan complex (Matsushima et al., 1989; Figure 3C) shows that the simulated structure of CAM-2 is as compacted as the complex, in agreement with the calculated R% values. The pair distribution function of CAM in solution in the presence of Ca2+ (Matsushima et al., 1989; Figure 3B) is,
however, quite different from Figure 8(A). The second maximum has disappeared leaving only a shoulder. This distribution function represents either a structure somewhat more compact than the X-ray structure or an average of a number of structures of varying compaction.
In view of the apparent flexibility of CAM (as shown by the compaction upon complex formation with mastoparan and other polypeptides) it seems appropriate to assume that the results shown in Figure 3(B) of Matsushima et al. (1989) represent an average over a number of structures. Assuming a multi-state process, where the crystal structure and CAM-2 represent the endpoints, intermediate pair distribution functions can be constructed from the relationship
-a)/>CAM.2(r) (1)
where a and (1 —a) are the fractional contributions from the two extreme structures. To evaluate a it is noted that the Rg is defined as the second moment of the distribution function, thus, assuming P(r) is normalized
and using equation (1)
Rg2(a) = ] r2[aPXny(r) + (\-a)PCAM.2(r)]dr
= a#g2(Xray) + (1 -a)fig2(CAM-2) (3)
r2P(r)dr (2)
Solving equation (3) for a one obtains
a = [Rs\a) - flg2(CAM-2)]/[flg2(Xray) - Rg2(CAM-2)] (4)
Using the Rg values from Matsushima et al. (1989) [i.e. the solution value for Rg(a); the value for the CAM + mastoparan complex for /?g(CAM-2); and the flg(Xray)] one finds a value
of 0.71 for a, which is the value used to evaluate P(r) in Figure 8(C) [cf. Figure 3B in Matsushima et al. (1989)].
Taken together, these results indicate that a structure with an Rg substantially below the average value is likely to be present in solution and to contribute to the function of CAM as discussed above for CAM-2.
Concluding remarks
Based on the criteria used here to select physically acceptable structures from the computational simulations, the results of the calculations have shown that only the model environment used for CAM-2 and TNC-2 led to acceptable structural modifications, and that properties of the structures obtained from these simulations correlate well with changes observed for NMR and some SAXS experiments on CAM complexes with ligands. Simulations with unit dielectric permittivity (CAM-0) clearly led to denaturation, consonant with results from other studies that have suggested such models to be inadequate for protein structure simulation (Levitt and Sharon, 1988). However, the use of a linear dielectric permittivity of the form e = r, without the inclusion of any specific water-protein interactions (e.g. CAM-1) also appears unsatisfactory. This finding agrees with conclusions from other studies that have pointed out the inadequacy of the exclusive use of the form e = r (Harvey, 1989; Wendoloski and Matthew, 1989).
The solution structure of CAM studied here has all four Ca2+
bound so that the observed modifications may have direct functional significance. Our initial modeling studies of the mode of interaction of CAM with trifluoperazine (Mehler and Weinstein, 1990) suggest that these hydrophobic patches that have increased exposure in the compacted form of CAM could be involved in the binding of CAM inhibitors, and further studies of these interactions are currently being pursued. The simula-tion techniques used to explore regions of conformasimula-tional space corresponding to structural variants that are not easily accessible experimentally were thus shown to yield intriguing insights concerning possible functional correlates of the structural changes. Although existing experimental data support the plausibility of the structures CAM-2 and TNC-2, full experimental validation is still outstanding.
Acknowledgements
We thank Dr Joseph N.Kushick for critical reading of the manuscript and many helpful discussions, and Alan Factor for his help with computations and graphics Computations were performed on the supercomputer systems at the Pittsburgh Supercomputer Center (sponsored by the National Science Foundation) and the Cornell National Supercomputer Facility (sponsored by the National Science Foundation and IBM), as well as at the Advanced Scientific Computing Laboratory at the Frederick Cancer Research Faciliu of the National Cancer Institute (Laboratory for Mathematical Biology) and at the University Computer Center of the City University of New York The work was supported in part by NIH
grant GM^tl373, by a senior Fellowship (F33) GM-13103 (to E.L.M.), a Research Scientist Award DA-00060 from the National Institute on Drug Abuse (to H.W.) and a Swiss National Science Foundation Grant 31-8840.86 (to E.L.M.).
References
Babu.YS , Bugg,C E and Cook.W J. (1988) J Mol. Biol., 204, 191 -204. Brooks,B.R., BruccoIen,R.E., Olafson.B.D., States,D J.. Swaminalhan.S. and
Karplus.M. (1983)/ Compui. Chem., 4, 187-217.
Brooks,C L , Karplus,M. and Pettitt.B.M. (1988) Proteins: a Theoretical
Perspective of Dynamics, Structure, and their Thermodynamics. John Wiley
& Sons, New York.
Burger.D , Cox.J.A., Comte.M. and Stein,E.A (1984) Biochemistry, 23. 1966-1971.
Chazin.W.J , Kordel.J., DrakenbergX, Thulin.E., Brodin,P., Grundstrom,T. and Forsen.S. (1989) Proc. Nail Acad. Sci. USA, 86, 2195-2198. Cox.J.A., Corute.M., Mamar-Bachi.A., Milos.M and Schaer,J.-J (1988) In
Gerday.C, Bolis.L. and Gilles,R. (eds), Canon Binding to Calmodulin and
Relation to Function. Springer Verlag, New York, pp. 141-162.
CreightonJ.E. (1984) Proteins. W.H.Freeman & Co., New York. Dalgarno,D., KJevit.R.E., Levine.B.A. and Williams,R.J P (1984a) Trends
Pharmacol. Sci., 5, 2 5 - 3 0
Dalgamo.D.C, Klevit.R.E., Levine,B.A., Scott.G.M.M., Williams.R.J.P , Gergely.J., Grabarek.Z., Leavis.P.C, Grand.R.J.A. and Drabikowski.W. (1984b) Biochim. Biophys. Ada, 791, 164-172.
Factor.A. and Mehler.E L (1991) Protein Engng, 4, 421-425.
Follenius.A. and Gerard,D. (1984) Biochem. Biophys. Res. Commun., 119, 1154-1160
Harvey.S.C. (1989) Proteins. Struct. Fund. Genet , 5, 78-92. Heidorn,D.B. and TrewheUa.J. (1988) Biochemistry, 27, 909-915. Heidorn,P.B., Seeger.P A , Rokop.S.E., Blumenthal.D.K , Means,A.R ,
Crespi.H and Trewhella.J. (1989) Biochemistry, 28, 6757-6764. Herzberg.O and James,M.N.G. (1985) Nature, 313, 653-659. Herzberg,O. and James.M N.G. (1988) J. Mol. Biol., 203, 761-779. Hori.K., Kushick.J.N. and Weinstein.H. (1988) Biopolymers, 27, 1865-1886. Hubbard.S.R., Hodgson.K.O. and Doniach.S. (1988) J. Biol Chem.. 263,
4151-4158.
Kataoka,M.,Head,J.F.,Seaton,B.A. andEngelman.D.M. (1989) Proc Nail Acad.
Sci. USA, 86, 6944-6948.
Klevit.R E (1987) Methods Enzymol., 139, 197-206
Klevit.R.E., Blumenthal.D.K., Wemmer.D.E. and Krebs.E.G. (1985)
Biochemistry, 24, 8152-8157.
Kretsinger.R.H. (1982) CRC Crit Rev. Biochem , 8, 118-174
Kumar.V.D., Lee.L. and Edwards.B.F.P. (1990) Biochemistry, 29, 1404- 1412 Kuntz.I.D (1975)7. Am. Chem. Soc., 97, 4362-4366.
LaPorte.D.C, Wierman.B.M. and Storm.D.R. (1980) Biochemistry, 19, 3814-3819.
Levitt.M. and Sharon,R. (1988) Proc. Natl Acad. Sci. USA, 85, 7557-7561. Liebman.M.N. and Weinstein.H. (1985) In Clementi.E., Corongiu.G. and Sarma.M H. (eds). Structure and Motion' Membranes, Nucleic Acids and
Proteins. Adenine Press, New York, pp. 339-359.
Liebman.M.N., Venanzi.C.A and Weinstein.H. (1985) Biopolymers, 24, 1721-1758.
Lukas.T.J., Marshak.D.R. and Watterson.D.M. (1985) Biochemistry, 24, 151-157.
Matsushima.N., Izumi.Y., Matsuo.T., Yoshino.H., Ueki.T. and Miyake.Y (1989)/ Biochem.. 105, 883-887
McCammon^ A. (1987) Science, 238, 486-491 Mehler.E.L. (1990) Protein Engng, 3, 415-417
Mchler.E.L. and Eichele.G. (1984) Biochemistry, 23, 3887-3891 Mehler.E.L. and Weinstein.H. (1990) Experiemia, 46, A4.
Nishikawa.K., Ooi.T., Isogai.Y. and Saito.N. (1972) J. Phys Soc. Jap., 32, 1331-1337.
Pascual-Ahuir,J.-L. and Weinstein.H. (1991) Biophys. / , 59, 118a. Perscchini.A. and Kretsinger.R.H. (1988a)/ Biol. Chem.,26S, 12175-12178 Persechini.A. and Kretsinger.R.H. (1988b) / Cardiovasc. Pharm., 12 (Suppl.
5), S1-S12.
Phillips,D.C. (1970) In Goodwin.T.W. (ed.), British Biochemistry, Past and
Present. Academic Press, New York, pp. 11 - 2 8 .
Reid.D.G., McLachlan.L.K., Gajjar.K., Voyle.M., King.R.J. and England,P.J. (1990) / Biol. Chem., 26S, 9744-9753.
Seaton.B.A., HeadJ.F., Engelman.D.M. and Richards.F.M. (1985) Biochemistry, 24, 6740-6743.
Sekharudy.Y.C. and Sundaralingam.M. (1988) Protein Engng, 2, 139-146. Strynadka,N.C.J. and James.M.N.G. (1989) Ainu. Rev. Biochem., 58, 951 -998. Tanaka.T. and Hidaka.H. (1980) J. Biol Chem., 255, 11078-11080 Wang.C.A. (1989) Biochemistry, 28, 4816-4820.
Wang.C.A., Zhan,Q.. Tao.T. and CergelyJ. (1987) / Biol. Chem., 262, 9636-9640.
Weber.P.C, Lukas.T.J L, Craig.T A., WUson.E., King.M.M., Kwaitkowski, A.P. and Watterson.D M. (1989) Proteins: Struct. Funct. Genet., 6, 7 0 - 8 5 . Wendoloski.J.J and Matthew,J.B. (1989) Proteins: Struct. Funct. Genet., 5,
313-321
Wnuk,W. (1988) In Gerday.C H , Bolis.L. and Gilles.R. (eds), Calcium and
Calcium Binding Proteins Springer Verlag, New York, pp. 4 4 - 6 8 .
Wright.P.E. (1989) Trends Biol Sci., 14, 255-260.