Publisher’s version / Version de l'éditeur:
The Journal of Experimental Biology, 205, 10, pp. 1419-1427, 2002-05-15
READ THESE TERMS AND CONDITIONS CAREFULLY BEFORE USING THIS WEBSITE.
https://nrc-publications.canada.ca/eng/copyright
Vous avez des questions? Nous pouvons vous aider. Pour communiquer directement avec un auteur, consultez la première page de la revue dans laquelle son article a été publié afin de trouver ses coordonnées. Si vous n’arrivez pas à les repérer, communiquez avec nous à PublicationsArchive-ArchivesPublications@nrc-cnrc.gc.ca.
Questions? Contact the NRC Publications Archive team at
PublicationsArchive-ArchivesPublications@nrc-cnrc.gc.ca. If you wish to email the authors directly, please see the first page of the publication for their contact information.
NRC Publications Archive
Archives des publications du CNRC
This publication could be one of several versions: author’s original, accepted manuscript or the publisher’s version. / La version de cette publication peut être l’une des suivantes : la version prépublication de l’auteur, la version acceptée du manuscrit ou la version de l’éditeur.
Access and use of this website and the material on it are subject to the Terms and Conditions set forth at
The freeze-avoidance response of smelt Osmerus mordax : initiation
and subsequent suppression of glycerol, trimethylamine oxide and
urea accumulation
Treberg, Jason R.; Wilson, Connie E.; Richards, Robert C.; Ewart, K. Vanya;
Driedzic, William R.
https://publications-cnrc.canada.ca/fra/droits
L’accès à ce site Web et l’utilisation de son contenu sont assujettis aux conditions présentées dans le site LISEZ CES CONDITIONS ATTENTIVEMENT AVANT D’UTILISER CE SITE WEB.
NRC Publications Record / Notice d'Archives des publications de CNRC:
https://nrc-publications.canada.ca/eng/view/object/?id=eccbb2b9-f655-42ef-9b26-8705a53839ff https://publications-cnrc.canada.ca/fra/voir/objet/?id=eccbb2b9-f655-42ef-9b26-8705a53839ffMarine waters may have seasonal temperatures that approach and often reach the freezing point of approximately –1.8 °C. Many marine teleost fishes survive at these temperatures through freeze avoidance, by migration, supercooling or physiological freeze-resistance mechanisms of colligative and non-colligative forms (DeVries, 1982). Rainbow smelt, Osmerus mordax (referred to herein as smelt), produce an antifreeze protein, but in insufficient quantities to allow them to survive temperatures approaching –2.0 °C (Ewart and Fletcher, 1990). Smelt appear to be unique among teleost fishes because of their ability to elevate the osmolarity of their plasma, and presumably all body fluids, to the point where they become near iso-osmotic with sea water (Raymond, 1992). This is accomplished by the accumulation of small organic solutes, namely glycerol, trimethylamine oxide (TMAO) and urea, and inorganic ions (Raymond, 1992, 1994). In some cases organic solutes constituted >40 % of total plasma solutes (Raymond, 1992). These increases in solutes are thought to act in a colligative manner to further depress the freezing point of body fluids, and thus are an integral part of the smelt’s freeze-avoidance mechanism.
Levels of small (non-protein) organic solutes are higher in wild smelt caught in winter than in specimens caught in summer and fall (Raymond, 1992, 1994). Tissue and plasma
levels of glycerol, TMAO and urea can also be significantly changed under laboratory conditions by acclimation temperature. In fish caught during winter conditions (less than –1 °C) solute concentrations are lower following acclimation for 14–15 days to temperatures above freezing, whereas in fish caught during fall-type conditions (5 °C) solute levels are increased when fish are maintained at –1 °C for 21 days (Raymond, 1993, 1994; Raymond et al., 1996).
Organic osmolytes are either synthesized or obtained through feeding. The carbon sources for glycerol appear to be stored glycogen and amino acids, which are accessible via the gluconeogenic pathway (Raymond, 1995; Raymond and Driedzic, 1997). Furthermore, because smelt may lose approximately 10 % of their total glycerol stores per day when winter-adapted (Raymond, 1993), it is very likely that dietary amino acids are a key precursor to glycerol on a continual basis. Driedzic et al. (1998) have shown that levels of glycerol and amino acid metabolizing enzymes are several-fold higher in the liver of smelt than in other teleosts collected from the same region during the winter. For amino acids to be utilized for glycerol synthesis there must be a high capacity for deamination and subsequent excretion or detoxification of the ammonia that would be produced. The high liver amino transferase activities (Driedzic et al., 1998) suggest that these may play a critical role in amino acid flux
JEB3928
Smelt (Osmerus mordax) were maintained at either ambient water temperature or approximately 5 °C and various aspects of their freeze-avoidance response were examined from early winter until early spring. Plasma levels of glycerol, trimethylamine oxide (TMAO) and urea were elevated by December 15 and continued to increase in fish held in ambient conditions. In contrast, fish held under warm conditions exhibited decreased glycerol and urea content in plasma, muscle and liver. Plasma and liver TMAO levels also decreased in these fish while muscle TMAO did not vary from the initial values. The activity of liver enzymes involved with the production of glycerol did
not differ significantly between groups and had decreased by the end of the study. Antifreeze protein (AFP) expression increased over the duration of the experiment. In January samples, AFP activity (thermal hysteresis) did not vary significantly between groups but mRNA levels were significantly lower in the smelt held at warm temperatures.
Key words: smelt, Osmerus mordax, freeze-avoidance response, thermal hysteresis, glycerol, trimethylamine oxide, urea, glycerol-3-phosphate dehydrogenase, antifreeze.
Summary
Introduction
The freeze-avoidance response of smelt Osmerus mordax: initiation and
subsequent suppression of glycerol, trimethylamine oxide and urea accumulation
Jason R. Treberg
1, Connie E. Wilson
1, Robert C. Richards
2, K. Vanya Ewart
2and William R. Driedzic
1,*
1Ocean Sciences Centre, Memorial University of Newfoundland, St John’s Newfoundland, Canada A1C 5S7 and 2NRC Institute for Marine Biosciences, 1411 Oxford Street, Halifax, Nova Scotia, Canada B3H 3Z1
*Author for correspondence (e-mail: wdriedzic@mun.ca)
1420
into the glycerol pool. Since ammonia is toxic, even in ammoniotelic teleosts (Wright, 1995), the production of urea may be a means of detoxifying ammonia produced from the deamination of amino acids. Thus if glycerol production from amino acids increases, we might expect to see an increase in the levels of urea. Glycerol-3-phosphate dehydrogenase (GPDH) activity is very high in winter-caught smelt relative to other teleosts and appears to be a key enzyme in glycerol synthesis (Driedzic et al., 1998). Since GPDH has such high activity in the liver, which is probably the major site of glycerol synthesis, it may be an essential component in total glycerol synthesis and could have a regulatory role. Consistent with this hypothesis, winter-caught smelt held at elevated temperatures show decreased levels of liver GPDH mRNA, in parallel with a decrease in plasma glycerol concentration (Ewart et al., 2001).
Previous studies have been restricted to comparisons of a limited number of time points and thus only provide a snapshot glimpse into the smelt antifreeze response. Moreover, they have included smelt from different geographic locations and these fish may respond differently to seasonal stimuli. The present study is the first to examine a number of aspects involved in cold acclimation in smelt from a consistently cold region under laboratory conditions over an entire winter season. Unlike previous work which utilized short-term acclimation, we used two groups of smelt, one maintained at approximately 5 °C and another that was allowed to track ambient winter water temperatures. We measured the accumulation of glycerol, TMAO, urea and antifreeze protein activity (thermal hysteresis), along with the expression of antifreeze protein (AFP) mRNA, to determine the temporal sequence of the actual antifreeze response in smelt. By measuring liver alanine aminotransferase (AlaAT), aspartate aminotransferase (AspAT) and GPDH activities, together with the expression of GPDH mRNA, we could examine the temporal regulation of the levels of these enzymes with respect to seasonal expression of glycerol synthesis. Finally, we tested the hypothesis that smelt maintained over winter at temperatures well above freezing suppress their antifreeze mechanisms and thus do not accumulate the organic osmolytes or AFP.
Materials and methods
Animals
Smelt were caught in late October 1999 by beach seine near Conception Bay, Newfoundland. Animals (approximately 180) were transported to the Ocean Sciences Centre (Memorial University of Newfoundland) in seawater and held in two 4000 l, indoor free-flowing seawater tanks. The ambient water temperature at the time was approximately 10 °C. All fish were offered and observed to feed on frozen brine shrimp daily throughout the duration of the experiment. Additionally, most of the experimental animals had evidence of food consumption (material in the gut or stomach). Fish were kept on a natural photoperiod with fluorescent lights set on an outdoor photocell.
Apart from sporadic incidental mortalities, experimental fish appeared to be in good condition throughout the experiment.
Fish were maintained in two experimental groups: one tank was maintained at approximately 5 °C and the other at ambient seawater temperatures. Fish were initially sampled in mid-December, when the ambient water temperature was approximately 5 °C, and then at approximately monthly intervals. Sample dates were December 15, 1999, January 11, 2000, February 29, 2000, March 30, 2000 and May 15, 2000. Ambient water temperatures were 0.8 °C, 0 °C and –0.8 °C by January 11, February 29 and March 30, respectively (Fig. 1). Initially, three fish from each tank were sampled. There was no significant difference in all measured characteristics between these fish and thus the data were pooled into a single initial point. Due to lack of experimental animals, no ambient-temperature fish were sampled in May.
Over the duration of the experiment, mean body mass (50.9±17.9 g) was not significantly different between the initial sample (65.6±30.4 g) and all following periods for both groups (P>0.05, Student’s t-test).
Sample collection and preparation
Fish were killed by a blow to the head. Blood was drawn by caudal puncture through a 25-gauge heparinized syringe and centrifuged at approximately 5000 g for 3 min at 4 °C. Plasma was frozen at –60 °C for later analysis. Liver and muscle samples were quickly removed and either used immediately for enzyme assays (GPDH) or frozen with liquid nitrogen for later analysis.
Biochemical assays
Plasma, muscle and liver were analyzed for glycerol, urea and TMAO. Glycerol was determined directly from plasma, but muscle and liver samples were first homogenized in 10 volumes of distilled water. For urea and TMAO analysis, plasma was diluted 1:10 with 5 % trichloracetic acid (TCA) (w/v) and muscle and liver samples were homogenized in 9
J. R. Treberg and others
W ater temperature ( ° C) –2 0 2 4 6 8 10 Warm Ambient
Dec. 1 Jan. 1 Feb. 1 Mar. 1 Apr. 1 May 1 June 1 Fig. 1. Thermal profiles of warm and ambient temperature smelt groups; arrows indicate sampling dates relative to the first day of the month.
volumes of 5 % TCA. Any further dilutions were also done with 5 % TCA. Glycerol and urea contents were determined using Sigma diagnostic kits 337-40A and 535, respectively. TMAO was determined by the method of Wekell and Barnett (1991), modified for use with small sample volumes. As in Raymond (1998), disposable plastic cuvettes were used. TMA was determined for a number of tissues and found to be very low relative to TMAO; as in Raymond (1994), all TMAO data were not corrected for the minor TMA content. Glycogen was measured by the method of Walaas and Walaas (1950) as described by Driedzic et al. (1998).
For enzyme assays, liver samples were weighed and homogenized with 9 volumes of ice-cold buffer (20 mmol l–1
imidazole, 5.0 mmol l–1 EDTA, 5.0 mmol l–1 EGTA,
10 mmol l–1 mercaptoethanol, 50 mmol l–1 NaF and
0.1 mmol l–1 PMSF, pH 7.4) for determination of GPDH,
AlaAT and AspAT. Samples were homogenized using a Polytron tissue homogenizer for 10 s and centrifuged at approximately 10,000 g in an Eppendorf centrifuge for 5 min at 4 °C to remove cellular debris. Enzyme assay conditions were modified from Driedzic et al. (1998). Assay conditions were as follows. GPDH: 20 mmol l–1 imidazole, pH 7.2,
0.15 mmol l–1 NADH; the reaction was initiated by
2.0 mmol l–1dihydroxyacetone phosphate. AlaAT: 50 mmol l–1
imidazole, pH 7.4, 0.05 mmol l–1 pyridoxal phosphate,
0.2 mmol l–1 NADH, 2 U ml–1 lactate dehydrogenase (LDH),
200 mmol l–1 alanine; the reaction was initiated by adding
10 mmol l–1 α-ketoglutarate (α-KG). AspAT: 50 mmol l–1
imidazole, pH 7.4, 0.05 mmol l–1 pyridoxal phosphate,
0.2 mmol l–1 NADH, 1 U ml–1malate dehydrogenase (MDH),
30 mmol l–1 aspartate; the reaction was initiated by adding
10 mmol l–1α-KG. All assays were done on a Gilford Model
2600 spectrophotometer with a circulating water-jacketed cell holder maintained at 15 °C. GPDH activity was determined on fresh tissues; AlaAT and AspAT assays were done on frozen samples.
Antifreeze activity measurement
Plasma thermal hysteresis (antifreeze activity) was measured as the difference between the melting and freezing points using a Clifton nanolitre osmometer (Clifton Technical Physics, Hartford, NY, USA) as described by Ewart et al. (2000).
Gene expression analysis
Total RNA was isolated from smelt livers using the RNeasyTMMini kit (Qiagen) according to the manufacturer’s
instructions and stored at –80 °C in the presence of RNAasinTM
RNAase inhibitor (Promega) until analysis. Northern blotting was performed on 10µg samples of total RNA and hybridization was carried out with γ-32P-labelled DNA probes.
For smelt GPDH, the probe consisted of a 1012 base pair (bp) fragment of the GPDH cDNA; for smelt AFP, the probe was a full-length smelt AFP cDNA (Ewart et al., 1992, 2001). Probes were labelled by random priming using a commercially supplied kit (Roche) and hybridized with the blot membrane.
Following each probing, the membrane was washed and exposed to film (Biomax MR, Kodak). The autoradiographic images were analysed by densitometry as previously described (Ewart et al., 2001).
Statistical analysis
Means were compared with a one-way analysis of variance (ANOVA) for all measurements and P<0.05 was taken as significant.
Results
Plasma osmolality
Initial osmolality was 349 mOsmol kg–1 and increased in
both groups of fish (Fig. 2). The osmolality of the ambient group was significantly elevated from the initial values by January 11 and that of the warm group by February 29. The osmolality of both groups remained elevated for the duration of the experiment and the ambient group reached approximately 840 mOsmol kg–1 by February 29. The
osmolality of the ambient group was highly variable and significantly greater than that of the warm group on March 30.
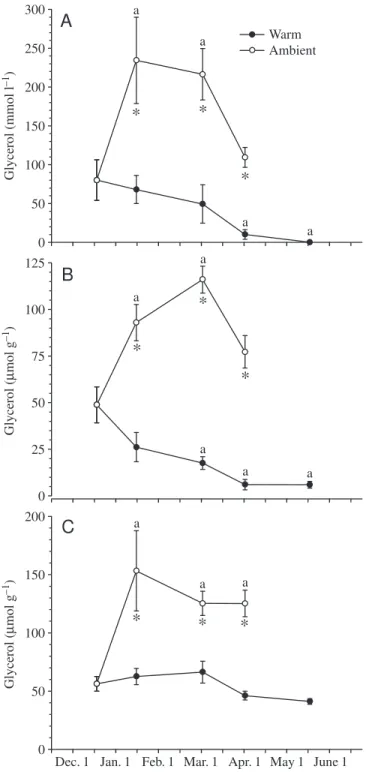
Glycerol
Mean initial plasma glycerol concentration was 80 mmol l–1 (Fig. 3A). Plasma glycerol increased by
approximately threefold, peaking at 234 mmol l–1by January
11 in the smelt held at ambient water temperatures, which was significantly greater than the 68 mmol l–1 found in the
fish maintained in warm water. Glycerol levels in the ambient group remained significantly higher than those in the warm temperature group for the duration of the experiment; however, the concentration decreased from February 29 to March 30 and was then not significantly different from the levels in the initial sample. Plasma glycerol levels in the warm temperature group steadily decreased to significantly
0 250 500 750 1000 1250
*
a a a a a Osmolality (mOsm kg –1) Warm AmbientDec. 1 Jan. 1 Feb. 1 Mar. 1 Apr. 1 May 1 June 1 Fig. 2. Plasma osmolality, in warm and ambient smelt. Values are means ± S.E.M. (N=2–5); asignificant difference from initial value,
1422
less than the initial values on March 30 and to an almost negligible amount by May 15.
Muscle glycerol levels followed a very similar trend to plasma levels (Fig. 3B), but were consistently lower. In the ambient temperature group, the mean initial glycerol level in muscle was 49µmol g–1 and increased to a maximum of
116µmol g–1 on February 29. Glycerol levels tended to
decrease from February 29 to March 30. As with plasma, muscle glycerol levels in the warm temperature group began decreasing in January, were significantly less than the initial value by February and continued to decrease throughout the experiment. Similar to plasma, muscle glycerol levels in warm-and ambient-temperature groups were significantly different at all sampling periods.
Liver glycerol levels also followed a trend of increasing significantly in the ambient temperature group from the initial level of 56µmol g–1to a maximum of 153µmol g–1in January
(Fig. 3C). Glycerol levels were maintained in this group throughout the experiment and were significantly greater than the initial values and those found in fish held at warm temperatures. Interestingly, in the warm-acclimated group, liver glycerol levels did not show any significant decrease from initial values throughout the experiment.
Trimethylamine oxide
The mean plasma TMAO concentration was initially 14 mmol l–1and increased in both groups by January 11 (Fig. 4A). On
February 29, when the ambient temperature fell below 0 °C, the ambient group reached its peak TMAO concentration at 19 mmol l–1. Plasma TMAO had significantly decreased to
9 mmol l–1by February 29 in the warm-acclimated group and,
like glycerol, continued to decrease throughout the experiment. Unlike glycerol, plasma TMAO concentrations in the ambient-temperature smelt group remained elevated in March.
Muscle TMAO levels did not change significantly from the initial sample values with either treatment at any time (Fig. 4B). There was a significant difference between warm and ambient groups on February 29; however, neither value was significantly different compared to the initial values.
Liver TMAO levels mirrored the trend seen in plasma, where levels significantly increased from the initial 13µmol g–1 to 17µmol g–1 in the ambient group, whereas
TMAO levels continually decreased from the initial concentration in the warm-acclimated fish (Fig. 4C).
Urea
Initially, concentrations of plasma urea followed a very similar pattern to glycerol, with an approximately threefold increase from 3 mmol l–1 on December 15 to 9 mmol l–1 by
February 29 in the ambient-temperature fish (Fig. 5A). As with glycerol, plasma urea concentrations began decreasing within the first month in warm-temperature fish and remained low throughout the experiment. However, in cold acclimated smelt plasma urea remained elevated, like the TMAO concentration.
Muscle urea followed a very similar trend to plasma urea, with levels in the ambient group increasing from 3µmol g–1
initially to a maximum of 9µmol g–1on February 29 (Fig. 5B).
The urea concentration in the warm-temperature group was significantly different from the initial value on March 30, but not in any other month.
Urea levels in liver followed the same trend as in plasma and muscle (Fig. 5C). Liver urea levels in the warm group on
J. R. Treberg and others
0 25 50 75 100 125
*
a*
*
a a a a 0 50 100 150 200 a*
a*
*
aB
C
0 50 100 150 200 250 300*
*
*
a a a aA
Glycerol ( µ mol g –1) Glycerol ( µ mol g –1 ) Glycerol ( mmol l –1)Dec. 1 Jan. 1 Feb. 1 Mar. 1 Apr. 1 May 1 June 1 Warm Ambient
Fig. 3. Glycerol levels in warm and ambient smelt. (A) Plasma; (B) muscle; (C) liver. Values are means ±S.E.M. (N=6 initially; N=5 for all other points). aSignificant difference from initial value;
February 29 and March 30 were significantly less than the initial values.
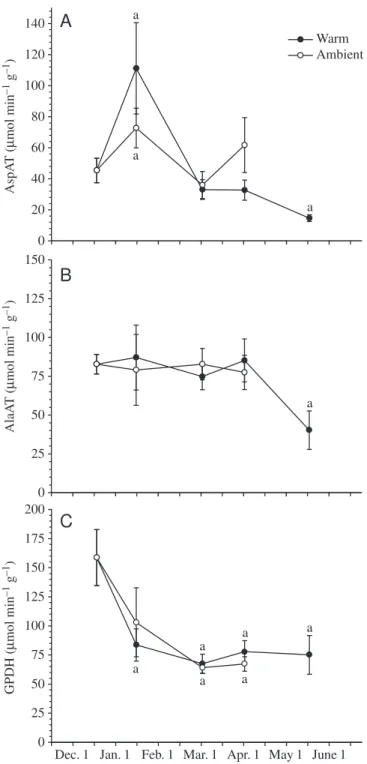
Liver enzymes
Activities of AspAT, AlaAT and GPDH in liver did not significantly differ at any time between experimental groups (Fig. 6). All enzymes had significantly decreased in activity
from the initial values by May 15 in warm-acclimated fish. Activity of AspAT significantly increased in both groups by January 11 but was not different from the initial value on February 29 and March 30. GPDH activity was highest initially and significantly decreased in both groups by February 29. Complementing the GPDH activity data (Fig. 6C), levels of GPDH mRNA isolated from smelt liver showed no significant 0 5 10 15 20 25 a
*
a a a a aA
*
0 10 20 30 40 50*
B
0 5 10 15 20*
a a a*
aC
TMA O ( µ mol g –1 ) TMA O ( µ mol g –1 ) TMA O ( mmol l –1 )Dec. 1 Jan. 1 Feb. 1 Mar. 1 Apr. 1 May 1 June 1 Warm Ambient 0 3 6 9 12 15 a
*
a a a*
*
a aA
0 2 4 6 8 10 a*
a a a*
*
B
0 2 4 6 8 10C
a*
*
*
a a a a Urea ( µ mol g –1 ) Urea ( µ mol g –1) Urea (mmol l –1)Dec. 1 Jan. 1 Feb. 1 Mar. 1 Apr. 1 May 1 June 1 Warm Ambient
Fig. 4. TMAO levels in warm and ambient smelt. (A) Plasma; (B) muscle; (C) liver. Values are means ±S.E.M. (N=6 initially; N=5
for all other points). aSignificant difference from initial value;
*significant difference between warm and ambient fish (P<0.05).
Fig. 5. Urea levels, in warm and ambient smelt. (A) Plasma; (B) muscle; (C) liver. Values are means ±S.E.M. (N=6 initially; N=5 for all other points). aSignificant difference from initial value;
1424
difference between warm and ambient groups on January 11 (Fig. 7), although levels were variable within groups and there was a trend towards lower levels in the warm-temperature fish.
Liver glycogen
Liver glycogen levels increased dramatically in the warm acclimated fish but remained low in the ambient group (Fig. 8).
However, by March 30, levels of liver glycogen in the warm group had already decreased from the peak on January 11 to a value not significantly different from the initial value. Note that the warm group had significantly higher liver glycogen than the ambient group at all sample periods.
Plasma antifreeze protein
Thermal hysteresis, a measure of AFP activity, increased significantly in both groups by the first month (Fig. 9). However, hysteresis was not significantly different between experimental groups. In the ambient fish, AFP activity continued to increase throughout the experiment, while activity in the warm group leveled off after the initial increase. AFP mRNA expression was significantly higher in January in the ambient fish than in the warm fish (Fig. 10), even though there was no significant difference in AFP activity.
Discussion
Organic osmolytes, antifreeze protein and osmolality Glycerol levels in Newfoundland smelt are in the same range as previously reported for smelt in New Brunswick, Canada (Raymond, 1994; Driedzic et al., 1998) and substantially higher than those of smelt from the Atlantic coast of Nova Scotia (Ewart et al., 2001). Although the TMAO and urea levels observed here are lower than those found by Raymond (1994) in cold-acclimated smelt, the trends seen by us are consistent with these previous studies. The present experiment begins to provide insight into the sequence of events involved in the smelt antifreeze response.
The smelt antifreeze response appears to have already been upregulated by the beginning of our experiment. We found that even at water temperatures around 5 °C, in mid-December, the glycerol accumulation response had already begun, with glycerol levels peaking by January or February 29 in fish tracking ambient temperatures. The TMAO accumulation appeared to be well beyond half-complete by this initial sampling period. Urea accumulation did not seem to begin until January, when ambient temperatures consistently dropped below 2 °C. Although ambient temperatures remained below 0 °C from February 29 to March 30, the plasma and muscle glycerol levels decreased over this time in the ambient-temperature fish.
The group of warm fish began decreasing all measured organic osmolytes either initially (glycerol and urea) or by January (TMAO). This strongly suggests that the mechanisms involved in accumulation of these solutes are turning off or downregulating if temperatures remain warm. Thus, although the accumulation of organic osmolytes may be triggered by decreasing temperature, as shown by previous acclimation studies (Raymond, 1993, 1994; Raymond et al., 1996), maintaining these high levels appears to require continuing low temperatures.
The initial sample had an osmolality of 349 mOsmol kg–1,
which is well within the range given by Holmes and Donaldson (1969) for Salmoniformes, an order that is closely related to the Osmeriformes, to which the smelt belong. This normal
J. R. Treberg and others
Fig. 6. Liver activities of aspartate aminotransferase (AspAT), alanine aminotransferase (AlaAT) and glycerol-3-phosphate dehydrogenase (GPDH) from warm and ambient smelt. Values are means ±S.E.M. (N=6 initially; N=5 for all other points). aSignificant
difference from initial value.
AspA T ( µ mol min –1 g –1) 0 20 40 60 80 100 120 140 a a a Ala AT ( µ mol min –1 g –1) 0 25 50 75 100 125 150 a GPDH ( µ mol min –1 g –1) 0 25 50 75 100 125 150 175 200 a a a a a a
A
B
C
Dec. 1 Jan. 1 Feb. 1 Mar. 1 Apr. 1 May 1 June 1 Warm Ambient
value was obtained despite the fact that we found values of 80 mmol l–1,
14 mmol l–1and 3 mmol l–1for glycerol,
TMAO and urea, respectively. Therefore these organic osmolytes made up approximately one third of the total solutes at a water temperature of 5°C. By February 29, plasma osmolality in both groups was well above normal for marine teleosts, with glycerol, TMAO and urea accounting for slightly less than a third of the total solutes in fish at 0°C.
There was appreciable plasma AFP activity, based on thermal hysteresis, by the time of our initial sample, again suggesting that the antifreeze response had already begun. The AFP activity, after the initial sample, was in the same range as that found in wild smelt caught in February (Duman and DeVries, 1974). Like the accumulation of the
measured organic osmolytes, AFP activity tended to be higher in ambient fish than in warm-temperature fish, with the single exception of the January sample, which appeared to be a result of increased synthesis, as indicated by the increased AFP mRNA expression in the ambient group.
Total plasma organic osmolytes and AFP activity in the ambient group would result in a total freezing-point depression more than adequate for the fish to survive near-freezing marine waters in the ambient group by February 29. These levels were maintained in the ambient group until our final sampling date. It seems that while the colligative antifreeze effect had decreased, the non-colligative AFP activity increased. The data suggest a shift in antifreeze strategy, from an easily regulated
but metabolically expensive enzyme activation/osmolyte system to a less expensive, gene expression AFP system as winter progresses.
Liver glycogen
Liver glycogen levels in ambient fish continually decreased and were significantly less on March 30 than the initial levels in December. However, glycogen reserves were not entirely depleted over the duration of the experiment. In wild-caught osmerid fishes, Raymond et al. (1996) found that levels of storage compounds such as triacylglycerides and glycogen decreased as water temperatures approached and fell below 0 °C. These decreases were attributed to the carbon
Fig. 8. Liver glycogen levels in warm and ambient smelt. Values are means ±S.E.M. (N=6 initially; N=5 for all other points). aSignificant
difference from initial value; *significant difference between warm and ambient fish (P<0.05).
Fig. 9. Plasma thermal hysteresis in warm- and ambient-held smelt. Values are means ± S.D. (N=2–5). aSignificantly different (P<0.05)
from initial value; *significantly different (P<0.05) between warm and ambient fish.
A
RN A le v el (arbitrary units) 0 5 10 15 20 25 30 12 Ambient Warm AmbientB
1 2 3 Warm 1 2 3Fig. 7. Liver glycerol-3-phosphate dehydrogenase (GPDH) mRNA expression in smelt. The blot was probed as described in the Materials and methods. (A) Densitometric analysis of the blots showing mean values ±S.E.M. (B) Blot images for three males sampled on January 11.
Glycogen (
µ
mol glucosyl units g
–1 ) 0 100 200 300 400 500 a
*
*
*
a a aDec. 1 Jan. 1 Feb. 1 Mar. 1 Apr. 1 May 1 June 1 Warm Ambient Thermal hysteresis ( ° C) 0 0.2 0.4 0.6 0.8 a a a a a a
Dec. 1 Jan. 1 Feb. 1 Mar. 1 Apr. 1 May 1 June 1 Warm Ambient
1426
requirement for the synthesis of glycerol. In the present study, the decline in liver glycogen levels could contribute to an increase in glycerol in plasma, muscle and liver but could not account for all of the glycerol production, given a constant loss to the water (Raymond, 1993).
Liver enzymes
Tissue levels of glycerol were already elevated by our initial sample and there was no correlation between glycerol levels and GPDH activity. More specifically, GPDH activity was highest initially and decreased significantly in both groups by February 29, even though glycerol levels were still very high at that time in fish at ambient temperature. Moreover, although the GPDH mRNA levels were approximately twice as high in January in the ambient fish than in the warm fish, the difference was not significant. In contrast, glycerol levels were
approximately threefold higher in the ambient fish and the difference was significant. It appears that if there is a regulatory interval, it occurs prior to December, when water temperatures are above 5 °C. It is possible that GPDH activity increased early in the fall, facilitating rapid glycerol synthesis initially, followed by a subsequent decrease to maintenance levels of activity for the balance of the winter. The observed decrease in GPDH activity by February 29 is followed by relatively constant levels and precedes the observed decrease in glycerol levels, as would be expected if, by February 29, the activity of this enzyme decreases to levels appropriate for maintenance of glycerol metabolism rather than accumulation. These results contrast with those of previous work on smelt from the Atlantic coast of Nova Scotia that did show a significant difference in GPDH mRNA levels between warm- and ambient-acclimated fish in February (Ewart et al., 2001). It would be interesting to determine whether this is a population difference or due to experimental conditions (length of time held at temperature, time of year, etc.).
Amino acids are a major source of carbon for glycerol production in smelt via transamination or deamination to pyruvate or oxaloacetate (OAA) and the phosphorylation of OAA to PEP by PEPCK (Raymond and Driedzic, 1997). In accordance with data from radiolabelled precursors, smelt have very high levels of amino acid-metabolizing enzymes in their liver compared to other teleosts from the same environment (Driedzic et al., 1998). Though we found much lower AspAT activity and higher AlaAT activity than the previous study, our data are consistent with the trend shown by Driedzic et al. (1998) in that our initial aminotransferase activities are still several-fold higher than in other teleosts sampled in the earlier study. Both AspAT and AlaAT did not significantly differ between the warm- and ambient-maintained fish. Though AspAT did show a transient increase
in January, which was significantly higher than the initial values in the warm group, both groups returned to activities roughly equivalent to their initial levels in February and
J. R. Treberg and others
0 2 4 6 8 10 12 14 16 18 20
A
RN A le v el (arbitrary units) AmbientB
Warm 1 2 3 1 2 3 Ambient Warm*
Glucose FBPGAP DHAP G3P Glycerol
PEP OAA Pyruvate Glutamate Glutamate Glutamate Alanine Aspartate αKG αKG + NH4+ αKG Urea 1 2 3 4 5 6 6 7 8 9
Fig. 11. Proposed pathways for the production of glycerol in smelt. FBP, fructose-1,6-bisphosphate; GAP, glyceraldehyde-3-phosphate; DHAP, dihydroxyacetone phosphate; G3P, glycerol-3-phosphate; PEP, phosphoenolpyruvate; OAA, oxaloacetate; αKG, alpha-ketoglutarate. Enzymes are (1) aspartate aminotransferase; (2) alanine aminotransferase; (3) glutamate dehydrogenase; (4) pyruvate carboxylase; (5) phophoenolpyruvate carboxykinase; (6) aldolase; (7) triose isomerase; (8) glycerol-3-phosphate dehydrogenase; (9) glycerol-3-phosphatase. Dotted arrows indicate multiple conversion steps.
Fig. 10. Liver AFP mRNA expression in smelt. The blot was probed as described in Materials and methods. (A) Densitometric analysis of the blots; values are means ±
S.E.M. (N=3). (B) Blot images for three males sampled on January 11. *Significant difference (P<0.05).
March. Interestingly, Raymond and Hassel (2000) found that there was a significant increase in AspAT activity in wild-caught smelt sampled in February compared to fish wild-caught November. Levels of both aminotransferases significantly decreased from initial levels in the final sample period and were very close to what could be thought of as the ‘normal’ teleost range. This suggests that levels of these enzymes increase prior to winter, which would allow for increased glycerol production from amino acids.
It is important to note that all respective enzyme activities did not significantly differ between groups. Thus, in warm-acclimated fish, the decrease in glycerol does not appear to be a result of decreased synthetic capability or downregulation at these loci. In fact, because of an expected increased rate of reaction with increased temperature, the warm-acclimated group presumably could convert precursors to glycerol at a greater rate than those held at ambient temperatures.
By early December, the smelt antifreeze mechanisms already appear to be activated. This may be due to changes in photoperiod, changes in water temperature or perhaps a combination of factors. There appears to be a separation of the non-colligative and colligative mechanisms, since in fish maintained above ambient temperatures levels of the organic osmolytes glycerol, TMAO and urea all decreased, whereas AFP activity and mRNA expression remained significantly elevated from initial levels. In addition, the antifreeze mechanisms appear to activate asynchronously, the initial major response being the accumulation of glycerol (and other organic osmolytes), followed by the accumulation of other plasma solutes (presumably inorganic ions) and, finally, the non-colligative AFP. The decreases in the levels of GPDH, AlaAT and AspAT would suggest that they play roles in the winter acclimation of smelt. Amino acids are a major carbon source for glycerol (Raymond and Driedzic, 1997), and the urea accumulation, in parallel with glycerol, may be a result of the deamination of amino acids, as outlined in Fig. 11.
The authors wish to thank the field services unit of the Ocean Sciences Centre for animal collection, Dr P. H. Yancey for assistance with the TMAO assay, and Dr Neil Ross for helpful review of the manuscript. This work was funded by an NSERC operating grant to W.R.D. and by the NRC Institute
for Marine Biosciences. This is NRC publication number 42356 and OSC publication number OSC-2002-02.
References
Anderson, P. M.(1995). Urea cycle in fish: Molecular and mitochondrial studies. In Fish Physiology, Vol. 14, Cellular and Molecular Approaches
to Fish Ionic Regulation (ed. C. M. Wood and T. J. Shuttleworth), pp.
57–83. San Diego: Academic Press.
Driedzic, W. R., West, J. L., Sephton, D. H. and Raymond, J. A.(1998). Enzyme activity levels associated with the production of glycerol as an antifreeze in the liver of rainbow smelt (Osmerus mordax). Fish Physiol.
Biochem. 18, 125–134.
DeVries, A. L.(1982). Biological antifreeze agents in coldwater fishes. Comp.
Biochem. Physiol. 73A, 627–640.
Ewart, K. V. and Fletcher, G. L.(1990). Isolation and characterization of antifreeze proteins from smelt (Osmerus mordax) and Atlantic herring (Clupea harengus harengus). Can. J Zool. 68, 1652–1658.
Ewart, K. V., Blanchard, B., Johnson, S. C., Bailey, W. L., Martin-Robichaud, D. J. and Buzeta, M. I. (2000). Freeze susceptibility in haddock (Melanogrammus aeglefinus). Aquaculture 188, 91–101.
Ewart, K. V., Rubinsky, B. and Fletcher, G. L. (1992). Structural and functional similarity between fish antifreeze proteins and C-type lectins.
Biochem. Biophys. Res. Commun. 185, 335–340.
Ewart, K. V., Richards, R. C. and Driedzic, W. R. (2001). Cloning of glycerol-3-phosphate dehydrogenase cDNAs from two fish species and effect of temperature on enzyme expression in rainbow smelt (Osmerus
mordax). Comp. Biochem. Physiol. B 128, 401–412.
Holmes, W. N. and Donaldson, E. M.(1969). The body compartments and distribution of electrolytes. In Fish Physiology, Vol. 1, Excretion, Ionic
Regulation and Metabolism (ed. W. S. Hoar and D. J. Randall), pp. 1–89.
New York: Academic Press.
Raymond, J. A.(1992). Glycerol is a colligative antifreeze in some northern fishes. J. Exp. Zool. 262, 347–352.
Raymond, J. A. (1993). Glycerol and water balance in a near-isosmotic teleost, winter-acclimated smelt. Can. J. Zool. 71, 1849–1854.
Raymond, J. A.(1994). Seasonal variations of trimethylamine oxide and urea in the blood of a cold-adapted marine teleost, the rainbow smelt. Fish
Physiol. Biochem. 13, 13–22.
Raymond, J. A. (1995). Glycerol synthesis in the rainbow smelt Osmerus
mordax. J. Exp. Biol. 198, 2569–2573.
Raymond, J. A.(1998) Trimethylamine oxide and urea synthesis in rainbow smelt and some other northern fishes. Physiol. Zool. 71, 515–523.
Raymond, J. A. and Driedzic, W. R.(1997). Amino acids are a source of glycerol in cold-acclimatized rainbow smelt. Comp. Biochem. Phsyiol.
118B, 387–393.
Raymond, J. A., Hattori, H., and Tsumura, K.(1996). Metabolic responses of glycerol-producing Osmerid fishes to cold temperature. Fish. Sci. 62, 257–260.
Walass, O. and Walass, E.(1950). Effect of epinephrine on rat diaphragm.
J. Biol. Chem. 187, 796–776.
Wekell, J. C. and Barnett, H. (1991). New method for analysis of trimethylamine oxide using ferrous sulfate and EDTA. J. Food Sci. 56, 132–135.
Wright, P. A. (1995). Nitrogen excretion: Three end products, many physiological roles. J. Exp. Biol. 198, 273–281.