Capacity Analysis, Cycle Time Optimization, and Supply Chain Strategy in
Multi-Product Biopharmaceutical Manufacturing Operations
MASSACHUSETTS INSTITUTE
by OF TECHNOLOGY
Kacey L. Fetcho-Phillips
JUN
15 2011
B.S. Chemical Engineering, Purdue University, 2002 LIBRARIES
ARCHIVES
Submitted to the MIT Sloan School of Management and the Department of ChemicalEngineering in Partial Fulfillment of the Requirements for the Degrees of
Master of Business Administration and
Master of Science in Chemical Engineering
In conjunction with the Leaders for Global Operations Program at the Massachusetts Institute of Technology
June 2011
C 2011 Massachusetts Institute of Technology. All rights reserved. Signature of Author
MIT Sloan School of Management, Department of Chehilcal Engineering May 6, 2011 Certified by
-Andreas ulz, Thesis Supervisor Patrick T. McGovern (1959) Professor of M gement and Mathematics of
Certified by
Charles Cooney, Thesis Supervisor
TN I Y 1- 1fiI\fl it'Tr~ i~ Pnry;npring
Accepted by
Debbie Berechman, llxecutive Director oi iviusA rrogram MIT Sloan School of Management Accepted by
William Deen, Graduate Committee Chairman Department of Chemical Engineering
Capacity Analysis, Cycle Time Optimization, and Supply Chain Strategy in
Multi-Product Biopharmaceutical Manufacturing Operations
by
Kacey L. Fetcho-Phillips
Submitted to the MIT Sloan School of Management and the Department of Chemical Engineering in Partial Fulfillment of the Requirements for the Degrees of
Master of Business Administration and
Master of Science in Chemical Engineering
In conjunction with the Leaders for Global Operations Program at the Massachusetts Institute of Technology
Abstract
Application of system optimization theory, supply chain principles, and capacity
modeling are increasingly valuable tools for use in pharmaceutical manufacturing facilities. The dynamics of the pharmaceutical industry - market exclusivity, high margins, product integrity and contamination constraints - coupled with increasing cost pressures, demand for specialized products increase, and growing industry complexity makes analytical business decisions necessary to sustain competitive advantage.
The united application of capacity modeling, system optimization, and supply chain analysis tools, paired with implementation strategies on a multi-product vaccine production system are detailed to address important business difficulties.
Thesis Supervisor: Andreas Schulz
Title: Patrick J. McGovern (1959) Professor of Management and Mathematics of Operations Research
Thesis Supervisor: Charles Cooney
Acknowledgements
To my Novartis supervisor, Rob May, thank you for your conception and support of this project, and for your mentoring during my internship.
To my LGO colleagues at Novartis Vaccines - Todd Waldron, Cynthia Wilson, Dannielle Sita, and Chris Hopkins - Thank you for your support throughout my internship; it was my pleasure to share in this experience together with you. Your shared knowledge across the Novartis Vaccines network enriched my work and growth.
Ai miei amici brasiliani - Luana Faria, Laila Obata, Joio Acioli, Guilherme Goyos, and
Francisco Souza Junior - You each helped brighten every day during our six months together in Italy.
A Giancarla Bindi, grazie mille per it tuo aiuto nell'imparare l'italiano; senza di te, il
tempo che ho passato in Italia sarebbe stato mo/to piu' difficile e meno bello.
To my advisors Andreas Schulz and Charles Cooney, for your support and guidance throughout the project and thesis construction. To Don Rosenfield, for guiding new project opportunities. To Shashi Mittal, for your kind collaboration and for sharing your scheduling and coding expertise.
To Don Rosenfield, immense thanks and appreciation to you for the development of the Leaders for Global Operations Program. To the amazing LGO Class of 2011, my high
expectations of this experience have been wildly exceeded and my growth and development has exponentially grown together with all of you. I look forward to continuing the experience with new lifelong friends created in this journey.
Finally, I give much love and gratitude to my family. To my parents, Mike and Maggie Fetcho, for lifelong development and creating a supportive, open environment for the
development of my brother Eric and I. To my husband and son, Chris and Nolan Phillips, I owe endless appreciation and thanks for your love, support, sacrifices, and perspectives during our time together at MIT.
Table of Contents
A cknow ledgem ents ... 5
List of Figures ... 13
List of Tables...15
List of Equations ... 17
G lossary, D efinitions, and Abbreviations ... 18
1. Introduction ... 21
1.1. Project Situation... 21
1.2. Project Overview ... 21
1.3. Project M otivation and Im pact... 22
1.3.1. Project Goals ... 22
1.3.2. Im pact of Project ... 22
1.4. Thesis Overview ... 23
2. Overview, Current Challenges, and Manufacturing Strategy ... 25
2.1. Industry Overview ... 25
2.1.1. Costs and Im portance ... 25
2.1.1.1. Quality A djusted Life Y ears (QA LY s)... 26
2.1.1.2. Prevention versus Treatm ent... 28
2.2. V accine Industry ... 30
2.2.1. Purpose of V accines ... 30
2.2.2. Types of V accines ... 30
2.2.3. Regulatory Dynam ics... 30
2.2.5. Dem and with Epidem ics ... 31
2.2.6. Herd Im m unity ... 31
2.3. Com pany -N ovartis... 34
2.4. N ovartis Vaccines Division ... 34
2.4.1. Form ation of Division... 34
2.4.1. Key Products... 35
2.4.1. M eningitis... 35
2.4.2. Influenza... 36
2.5. Siena/Rosia Site and Dynam ics... 36
2.5.1. Facility - Bacterial Operations in Rosia, Italy ... 37
3. Project Approach and M ethodology ... 38
3.1. Overview . ... ... 38
3.2. Project Scope ... 38
3.3. Im pact to Production Decisions System ... 39
3.4. Facility Overview ... 40 3.5. Variable Definitions... 41 3.5.1. Input Variables ... 41 3.5.2. Output Calculations... 43 3.5.3. Decision Variables ... 43 3.5.4. Process Constraints ... 44
4. Capacity M odeling and Sim ulation... 45
4.1. Capacity Analysis and Theory... 45
4.2. Defining Capacity...46
4.3. A pproach...46
4.3.1. M odel Capabilities ... 47
4.3.2. A udience... 47
4.3.3. A ccess to M odel and Softw are... 47
4.3.4. Ease of U se... 47
4.3.5. U nderstanding M odel... 48
4.3.6. O ne-tim e Project V ersus M ulti-use M odel ... 48
4.3.7. Projected V alue of M odel D ata... 48
4.3.8. Level of D etail and Preciseness Required... 48
4.3.9. D ata A vailability ... 49
4.3.10. Integration w ith Other System s ... 49
4.4. H istory of M odeling at Facility... 49
4.5. Political D ynam ics of M odels... 50
4.6. M odel Softw are Selection... 51
4.7. Bacterial Operations M odeling Selection... 52
4.8. D ata Collection ... 53
4.9. M odel D evelopm ent and Validation... 53
4.10. Sensitivity Analysis and Sim ulation ... 53
4.11. M odel Im plem entation and Recom m endations... 54
4.11.1. Exploratory Stress... 54
5. Cycle Tim e Optim ization... 58
5.1. Introduction... 58
5.3. Schedule Optimization Use in Biotechnology Manufacturing ... 59
5.4. Cycle Tim e A nalysis... 59
5.4.1. Problem Setup U sing Triplet Term inology ... 60
5.4.2. Problem Statem ent ... 61
5.5. Optim ization M odel D evelopm ent ... 61
5.5.1. Decision V ariables ... 61
5.5.2. Objective Function ... 62
5.5.3. Constraints... 62
5.5.4. M odel Characteristics... 63
5.5.5. System Optim ization Equations...63
5.5.6. M odel Param eters... 64
5.5.7. Increm ental M odel Developm ent... 64
5.6. Validation...65
5.7. Analysis and Recom m endations... 65
5.8. Sensitivity Analysis... 66
5.9. A ssum ptions and N ext Steps ... 66
6. Supply Chain Calculations... 67
6.1. Supply Chain in the V accine Industry ... 67
6.2. Supply Chain Strategy ... 69
6.3. Prom otion of Change ... 70
6.4. General Product Flow Through Manufacturing Supply Chain...70
6.5. N ovartis Vaccine Supply Chain... 72
6.6. D em and... 74
6.6.1. Market Demand Predictions... 74
6.6.2. Secondary Manufacturing Production Demand ... 75
6.7. Final Inventory Characteristics for Multi-Valent Product ... 76
6.8. Calculations... 77
6.8.1. Reorder Point... 77
6.8.2. Safety Stock Based on Demand ... 77
6.8.3. Production Lead Time... 78
6.8.4. Economic Production Quantity (EPQ)... 79
6.8.5. Doses per Batch... 80
6.8.6. Value of Product per Gram ... 81
6.8.6.1. Percentage Cost of Bulk Multi-Valent Product by Antigen ... 82
6.8.7. Optimal Number of Campaigns per Year ... 83
6.8.8. Production Needed in Given Inventory Review Period ... 83
6.8.9. Demand in Units of Grams or Batches... 84
6.9. Product Changeover... 85
6.10. Risk Management... 86
6.11. Intermediate W ork-in-Progress Inventory ... 87
6.11.1. Stability Hold Point for Prevention of Product Degradation... 87
6.11.2. Decrease Holding Cost ... 88
6.11.3. Postponement...89
6.11.4. Delay Value Added Step... 90
6.11.5. Production Smoothing ... 90
7. Organizational Dynamics and Change Implementation... 91
7.1. Introduction... 91
7.2. M easurement of Change within Organization... 91
7.3. W orse-Before-Better Effect of Change Implementation ... 91
7.4. Implementation of Change within Organization... 93
7.4.1. Italian Culture... 93
7.4.2. Novartis Organization ... 94
7.5. Impact of Project Dynamics in Change Implementation... 95
8. Recommendations and Conclusions...97
8.1. Capacity M odeling ... 97
8.2. Cycle Time Optimization... 97
8.3. Supply Chain Analysis... 97
8.4. Organizational Dynamics and Change Implementation for Novartis...97
8.5. Conclusion... 98
9. Bibliography...99
10 . A p p en d ix ... 10 5 10.1. Appendix A: M odeling Software Comparison Analysis...105
List of Figures
Figure 2-1 Cost per QALY as Measure of Treatment Approval (16)...28
Figure 2-2 Diabetes Prevention Versus Treatment System Dynamics Model (18)...29
Figure 2-3 Infection Flow as System Dynamics Model (29)...32
Figure 2-4 Epidemic Infection System Dynamics Model (17) ... 33
Figure 2-5 Tipping Point Loop Dominance Structure of an Epidemic Infection (17)...33
Figure 2-6 M enveo Logo (35)... 35
Figure 3-1 Production Decision Making Framework (41)...39
Figure 4-1 Example Process Model in SuperPro ... 53
Figure 4-2 Icebergs of Danger ... or Opportunity...55
Figure 4-3 Stress Testing Process (as presented by Meier, et.al.) (50)...56
Figure 5-1 Sample Gantt Chart Display of System Optimization Schedule ... 65
Figure 6-1 Logistics Expenditures Versus Sales for Various Industries (56)...68
Figure 6-2 Typical Manufacturing Flow for Biotech/Vaccine Production...70
Figure 6-3 Vaccine Sample Supply Chain Diagram...71
Figure 6-4 Distribution of Final Product Packaging - Menveo ... 72
Figure 6-5 Distribution of Final Product Packaging - Menjugate ... 73
Figure 6-6 Distribution of Final Product Packaging - Hib ... 73
Figure 6-7 Market Demand Predictions, in Grams of Antigen...74
Figure 6-8 Menveo Downstream Manufacturing Production Cycle...75
Figure 6-9 Annual Lyophilization Production, Aggregated Weekly ... 76
Figure 6-10 Economic Order/Production Quantity Trade-off (56)...79
Figure 6-11 Inventory Level of Intermediate Product with Campaign Processing of Upstream and Downstream M anufacturing...84
Figure 6-12 Sample Stability Hold Points for Pharmaceutical Products ... 87
Figure 6-13 Estimated Refrigeration Equipment Cost as a Function of Refrigeration T em p erature (6 1) ... 88
Figure 7-1 Worse Before Better: Cost Savings of Improvement Program (64)...92 Figure 7-2 Improvement Project Cycle System Dynamics Diagram (64) ... 92 Figure 10-1 Supply Chain Analysis Dashboard...107
List of Tables
Table 1-1 Glossary, Definitions, and Abbreviations...18
Table 2-1 Reasons for Creation of NICE (16) ... 26
Table 2-2 Quality of Life Valuation by Health State (Adaptedfrom Phillips) (10) ... 27
Table 3-1 Menveo Production Overview (Adaptedfrom FDA Memorandum) (42)...40
Table 3-2 Manufacturing Steps of Menveo Antigen (Adaptedfrom FDA Memorandum) (4 2 )...4 0 Table 3-3 Manufacturing Equipment Components (Adaptedfrom FDA Memorandum) (4 2 )...4 0 Table 3-4 Utilities in Manufacturing (Adaptedfrom FDA Memorandum) (42) ... 40
T able 3-5 Input V ariables... 41
Table 3-6 O utput Param eters... 43
Table 3-7 D ecision V ariables... 43
Table 3-8 Process Constraints... 44
Table 4-1 Model Development Decision Factors ... 46
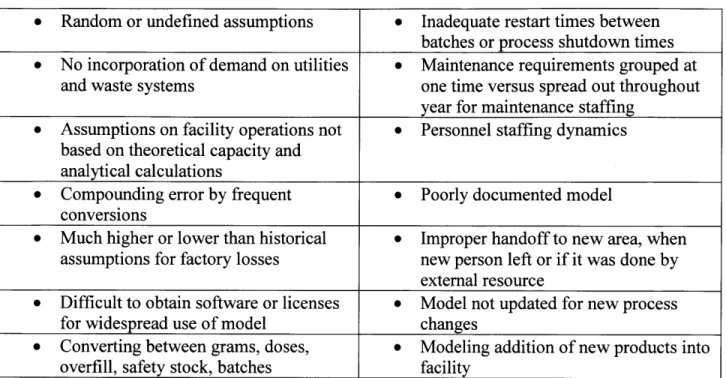
Table 4-2 Common Problems in Capacity Modeling... 50
Table 4-3 Political Dynamics of Models... 51
Table 4-4 Modeling Software Selection Considerations...51
Table 4-5 Resources for Software Evaluation...52
Table 4-6 Detailed Stress Testing Parameters (adaptedfrom Meier, et.al.) (50)...56
Table 5-1 Modeling Project Plan Steps (51)... 59
Table 5-2 Triplet Terminology (as adaptedfrom Pinedo) (47)... 60
Table 5-3 Scheduling Triplet Terminology...61
Table 5-4 Decision Variables for Optimization Function... 62
Table 5-5 System Optimization Function Constraints ... 62
Table 5-6 System Optimization Model Characteristics ... 63
Table 6-1 Risks of Improper Supply Chain Management in Pharmaceutical
M anu facturin g ... 67
Table 6-2 Critical Business Reasons for Proper Supply Chain Management in the Pharm aceutical Industry ... 68
Table 6-3 Dynamics of Product Changeover ... 86
Table 6-4 Benefits of Increased Product Changeover...86
Table 6-5 Risk Management Mechanisms in Pharmaceutical Manufacturing ... 86
Table 6-6 Reasons to Hold Intermediate Inventory ... 87
Table 7-1 Metrics for Analysis During Change Implementation...91
List of Equations
Equation 4-1 Cost of Exceeding or Under Producing Demand (44)...45
Equation 5-1 Definition of Variables (54) ... 63
Equation 5-2 Processing Order Constraint (54)...63
Equation 6-1 Service Level (57) ... 69
Equation 6-2 R eorder Point... 77
Equation 6-3 Safety Stock as a Fraction of Demand ... 78
Equation 6-4 Production Lead Time for Economic Production Quantity...78
Equation 6-5 Production Lead Time ... 78
Equation 6-6 Economic Production Quantity ... 80
Equation 6-7 H olding Cost... 80
Equation 6-8 D oses per Batch... 81
Equation 6-9 Market Value of Product per Gram... 82
Equation 6-10 Percentage Cost of Bulk Multi-Valent Product by Antigen...82
Equation 6-11 Optimal Number of Campaigns per Year...83
Equation 6-12 Production Needed ... 84
Equation 6-13 Demand, in units of Grams Needed ... 85
Glossary, Definitions, and Abbreviations
Table 1-1 Glossary, Definitions, and Abbreviations
A substance that increases the immune system reaction to the antigen, and thus requires less antigen per patient to produce Adjuvant desired response (1)
A substance that causes immune systems to produce antibodies Antigen against the substance (2)
Aseptic Technique used to prevent infection (3)
The sale of bulk quantities of commodity product from the lowest Bid and Tender bidder, typically a large organization such as a government.
Batch production records, documents used to record actions and BPR parameters during manufacturing process
A solution containing chemicals auxiliary to the product stream Buffer used in pharmaceutical manufacturing
Description of type of manufacturing that produces the primary Bulk active ingredient or antigen in whole, purified form
A purification process used to separate waste from product in Chromatography pharmaceutical manufacturing; often uses a resin and buffer
A protein joined with the polysaccharide to increase desired Conjugate immune response (3)
Mathematical statements that limit or impose requirements on the Constraints relationships between decision variables (4)
CS Clean steam, a process utility used in manufacturing Decision
Variables The unknown parameters which are to needed be determined (4) Diluent A liquid added to a vaccine to dilute or dissolve the antigen EPQ Economic Production Quantity
Voluntarily creating a strained, atypical environment for a system Exploratory to learn how the system reacts and fails under controlled
Stress circumstances, to then prevent future failures FDA Federal Drug Administration, United States GUSEK An open-source solver which uses GLPK GLPK A linear programming solver for windows
HHS Department of Health and Human Services, United States Hib Haemophilus Influenza Type B
Heating, Ventilating, and Air Conditioning; a process utility used in
HVAC manufacturing
A signal-based system to visually indicate a need in a "pull" system
Leaders for Global Operations, a dual-degree program at
Massachusetts Institute of Technology for an Master of Business Administration (MBA) or Master of Science in Management from MIT Sloan School of Management and Master of Science from the LGO MIT School of Engineering
LTD Lead Time Demand
Freeze drying of a substance to remove water through sublimation Lyophilization and desorption (6)
Makespan The duration of time to complete a job mds Million doses of vaccine, a unit of measure
Meningitis An inflammation caused by an infection of the neurological (Men) protective membranes (1)
A vaccine for the treatment and prevention of meningococcus C Menjugate infections caused by the pathogen Neisseria meningitides (7)
A vaccine for active immunization to prevent meningococcal infections (Groups A, C, Y, and W- 135) caused by Nesseria Menveo meningitidis serogroups A, C, Y, and W-135 (8)
MIT Massachusetts Institute of Technology NHS National Health Service, United Kingdom
National Institute for Health and Clinical Excellence, United
NICE Kingdom
NVD Novartis Vaccines and Diagnostics
Objective Mathematical expression that incorporates the constraints to find Function the optimal result
A small amount of excess material filled into a container above the specified amount of product to ensure sufficient material is
Overfill available for dosing
P&ID Piping and instrumentation drawings
Insurer, employer who provides employee benefit health coverage, Payors or regional or federal government (9)
PFD Process flow diagrams
Description of type of manufacturing that produces the primary Primary active ingredient or antigen in whole, purified form
PW Purified water, a process utility used in manufacturing
A measure of the effectiveness of a pharmaceutical product or healthcare treatment accounting not only for the quantity of life but QALY, Quality- also the quality of life. A QALY is the arithmetic product of life adjusted Life expectancy and the quality of the life, as a fraction no greater than Year 1.0, representative of full quality of life. (10)
Resin A material used in chromatography to purify products
A small town about a half-hour drive from Siena, Italy in the Rosia, Italy Tuscan region
A description of a type of manufacturing that is downstream of Secondary primary manufacturing that secures the material into a delivery Manufacturing mechanism (e.g. vial, capsule, tablet)
Sensitivity Review of how the solution to a mathematical problem changes Analysis when the constraints and assumptions are relaxed
A group of related microorganisms with a common set of antigens
Serotype (3)
SME Subject matter expert
SOP Standard operating procedures
A delivery device used to inject fluid into the body (3); vaccine Syringe, Pre- delivery presentations include syringes which are pre-manufactured filled Syringe with product
Immunization that contains weakened or dead organisms that create immunity in the body against diseases without introducing the
Vaccine disease
Description for the mechanisms of action of a product (e.g. Valent monovalent, multivalent)
The necessary activities in a process that create or add value to a Value Stream customer (11)
Vial A small, closed vessel for liquids (3)
Water for Injection, a process utility used in pharmaceutical
WFI manufacturing
WIP Work in Progress
WHO World Health Organization
1. Introduction
1.1. Project Situation
This thesis is the result of a six and a half month internship with Novartis Vaccines in Rosia, Italy as a fellow in the Massachusetts Institute of Technology Leaders for Global
Operations program. The internship is a research-based component of the two year dual-degree program for a Master of Business Administration and a Master of Chemical Engineering.
The active ingredient multi-product vaccine facility in Rosia, Italy currently makes five different bulk products, or intermediates, for several vaccine products and is the launch facility for new bulk vaccines. Currently the facility is not capacity constrained, but production
requirements will increase with the growth of current products and introduction of new products. 1.2. Project Overview
The Bacterial Operations bulk active ingredient production facility in Rosia, Italy currently material product for three products, Menveo (Meningococcal A, C, W-135, and Y), Menjugate (Meningococcal C), and Haemophilus Influenzae Type B (Hib). The Rosia Bacterial
Operations facility currently operates under full production capacity. As the primary launch facility for many new Novartis Vaccine products, the management seeks to better understand the operational capabilities and facility constraints. Additionally, through cycle time reduction, processing improvements, scheduling optimization, and supply chain strategy, operating capacity
can be increased.
This situation is reviewed in three primary components.
" A model of facility capacity for analysis of the introduction of new molecules and evaluation of the impact of increased production of existing products.
" A system optimization function to review production scheduling for operational improvements and evaluation of theoretical bottlenecks.
e Supply chain analysis for analytical determination of key parameters, including
changeover frequency, reorder point, demand production needed, inventory levels, economic production quantity, and lead time production demand.
In this thesis, proprietary data has been disguised; example data is provided for explanation of ideas and concepts only.
1.3. Project Motivation and Impact
The Rosia Bacterial Operations is a manufacturing launch facility for new products, and is an important site for the growth of Novartis Vaccines. The facility was acquired by Novartis with the 2006 acquisition of a vaccine company named Chiron. Improvements across the newly formed Novartis vaccine division are progressing with significant investment from Novartis.
1.3.1. Project Goals
The goals of the project include first increasing understanding of the facility capabilities, and then applying the understanding to operational improvements. Through modeling and capacity analysis, restrictions of the facility and operational opportunities are identified. Scheduling decisions are compared for options between various scenarios within long-range schedule planning. Also, opportunities are identified for production improvements through operational efficiencies and strategic supply chain changes, including product changeover and location of inventory holding throughout the manufacturing value chain.
1.3.2. Impact of Project
The implementation of these changes has strong effect on analytical decision-making within the manufacturing strategy group. The data produced is particularly important for evaluation of in-house capacity, additional capacity expansion decisions, and consideration of third-party outsourcing manufacturing options.
Within the facility, several strategies can be aligned to the results of this project. Capital investments and improvement projects can now be better focused to critical areas with most value for the effort towards increasing flexibility and capacity. The projects also focus on opportunities to improve cycle time and production output in these key areas. The supply chain
calculations identify where to best strategically place inventory, where to eliminate non-value added inventory, and how to obtain the most value for each unit of changeover cost. These changes are crucial to increasing the benefit to the organization of the existing production assets and resources. Modeling current capacity, evaluating production scenarios, and optimizing cycle time will increase production understanding throughout the organization.
1.4. Thesis Overview
This thesis will begin with a review of the pharmaceutical industry, including specific dynamics special to the vaccine business. An overview of Novartis background and history of the vaccines division of the company will follow, with particular emphasis on the Bacterial Operations in Rosia, Italy. Next, the approach to the problem is presented with supporting research theory tied with overarching project methodology. Key conditions, variables, and constraints are introduced here to create a unified approach across the techniques of analysis.
The first of three detailed techniques presented in this thesis is capacity analysis and simulation, including defining capacity, modeling and simulation approach and techniques, political dynamics of modeling, and the implications of modeling results. Following model development, validation, sensitivity analysis, model recommendations, and using exploratory
stress tools are reviewed.
Cycle time improvement techniques are reviewed through the development of an optimization function. Development plan and strategies are reviewed with a detailed presentation of the equations and model development, and how these tools are applied to
improve operational capacity.
In the following chapter, the supply chain is reviewed for products from the Bacterial Operations facility in Rosia. Essential supply chain parameters are calculated, including
economic production quantity, product changeover frequency, production batches needed, safety stock of inventory, and optimal number of campaigns per year. Risk balancing, inventory holding strategy, and demand uncertainty topics are explored.
Lastly, organizational dynamics and change implementation techniques are reviewed as an important factor in success to project implementation. In conclusion, recommendations are presented, uniting the multiple forms of analysis used across the project.
2. Overview, Current Challenges, and Manufacturing Strategy 2.1. Industry Overview
As described by Fine in Clockspeed, the pharmaceutical industry began with a "sleepy" rate of change, strong growth, and high barriers to market entry (12). Pharmaceutical products take nearly a decade to be discovered, tested, validated, and approved for sale. Particularly with the introduction of biopharmaceutical products, the double-helix described by Fine has
progressed to strong horizontal and modular integration with many partnerships, enhancing the ability to leverage cross-functional skills and produce products more quickly. This change in complexity comes not just with increasing speed, but also increased regulations across developed countries and the beginning of emerging market regulatory agencies. The industry demand is also expanding as the rate of consumption in emerging markets increases.
2.1.1. Costs and Importance
One of the most significant factors in the future of the industry is cost. The financial expense and benefit of pharmaceutical products dictate the global approvals by regulatory agencies, payors, and significantly impact capacity requirements for manufacturing.
As described by Berndt, "Access to health care is considered by many to be a personal right or universal entitlement, unlike access to other goods and services," (9). The
pharmaceutical industry represented about $550 billion of healthcare costs, or about 10%, in 2007 (13). The cost of pharmaceutical products lead the increase in health care expenses in the
1990s (14), and grew at a rate of 9.4% from 2001 to 2006, more than twice the annual rate of inflation (15). Increasing life expectancy and aging of the population average heightens impact and emphasis on health care reform and cost reduction. However, many opportunities exist across the pharmaceutical value and distribution chains to improve service levels, efficiencies, and reduce costs to customers and payors (13).
In particular, two factors which are progressively influencing health care cost
versus treatment care. These will strongly impact the approval and uptake of pharmaceutical, biotech, and vaccine products. In turn, this will impact the amount of product demand needed from manufacturing and also increase demand uncertainty and difficulty of manufacturing capacity planning.
2.1.1.1. Quality Adjusted Life Years (QALYs)
The United Kingdom's National Health Service (NHS) created NICE, the National Institute for Health and Clinical Excellence in the 1990s to address concerns about the health care industry in the UK.
Table 2-1 Reasons for Creation of NICE (16) Slow uptake of new technologies and practices
Widespread variation in the nature and quality of care Growing public concern and increasing media criticism
Government commitment to improve the quality and range of care
Prospect of significant reinvestment in the NHS: plan to grow from about 6.5% to about 9% of GDP
A primary purpose of NICE is to provide guidance based on not only clinical
effectiveness but cost effectiveness. The organization is designed to increase education to more informed consumers and provide increased value to the health care network (16).
The QALY measurement is used by NICE to gauge the quality of life improvement gained with a treatment option, and then used to compare treatment options with cost
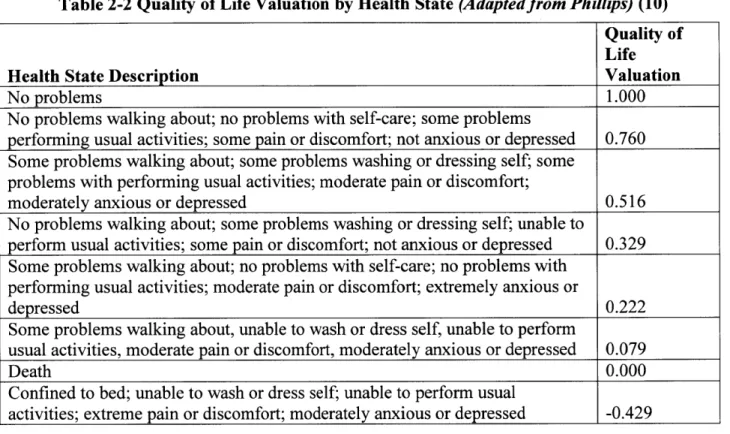
consideration. This factor is then multiplied by the duration of life for an overall QALY value. An example of how the quality of life is determined against five categories of health is presented in Table 2-2. For a more detailed introduction into the calculation of QALYs, refer to What is a
Table 2-2 Quality of Life Valuation by Health State (Adaptedfrom Phillips) (10) Quality of Life
Health State Description Valuation
No problems 1.000
No problems walking about; no problems with self-care; some problems
performing usual activities; some pain or discomfort; not anxious or depressed 0.760 Some problems walking about; some problems washing or dressing self; some
problems with performing usual activities; moderate pain or discomfort;
moderately anxious or depressed 0.516
No problems walking about; some problems washing or dressing self; unable to
perform usual activities; some pain or discomfort; not anxious or depressed 0.329 Some problems walking about; no problems with self-care; no problems with
performing usual activities; moderate pain or discomfort; extremely anxious or
depressed 0.222
Some problems walking about, unable to wash or dress self, unable to perform
usual activities, moderate pain or discomfort, moderately anxious or depressed 0.079
Death 0.000
Confined to bed; unable to wash or dress self; unable to perform usual
activities; extreme pain or discomfort; moderately anxious or depressed -0.429
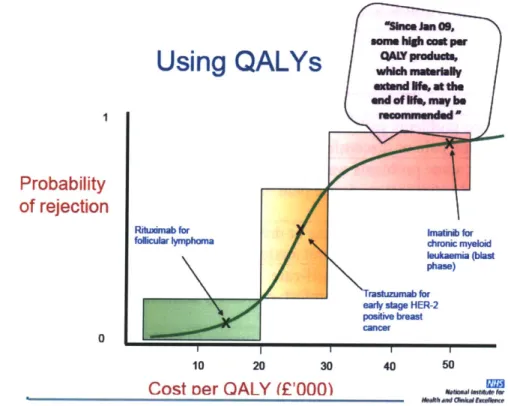
Because of this, a unit of currency/QALY is frequently used to compare treatment regimens and recommendations for approval of use, as shown in Figure 2-1.
Using QALYs
"N", ian 00, - higi cos pw QAWroud andof tU may beProbability
of rejection
Ribaimab for kimaib for
folicular ym ma chronic myeloid leukaelma
-(ast
phase) Trastuzumnab for early stage HER-2 Positive breast
10 20 30 40 50
Cost
oer OALY
(F'000).
Figure 2-1 Cost per QALY as Measure of Treatment Approval (16)
However, this analysis is not without controversy. Execution of practice shows that companies may strategically place the price of products just high enough to be recommended for approval based on cost per QALY. The cost per QALY parameter also creates a controversial stance of the cost of human life and that a life has an upper-bound of value. As quality-based metrics of efficacy such as QALYs become more popular world-wide, this will have a strong impact on the needed manufacturing capacity of health care products.
2.1.1.2. Prevention versus Treatment
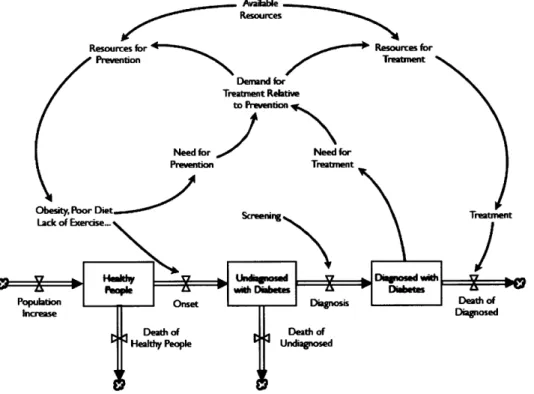
In society, there is often a resource pull between the treatment of disease-afflicted patients versus allocating resources for prevention. As shown within a system dynamics model in Figure 2-2, the cycle of diabetes prevention and treatment are interrelated. The amount of total
resources is limited; therefore, the amount of money spent on treatment of current patients diminishes the amount of funds available for disease prevention in healthy people. This over time creates a cycle of worsening diabetes epidemic over time, called a negative reinforcing
28
loop. (For additional information on system dynamics modeling, refer to Sterman, Business
Dynamics (17).)
Availabe Resources
Resources for Resources for
Prevention Treatment
Demand for Treatnent Relative
to Prevention
Need for 4Need for
Prevention Treatrnent
ObsiyPor ie__ Screenirg TetmePnit
Population Onset Dignosis Death of
Increase Diagnosed
Death of Death of
Healthy People ndiagnosed
Figure 2-2 Diabetes Prevention Versus Treatment System Dynamics Model (18)
The need for urgent treatment resources is typically more visible than long-term effects of lack of prevention, resulting in more resources towards the treatment. Also, insurance incentives have historically been arranged to pay for treatment but not necessarily preventative measures.
Ornish details the dynamics in Newsweek, "[In 2007,] 95 cents of every medical-care
dollar went to treat disease after it had already occurred. At least 75 percent of these costs were spent on treating chronic diseases such as heart disease and diabetes that are preventable or
even reversible. [...] For example, insurance companies pay more than $30, 000 to amputate a
diabetic foot even though most amputations are preventable by scrupulous foot care, which is usually not covered by insurance. "(19)
More recently, some corporations have redeveloped health care plans to pay 100% of preventative care and shown results of lower overall costs (19). Vaccines are an important preventative medicine and the impact of shift towards preventative measures will impact demand
and capacity requirements in manufacturing.
2.2. Vaccine Industry
2.2.1. Purpose of Vaccines
Vaccines are an immunization that contains weakened or dead organisms that create immunity in the body against diseases without introducing the disease. The utilization of vaccines has eradicated smallpox and near-eliminated polio and prevented significant quantities of death and suffering across the world (20).
2.2.2. Types of Vaccines
There are four main types of vaccines, categorized as 'live attenuated', 'killed', 'purified subunit', and 'recombinant subunit' (21). Vaccines can be described with the number of valencies, such as monovalent, bivalent, and trivalent. Some vaccines are made with egg-derived manufacturing processes and others use cell-culture technology with mammalian, yeast, or other cell lines (21). Vaccines can be produced with an adjuvant, which requires less antigen per dose by increasing the immune system's reaction to the vaccine (1). Use of an adjuvant is not allowed by all regulatory agencies for regular use, but is maintained as a feasible option during a pandemic to quickly increase available supply.
2.2.3. Regulatory Dynamics
Regulatory agencies place increased emphasis and inspections on vaccine manufacturing facilities because products are used by healthy patients and a large percentage of the population, compared to treatment-related pharmaceutical products that are used by illness-inflicted patients. As Chiron itself learned in 2004, a failed regulatory inspection can have significant damaging
effects on reputation and financial valuation (22). Regulatory concerns for Chiron allowed for an opportunity for acquisition by Novartis (23).
2.2.4. Anti-Vaccine Movement
Since the inception of vaccines, there has been opposition to the use of vaccines (24). The most recent anti-vaccine movement began in 1998 when Dr. Andrew Wakefield wrote an article linking the MMR vaccine to autism (25). Since, the article has been retracted and discredited, while US cases of measles increased by seven times beyond historical levels (26). Described by Hofstadter in 1964, the movement of a minority towards anti-intellectualism can have lasting effects for decades (27). The anti-vaccine movement has decreased demand,
increased variability, and impacted manufacturing capacity management.
2.2.5. Demand with Epidemics
Vaccines can be used for prevention in advance or as an immediate precaution in an area of an epidemic, such as an outbreak of meningitis. This is similar to the dynamics shown in Figure 2-2; in this instance, a given product can be used either for prevention or immediate reaction to a threat which impacts demand. The Department of Health and Human Services, as other regulatory agencies, has developed a process for authorizing emergency use of vaccines during an epidemic; this includes using an unapproved product or a product not approved for a given use (28).
2.2.6. Herd Immunity
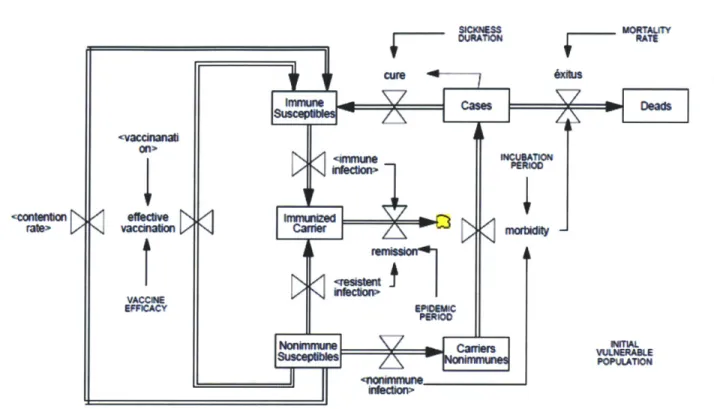
The effectiveness of vaccines in the protection of the general public population is proportional to the percentage of people who are vaccinated. As shown in a system dynamics diagram in Figure 2-3, the flow of disease is affected by the carriers and population of
- ADON ra*> vacirnawmcareranb VACCOE EFFICACY EPEMC Nonilmune Carrier 7t ! IPOPATIO <nonun
Figure 2-3 Infection Flow as System Dynamics Model (29)
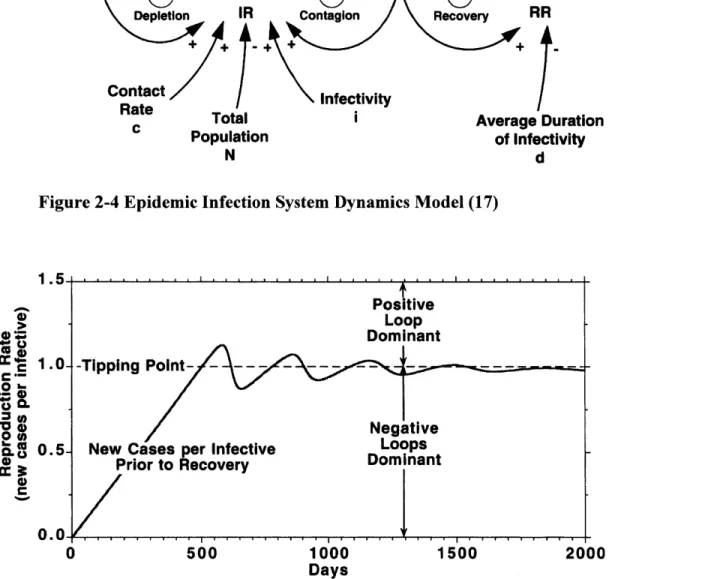
As shown by Sterman, the level of the susceptible population dictates the likelihood of an outbreak (17). Sufficiently immunizing the population to above the herd immunity threshold will significantly reduce the number of future cases of the disease (24). In Figure 2-5, the response graph shows how the dynamic between the positive and negative loop reinforcing structure fight at the tipping point towards epidemic versus controlled outbreak.
... --- -- - - - - - - - - - -- - - - -- -- -: - T
UOarAUW
RAEE
People remain infectious (and sick) for a limited time, then recover and develop immunity.
Contact Rate
c
/
\ InfectivityTotal Average Duration
Population of Infectivity
N
Figure 2-4 Epidemic Infection System Dynamics Model (17)
0 C 00 C 0 500 1000 1500 Days d 2000
Figure 2-5 Tipping Point Loop Dominance Structure of an Epidemic Infection (17)
After a longer duration, the herd immunity may decrease as members discount the need for vaccination (due to lack of prevalence of disease or anti-vaccination concerns) and the incidence of infection can rise, as has occurred with measles in the United Kingdom after 1997
with drop below the threshold (30). The WHO recommends a vaccination rate of 95% to develop herd immunity (30).
2.3. Company - Novartis
The dynamics of the industry has lead to more acquisitions of biotechnology, including the 1996 merger of Ciba Geigy AG and Sandoz AG, to create Novartis AG (12). Novartis is headquartered in Basel, Switzerland with 120,000 employees in approximately 140 countries worldwide as of 2010. Novartis has a mission to "discover, develop, and successfully market innovative products" (31). The business is divided into four divisions, Pharmaceutical,
Consumer Health, Vaccines and Diagnostics, and Sandoz (generic pharmaceuticals). In 2010, the net sales of Novartis totaled over US$50 billion (32), and Novartis ranked most innovative pharmaceutical company by Forbes Magazine in 2011 (33).
2.4. Novartis Vaccines Division 2.4.1. Formation of Division
The Vaccines and Diagnostics division of Novartis was formed in 2006 with the acquisition of Chiron for $5.4 billion (23). The US headquartered division is led from
Cambridge, Massachusetts, with the Technical Operations leadership in Holly Springs, North Carolina. Key sites and personnel are also in Marburg, Germany; Siena and nearby Rosia, Italy; Liverpool, England; and former Chiron headquarters of Emeryville, California. Upon transition, many key leadership of Chiron were replaced, and people were brought to Novartis from other companies to lead the division (23).
The Novartis Vaccines facility in Holly Springs, North Carolina was developed with $486 million investment from the Department of Health and Human Services of the United States government for pandemic response capability (34). Additionally, the 2009-10 H1N1 flu
liquidity allowed for further development of the facility capabilities and strong growth of the division, including growth and development of the Rosia location.
2.4.1. Key Products
Novartis Vaccines and Diagnostics division focuses on providing more than 20 vaccines to fight disease and creating diagnostic instruments and testing equipment (31). Vaccine products include five types of meningococcal types, influenza, rabies, and encephalitis. A pipeline of new vaccine products are in development, including streptococcus, HIV, and respiratory syncytial virus, and more types or line extensions for meningococcal and influenza
(35). Both meningococcus and haemophilus influenza B are a purified subunit type of vaccine
made from polysaccharides, and Fluvirin is grown in eggs using a live attenuated virus (21). 2.4.1. Meningitis
Novartis Vaccines produce several types of meningococcus products. Menveo is for meningococcal groups A, C, W-135, and Y, approved for use in the US by the FDA in February 2010. Menveo continues to gain regulatory approval worldwide and recommendation for use by agencies, including a committee from the Center for Disease Control (36). Menveo is an
oligosaccharide diphtheria CRM 197 conjugate vaccine; the CRM 197 intermediate is also produced by Novartis.
-eAMENVEW
Figure 2-6 Menveo Logo (35)
Novartis Vaccines also produces Menjugate, for meningococcal group C only.
Meningococcal group B is becoming more prevalent, particularly in Europe and New Zealand. MenB is a much more difficult to develop vaccine, because of only a limited immune system reaction. Currently Novartis Vaccines offers MenB vaccine for New Zealand and is developing more vaccines for increased coverage of the five main serotypes (A, B, C, W-135, and Y) (37). - - ------ --- .... .. . ... ....
2.4.2. Influenza
Fluvirin, haemophilus influenzae type B, and other flu products have been crucial to the livelihood of Novartis Vaccines. The revenue from the 2009 flu pandemic continues to benefit the division.
After identification of a flu strain, it takes five to six months to produce supplies of approved vaccine (38). Rosia Bacterial Operations do not make any seasonal flu products, but the production of seasonal flu vaccines impact the processing because of shared resources for
secondary production and supply chain.
2.5. Siena/Rosia Site and Dynamics
The Italian representation of Novartis Vaccines and Diagnostics is centered in Siena, Italy, and Rosia, a small town about a half-hour drive from Siena in the Tuscan region. The Sienese presence in vaccine manufacturing was started by Achille Sclavo, an innovator in hygiene and vaccines (39). His presence is still prominent with a street and many buildings named for his work.
The Siena site is strongly focused on research and development and a strong base for administrative resources. In Rosia, the manufacturing-focused site contains many steps in the value chain process, including bulk manufacturing, secondary or parenteral manufacturing, packaging, and distribution.
Upon transition of Novartis leadership, many of the original personnel still remain and some personnel have operated in the same position for many years. In the recent years, plant management has added leadership from NVD headquarters or other international pharmaceutical and biotech manufacturers. Operational changes were made to improve operational efficiencies, such as extending some operating facility hours to 24 hours a day for five, six, or seven days a week. The organization was restructured near the beginning of this research project to be
product-focused rather than aligned with the areas of the plant. This aligns with the principles in
2.5.1. Facility - Bacterial Operations in Rosia, Italy
This research-based thesis project is focused on the Bacterial Operations in Rosia, Italy and relating components throughout the value chain of vaccines. Primary products of the facility include intermediates for Menveo, Menjugate, and Hib vaccines.
3. Project Approach and Methodology
3.1. Overview
This facility, like many, has many opportunities for operational improvement. During several conversations with plant leadership, many opportunities for improvement were identified.
Questions from Facility Leadership for Project Scoping
e How can the facility be used to launch new products? What resources are needed?
Which products are a good fit in the facility and which should be ran in another facility or at a third party?
* What is the maximum facility capacity, and what are the theoretical bottlenecks?
e How should the long-range schedule be designed to optimally campaign products? e Which projects should be prioritized to give most value for capital and personnel
resources?
e How much inventory should be held of intermediate and final products? " What opportunities are available for cycle time reduction?
e What operational improvement ideas can improve facility capacity? 3.2. Project Scope
Following these discussions with management, the project was focused on three areas.
e Model and analyze capacity, evaluate various production scenarios e Determine theoretical bottlenecks and facility constraints
e Review product changeover frequency, inventory placement for long-range
schedule planning
Three techniques were used to answer the questions proposed by management.
e Capacity analysis through process modeling
e System optimization for long-range schedule improvements
e Supply chain calculations for campaign planning and strategic inventory review 38
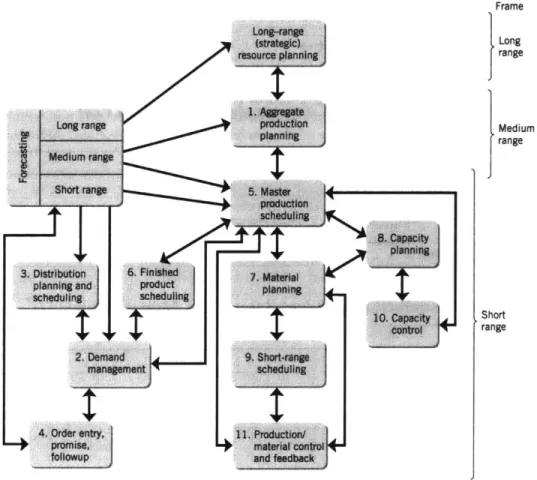
3.3. Impact to Production Decisions System
The project interfaces and has impact to many parts of the decision making chain for manufacturing as shown in Figure 3-1. Strong interfaces with strategic long-range planning are to understand the questions which need to be answered by the capacity modeling for the facility. Demand management is an input to the supply chain calculations to understand the amount of material that is necessary to produce. Operational improvements at the site can be focused on areas with highest level of impact. Material planning analytically reviews safety stock and desired inventory levels to ensure customer service. Master production scheduling and strategy impact the capacity of the facility and utilization strategy, balancing personnel resource
allocation with physical assets.
Time Frame Long
I
range
I
Medium
range Short range3.4. Facility Overview
As described in a release by the FDA, the process for Menveo includes the following production areas, general manufacturing steps, and key equipment and utilities.
Table 3-1 Menveo Production Overview (Adaptedfrom FDA Memorandum) (42) " Antigen Manufacturing
e MenCWY Formulation, Filling, Inspection of vial
e MenA Filling and Lyophilization of vial
e MenA and MenCWY Inspection, Labeling, and Packaging " Warehouse, Storage, and Raw Materials
Table 3-2 Manufacturing Steps of Menveo Antigen (Adaptedfrom FDA
Memorandum) (42)
e CRM197 Manufacturing
* Polysaccharide Manufacturing
e Oligosaccharide-CRM Bulk Manufacturing
Table 3-3 Manufacturing Equipment Components (Adaptedfrom FDA
Memorandum) (42)]
* Tanks * Columns
e Centrifuges
o Autoclave
e Parts and glassware washer
Table 3-4 Utilities in Manufacturing (Adaptedfrom FDA Memorandum) (42)2 o Purified Water (PW)
* Water for Injection (WFI) * Clean Steam (CS)
o HVAC
1 Example data for illustrative purposes 2 Example data for illustrative purposes
3.5. Variable Definitions
The following tables describe the input variables, output calculations, decision variables, and constraints used across the process modeling, system optimization, and supply chain
calculations.
3.5.1. Input Variables
Many parameters and data are available from processing information to utilize in this analysis. Table 3-5 lists input variables considered for this research.
Table 3-5 Input Variables
Variable Title Description Units Example Values
j
Job Bulk products produced, or Text Conjugated MenA intermediates for final productsi Machine List of equipment units or Text Column, tank, autoclave production area
p Product Final product for which Text Menveo, Menjugate,
intermediate is used Hib
a Processing Area of plant; used to meet Text Fermentation,
Area cross contamination constraint Purification
SSop Processing Processing step of the plant, by Numerical SOP 111111
step number SOP number
m Material Material used during Text WFI, CS, PW, column
name production; Raw material, resin
utility, buffer, consumable or other material used during
production step.
Y Binary Binary variable for if the Binary 1 or 0 machine use machine is used for a given job
in a given step
1 if machine is used for job
j
in step s,else 0
xf, Binary Binary variable for if the Binary 1 or 0 processing processing area is used for a
area given job in a given step
1 if processing area is used for job
j in step s,
Variable Title Description Units Example Values
di Due date Date that jobj is to be Time March 23
completed
PV Processing Processing time of jobj on Duration 2.34 hours
time machine i
hchange Sequence- The duration of time to switch Duration 0.3 hours
Jnn+ dependent from jobj, to job jn.1 on changeover machine i
time
If the same job is run sequentially on the same machine, the set up time is
defined as zero
h change 0
Rj, Recipe Recipe for producing one mds Grams/ 5 grams/mds
MenC-of product p requires Rjp grams Million CRM (43)
ofjobj doses
(mds)
Dp Demand Demand for product p (typically Million 10 mds
annual) doses
(mds)
9 Grams per Bulk grams of jobj produced, at Grams/ 4 g/batch of MenC-batch antigen production outlet batch CRM3
Gj Grams in Total bulk grams ofjobj Grams 10 g inventory GjO = grams of initial
inventory of job
J
G tgt Target Total target bulk grams of jobj Grams 20 g of MenC-CRM grams in
inventory
Yjs or Yij Yield Yield of job j in step s or % 95% machine i
Um J Utilization of material Utilization of material m in Units of 5 liters of Raw Material
machine i for jobj
material
Wa Workforce Workforce authorized for Dimensio 8 processing area a nless
quantity
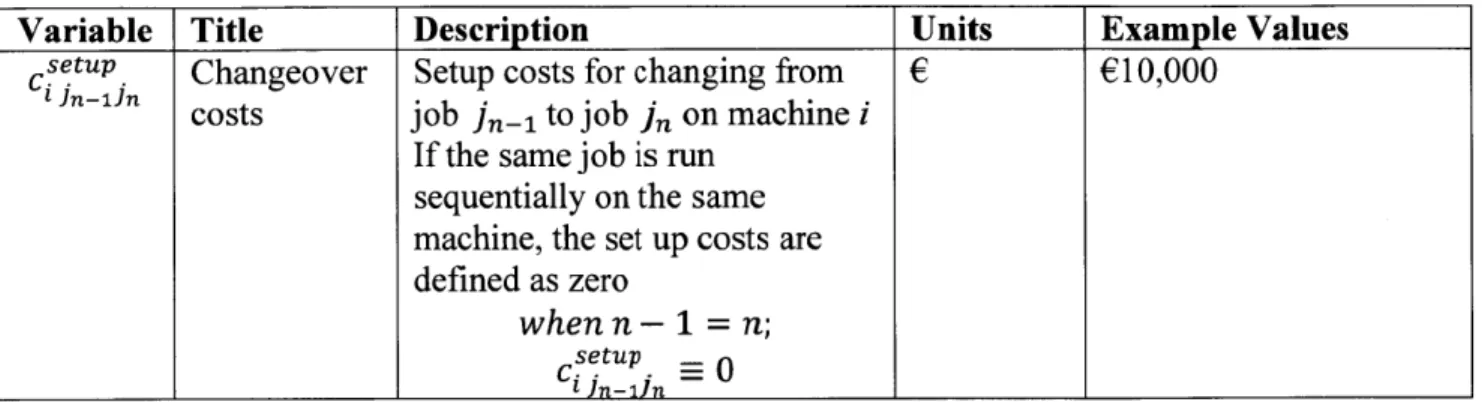
Variable Title Description Units Example Values
C sn-un Changeover Setup costs for changing from E £10,000 ncosts job in-1 to job
in
on machine iIf the same job is run sequentially on the same machine, the set up costs are defined as zero
when n - 1 = n;
Csetup 0
i n-1/n
3.5.2. Output Calculations
Output calculations are values dependent on input parameters and optimization function. Table 3-6 Output Parameters
Variable Title Description Units Equation
Gj Grams Bulk grams of job j Grams Gj = gj x L; + G;
produced available (produced or in V(j)
inventory)
C; Completion Completion time of jobj on Time Cij = Yij + Pi; +
time machine i tcthange + thcean
iJn-1ini
V (i,j)
Cmax Makespan, Defined as the duration of Duration Cmax = max(C;)
Maximum time until the last job leaves
VU)
completion the system
time
3.5.3. Decision Variables
The decision variables are the parameters which are variable and are determined by calculation of optimal values.
Table 3-7 Decision Variables
Variable Title Description Units
Li Lots Lots or batches produced of jobj Dimensionless
3.5.4. Process Constraints
The process constraint equations represent the physical constraints mathematically for data analysis. The constraints in the pharmaceutical industry are different than many other industries, due to high regulation from worldwide agencies and cross-product contamination.
Table 3-8 Process Constraints
Equations Description
Yin+j yin; + Pini The starting time of the next machine for a given job,
yi,,j, must be later than the sum of the
V(in,j) e starting time of the previous machine for a given
job,
Yinj* processing duration of the previous machine for the given job, Pin
e time to change equipment between jobs, tchange
tiinin+1
* time to clean between jobs, tqean
yijn+l y + Piin The starting time of the next job for a given machine,
yig, , must be later than the starting time of the previous
V(i,jn) job for a given machine, yij, , plus the processing
duration of the previous job on the given machine, Pi, .
Cmax Pi1 + Yij V(i,j) The duration of time to complete all jobs, Cmax, must be
greater than or equal to the time to complete all jobs. Does not include cleaning and changeover after final job. Cleaning and changeover are not included because they are before the start of the step.
Gj D, x R, V
j,
p) The total number of grams available of jobj must be greater than or equal of the amount of grams needed to fulfill demand D,.For all production areas a, the sum of the number of jobs
V(a, y), x 1
j
in a given production area a at any given productionY= -Jtime, y, must be less than or equal to one to prevent cross contamination.
J For all machines i, the sum of the number of jobs j active
V(i,y), x 1 at any given production time, y, must be less than or
_=0 equal to one.
L; 0 V(j) Non-negativity of number of lots produced
y 0 V(ij) Non-negativity of starting time
4. Capacity Modeling and Simulation 4.1. Capacity Analysis and Theory
Capacity analysis in biopharmaceutical manufacturing has historically been focused on single-product facilities. With the development of more specialized products and fewer blockbusters, the industry has trended to more multi-product facilities for active ingredient production.
With demand and approval uncertainties and a long lead time to build and qualify a new facility, capacity decisions are difficult in the pharmaceutical industry. The high margins in pharmaceutical industry, which apply to most non-commodity products, establish that the financially best option is to have enough capacity to meet virtually all demand, as shown in Equation 4-1.
Equation 4-1 Cost of Exceeding or Under Producing Demand (44)
Cu
area under demand curve = (C +
(CO + CU)
Cu Cost of Underage of Production Units
Co Opportunity Cost of Overage
In the pharmaceutical industry, the cost of underage, or shorting the market, often involves additional negative effects other than the loss of a sale. For specialized products, market backlash can include loss of reputation for other products, reduced confidence in future ability to deliver, and accelerated regulatory approval of competitor products. Third-party manufacturing options allow for delaying or hedging of capacity decisions with uncertain
demand, and can aggregate capacity across the industry and lower overall risk (45) (44). For additional review of capacity theories, refer to Sterman, Business Dynamics (17); Beckman and Rosenfield, Operations Strategy (44); Silva, Capacity Management: Get the level
4.2. Defining Capacity
For this project, capacity is defined as physical capacity limited by the fixed equipment in the facility. Disposable or readily available commodities (e.g., lab glassware, storage containers, disposable bioreactor and liquid storage bags) are assumed to be readily available and non-constraining to the capacity.
In contrast, a facility capacity can also be defined by a limited headcount to operate, support, and manage the given equipment resources. Similarly, the model will exclude personnel constraints but consider level scheduling benefits when considering non-capacity constrained situations.
4.3. Approach
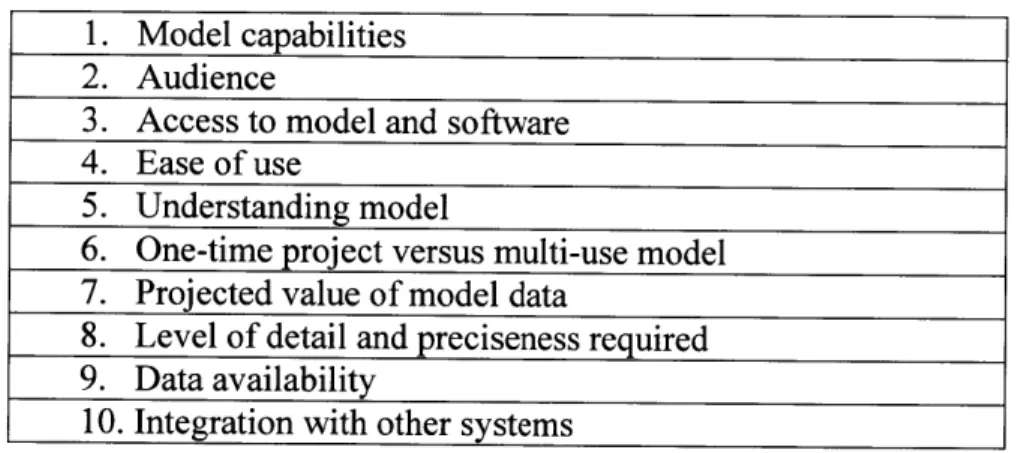
Several facility capacity models had been previously made, but were no longer in use. For this project, an essential part before commencement of the modeling project, was evaluating the key shortcomings of previous models and understanding how to develop a model that will be effectively used to provide value for several years of production.
Table 4-1 Model Development Decision Factors 1. Model capabilities
2. Audience
3. Access to model and software 4. Ease of use
5. Understanding model
6. One-time project versus multi-use model 7. Projected value of model data
8. Level of detail and preciseness required 9. Data availability
4.3.1. Model Capabilities
Interviews with stakeholders across plant management, technical planners, and manufacturing strategy are used to understand categorization of essential, valuable, and non-essential information for model.
4.3.2. Audience
A model is designed differently for different audiences. For example, a model built for a few technical users only on a yearly basis is designed differently from a model for use by operations personnel for weekly use.
4.3.3. Access to Model and Software
The audience dictates also the level of access needed for the model. Specialized modeling software often has restricted licensing for only a limited number of workstations. A model that is needed for use by many will be more easily accessed with a commonly used tool such as a web-based application or software that is licensed by all computers on-site (e.g. Microsoft Excel).
However, off-the-shelf software has many advantages. Software packages are available that specialize in many areas and after initial training, software tools have templates, reports, and graphs that make development and use more rapid.
4.3.4. Ease of Use
Ease of use of the model is important particularly if the model will be used by a large audience on a regular basis. A user interface is important to quickly display key parameters and visually show metrics. However, simplicity and ease of use is often in contrast to model
capabilities and the ability to update model. For models that will be only designed by one or two people with low risk of personnel change, models requiring many days of specialized training