Characterizing Fault Structure and General Morphology of the
Tensleep Sandstone of Teapot Dome, Wyoming as it relates to
Industrial Carbon Sequestration
by
Melanie J. Michalak
Submitted to the Department of Earth, Atmospheric and Planetary Sciences
in Partial Fulfillment of the Requirements for the Degree of Bachelor of
Science in Earth, Atmospheric and Planetary Sciences at the Massachusetts
Institute of Technology
May 26, 2006
Copyright 2006 Melanie J. Michalak. All rights reserved.
The author hereby grants to M.I.T. permission to reproduce and distribute
publicly paper and electronic copies of this thesis and to grant others the
right to do so.
Author_
Certified b
Signature redacted____
Department of Earth, Atmospheric and Planetary Sciences
May 26, 2006
signature
redacted
Signature redacted
Thesis Supervisor
David Mohrig
Accepted by_
,1 MASSACHUSETTS INSTITUTE OF TECHNOLOGYSEP 2 8
2017
LIBRARIES
Samuel Bowring
Chair, Committee on Undergraduate Program
CO The author hereby grants to MiT pernission to WU reproduce and to distfibute publicly paper and electronic copies of this thesis document inwbole or in part in any medium now known or
- hereafter created.
<c
77 Massachusetts Avenue
Cambridge, MA 02139 http://Iibraries.mit.edu/ask
DISCLAIMER NOTICE
Due to the condition of the original material, there are unavoidable flaws in this reproduction. We have made every effort possible to provide you with the best copy available.
Thank you.
The images contained in this document are of the best quality available.
Characterizing Fault Structure and General Morphology of the
Tensleep Sandstone of Teapot Dome, Wyoming as it relates to
Industrial Carbon Sequestration
by
Melanie J. Michalak
Submitted to the Department of Earth, Atmospheric and Planetary Sciences
May 26, 2006
In Partial Fulfillment of the Requirements for the Degree of Bachelor of Science in Earth, Atmospheric and Planetary Sciences
ABSTRACT
Consistent data demonstrates a rise in global atmospheric concentrations of carbon, in the form of carbon dioxide. A large portion of the current atmospheric concentration is due to emissions from the burning of fossil fuels, which humans use for energy consumption. Many experts believe that of all the mechanisms in which carbon dioxide emissions can be mitigated, sequestering carbon dioxide, specifically in geologic reservoirs, is among the most promising of all approaches. This paper examines a fault structure in the
specific geologic reservoir known as NPR-3, or the Teapot Dome oilfield. Using seismic modeling and subsurface modeling software packages to interpret seismic data of the region, geologic features and faults are mapped. These maps provide valuable characterization information useful to an overall evaluation of the effectiveness of geological storage of carbon sequestration in the Teapot Dome site.
Thesis Supervisor: David Mohrig Title: Assistant Professor of Geology
INTRODUCTION
Atmospheric Carbon Dioxide and its Implications
Although it has only been about 200 years since the advent of the "Industrial Revolution," the effects of industrial growth around the globe are contributing to marked
changes in the climate record. The measured increase of global mean surface
temperature across the last few centuries is widely accepted by the scientific community to be a result of human-generated emissions, primarily of carbon dioxide. Carbon dioxide belongs to a group of gases termed green house gases (GHG's) because they allow solar radiation to pass through the atmosphere, but prevent surface radiation from the Earth from escaping the atmospheric cloud cover (Feigon et al., 2003).
It is a well-accepted fact of scientific origin that atmospheric carbon dioxide concentrations have steadily increased to an amount of 370ppm, which is a significant increase from the pre-industrial level of 280ppm. The nature of this increase has been disputed throughout the last few decades. Currently, there is a general consensus that the increase in atmospheric carbon dioxide concentration is due to human activity (Feigon et
al., 2003). Globally, 20 billion tons of carbon dioxide are being emitted into the
atmosphere annually. These emissions are the consequence of burning coal, oil and natural gas for fuel, fuel that many parts of the world is dependent on for electricity, heat and transportation. The major political, economic and scientific clash is centered around this use of fossil fuels for energy. The benefit of fossil fuels are that they are relatively cheap to extract and process and it has been projected the amount of fossil fuels that exist today is enough to meet global energy demands for at least a century or two (Benson, 2004). Alternative methods of generating energy, such as solar power, wind energy, biomass and switching to fuel sources of lower or negligible carbon dioxide emissions are not very attractive to most sectors of society for a variety of reasons, the expense being the major drawback. An interesting approach that warrants investigation and is the idea of redirecting carbon dioxide from its industrial sources elsewhere. A variety of terrestrial, extraterrestrial and deep marine reservoirs have been proposed, but this paper focuses on geologic reservoirs, discussing the Teapot Dome oilfield in particular, which is among the most promising sites for immediate implementation.
Mitigating Carbon Dioxide Emissions: Geologic Reservoirs
The first step in the carbon capture and storage process is to determine where the carbon dioxide is most suitable to be captured from. Secondly, the carbon dioxide must be physically trapped and directed toward a reservoir. The various proposed methods to capture and transport carbon dioxide would require a large sum of investment capital and additional energy, that would in turn produce more carbon dioxide emissions. However, according to many reports, the additional carbon dioxide emissions would be offset by the amount of carbon dioxide able to be captured and stored (Benson, 2004).
Once the carbon dioxide is captured, it must be transported to the reservoir in which it ultimately will be stored. Pipelines are a widespread and mature technology in other types of fluid and/or gas transport and practical for distances up to several hundred kilometers. Intermediate compressors to drive the flow and leak monitoring systems may have to be installed in order to successfully and safely transport CO2(Benson, 2004).
The obvious next question that arises involves where carbon dioxide should be sequestered and stored. The two most popular and promising types of geologic reservoirs are depleted oil and gas reservoirs and brine-filled permeable formations (Oldenburg et al., 2003). Oil and gas reservoirs have been used for enhanced oil recovery projects and it has been demonstrated that they can store CO2 for long time scales. Because they have
been used for enhanced oil recovery projects, injection technologies have been well established (Benson, 2004). There is roughly IGtC of storage capacity in currently abandoned oil and gas fields estimates have been made that up to a 30 GtC capacity exists and will eventually be available (Anderson and Newell, 2004).
The other type of potential geologic reservoir is a brine-filled sedimentary basin, which typically consists of alternating layers of permeable sandstone and fine-textured, impermeable sediments like clay or shale. Many saltwater sandstone formations are expected to have a much greater storage capacity than depleted oil and gas fields
(Benson, 2004). In 1994, the IEA Greenhouse Gas R&D Programme estimated that salt-water filled formations could store from 300-10,000 Gt of C02. Such a large range of estimation warrants obvious future research in characterizing suitable geologic storage formations.
PREVIOUS WORK
Geologic Reservoirs: Looking closely at Teapot Dome, Wyoming
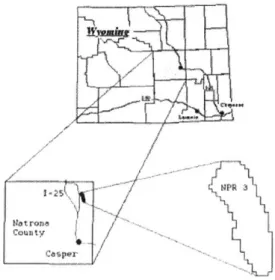
Sedimentary permeable formations could potentially be the future of carbon sequestration by direct injection. One of the most important sites to this type of research today is known as the Teapot Dome oilfield, or NPR-3. Teapot Dome is located in the Northeastern corner of the Natrona County of Wyoming.
f.25~"PR 3
County
Casper
Fig. 1 Location of NPR-3 Oifield in Wyoming. (Courtesy of RMOTC and Vicki Stamp)
This region has a long history of both oil drilling and enhanced oil recovery and is the only government owned and operated oil field in the United States. The field covers roughly 10,000 acres and contains 1200 accessible wells, 300 of which penetrate 2700 ft or deeper. The field itself includes roads, pipelines, water lines and treatment plants, a gas processing facility, buildings, and telephone lines. Geologically, the region has been historically marked by fluctuating marine and lacustrine landscapes, which have
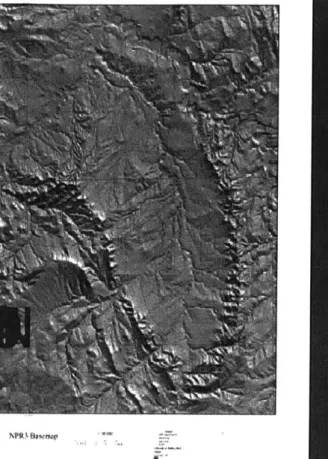
deposited alternating porous units and impermeable rocks (Friedmann, 2005). The general topography of the NPR-3 region is shown in Figure 2.
Figure 2. Teapot Dome topography
(Courtesy of RMOTC and Stamp) Figure 3. Geologic Column (Courtesy of RMOTC and Stamp)
In Figure 3 the stratigraphy is shown to follow a pattern of alternating porous beds of sandstone and more impermeable beds such as shale. The Pennsylvanian Tensleep sandstone formation and the overlying Goose Egg Shale formation have been targeted as the most effective storage for CO2 injection, due to the Tensleep's depth, lateral extent
and history of oil production and the Goose Egg's cap rock properties. The Tensleep is a thick, continuous layer of Aeolian sandstone with high porosity and permeability. The average porosity is 8%, although this varies due to local cementation properties
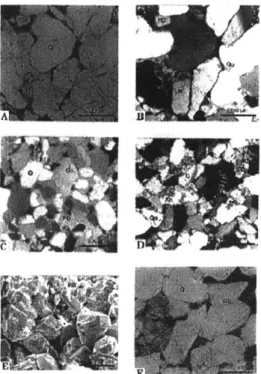
(Friedmann, 2005). The types of cementation matrices formed in the Tensleep shown below are dolomite, calcite, anhydrite and quartz. Dissolution of cements during diagensis has greatly increased the porosities of the sandstone (Zhang et al., 2005).
Figure 4. Tensleep cementation types (Courtesy of Zhang et. al)
The Tensleep Sandstone is comprised of three units, A, B, and C, which together are roughly 300 ft. thick. They are separated by units corresponding to marine regressions; sabkha carbonates, anhydrite and low permeability dolomicrites. The thickest of the sandstone units is the B sand, which is over 100 ft thick, continuous and porous. The overlying cap rock is the Permian Phosphoria Formation, known as the Goose Egg Shale. This formation is characterized by deposits of shale, carbonate and anhydrite and at over
300 ft thick, serves as the primary seal that permits large accumulations of hydrocarbons.
At Teapot Dome, this reservoir-seal system trapped 35 million barrels (5.6 million m3) of
oil and gas (Friedmann, 2005).
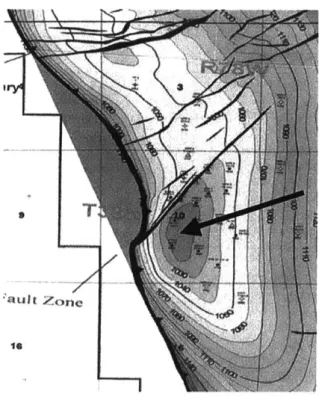
The site of most interest in terms of immediate injection is section 10 of the Teapot Dome field, which is penetrated by 14 wells. Section 10 has a structural crest at a depth of 5500 ft. The closure dips away from the crest to the South, and covers an area of about 1 km2. The proposed injection site is shown below.
'ault Zone
Figure 5. Section 10, proposed CO2 injection site. (Courtesy of RMOTC and Stamp)
It is of immediate importance that this 1 km2 region be characterized as thoroughly as possible before injection. There is a major fault network in this region, which needs to be mapped in great detail before any type of modeling flow system is to be useful. The focus of this paper was twofold; to use seismic data and computer software tools to create both a structural model of the Tensleep bed and to characterize and model the main fault in the Section 10 region.
METHODS
The Rocky Mountain Oilfield Testing Center, located in Casper, Wyoming, is an organization within the United States Department of Energy. In conjunction with private companies, universities and national laboratories, it is actively working to characterize, model and test Teapot Dome's effectiveness as a CO2 reservoir. A type of data collection
they have used is basic seismic data, which was given for use on this project. Thirty Hertz seismic data was taken over the entire Teapot Dome area. Using a seismic
modeling package this data was uploaded into the grid shown below, where all horizontal and vertical grid spacing is 111 ft.
sme6m
788O 7(% Q2p$ $ $ $0
20
----wit abirar cos lnesinblck
120
so
seso48009
s~en3800? -4- 50
86 10
Figure 6. Aerial view of Teapot Dome within gridding with arbitrary cross lines in black.
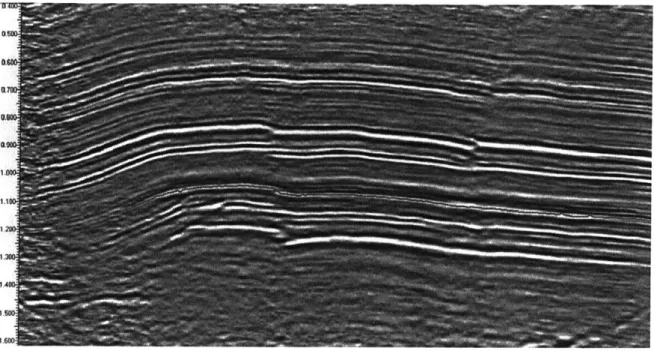
The capacity of this program includes creating vertical slices in any orientation. In order to find the Tensleep, an arbitrary line along one of the vertical grid lines was chosen to get a vertical seismic slice, shown below. The seismic data is given in units of time (milliseconds), so in order to accurately determine where the Tensleep was the time-depth conversion factor given by RMOTC was used.
0.50
Figure 7. Seismic slice with Tensleep in blue
Using a combination of manual picks and autopicking between gridpoints along the Tensleep horizon, a horizontal surface was mapped in attempts to show structural beds, dips, fault networks, Aeolian dunes, etc. Horizontal structural maps are indicated in both time and amplitude in the RESULTS section.
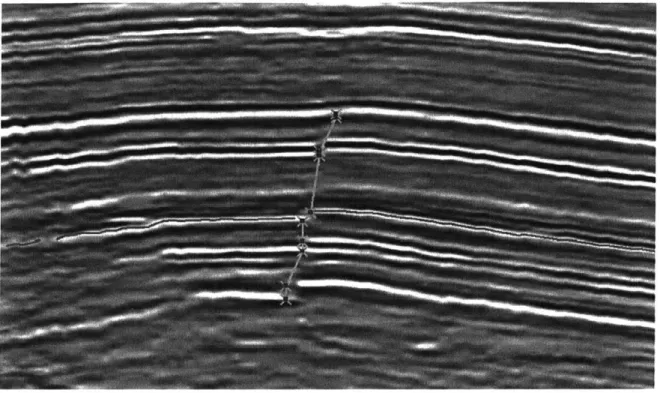
The second method employed was to characterize the major fault that borders the region to the Northeast. The goal was to determine how the fault behaved over
deposition, and whether or not it was a growth fault. Using cross-sections oriented perpendicular to the fault, the fault's displacement was apparent in the vertical slice. The displacement of the fault in five different beds was marked, at 32 intervals down the horizontal extent of the fault. In the seismic slice below, the green X's represent where the bed occurs on one side of the fault and where it occurs on the other. The fault is not entirely vertical, but the displacements were calculated as if they were.
Figure 8. Mapping the fault displacement over 5 beds.
As mentioned previously, the seismic depths are in units of time, which meant that the displacement values were also in time. The five displacement values, over 32 sections along the fault, were assigned coordinates in 3D, as X, Y and T. For each point, the X and Y values were averaged so that the displacement value was given a spatial location in the center of the actual displacement region. These points were then uploaded into a 3-dimensional subsurface modeling package and the relative displacement along the fault was imaged in 3-D, along with the shape of the Tensleep surface. How the fault behaved and what the topography was around it was modeled and available for observational analysis.
RESULTS
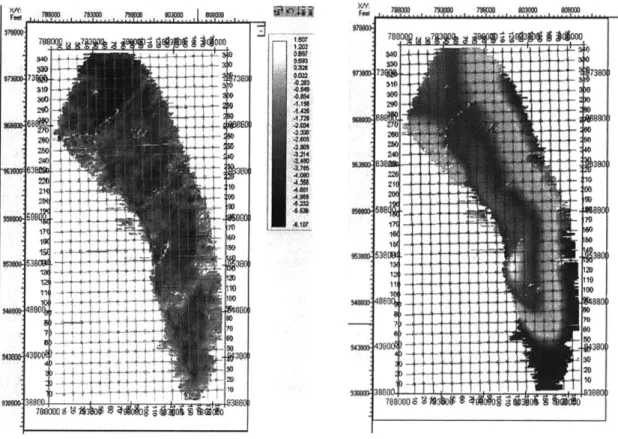
After mapping the horizontal surface of the Tensleep, it is displayed here in both a. Amplitude and b. Time.
W NO .,.?! . ... 00 9 0 30D 29D wa OWN.-2" 240 2 io, go 70 5D 12D 110 100 70 50 so 7MW ig IS A 41W .2.= 4M 4M3 -3214 A' 000 4AW 4222 410 9xia" 7 ~ ~ -a-... AM IIA.... 7 740 290 20 78900.3 a039 a M0qu5MI g5 7390 10 CO 30
Figure 9.a. Tensleep surface in amplitude Figure 9.b. Tensleep surface in time, yellow represents most relief, blue represents least.
Figure 9a. shows a repeating Northeast structural pattern, along with the many faults oriented along this fabric as well. Figure 9b demonstrates the general morphology of the Tensleep; the structural crest in yellow is Section 10, the proposed pilot injection site.
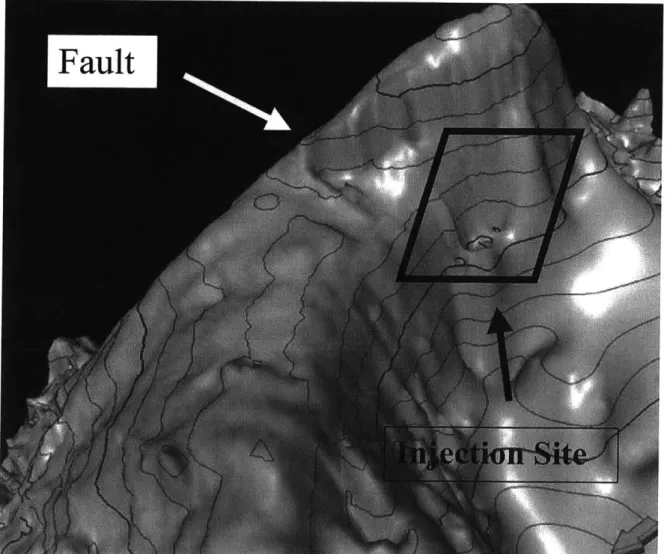
The 3D fault characterization shows a useful visual interpretation of the relative fault displacements. In these images below, it is seen that the fault displaces the most material below the Tensleep in the Southwestern-most corner, and decreases moving up the fault and Northeast. Furthermore, it is obvious that the fault is not vertical in Figure
11, and dipping away from the structural crest.
1
r rr
MIZ" 9 was so in was on man U oll@ '10 alot-listogram Cokwt An ln"' Mam Get Max from 10 data d~rete Get Min from data Mn.
Figure 10. Aerial view of Tensleep topography and fault, with least displacement (purple) to most displacement (yellow).
Figure 11. View from the Southwest, along the plane of the fault.
I I -OW"
*0
The vertical exaggeration of the images above was lOx. When extending this
exaggeration to 50x, the fault can be seen relative to the topography more dramatically. The injection site, as mentioned previously, is South of the fault.
Figure 12. Vertically exaggerated view from the South.
Using seismic data and the seismic and subsurface modeling software packages, these results show the complexity and structural heterogeneity of Section 10 of Teapot Dome, and in particular, the large oblique fault that borders the region to the North. Creating these maps opens up many points of discussion and opportunities for further
characterization and analysis.
DISCUSSION
The Tensleep is primarily Aeolian sandstone, in which it would be expected to see large dunes and varying terrain. In creating the horizontal surface of the Tensleep, it may have been possible to see local structures such as landslides, dunes and other types of perturbations. Although there was a pattern of fabric along the region, shown in Figure
l0b, it was difficult to determine any individual structures. This was probably due to the lack of resolution that the 30 Hz frequency seismic data provided. The faults however were clearly defined, and given further attention. Knowing what types of faults are in the region is important to carbon sequestration. As CO2 is injected into these formations, it will travel along the bed laterally and vertically. Any type of change in the bed will affect the path of the CO2. In looking at the displacement values, it was obvious that with deposition, the effects of this fault were dampened, ruling out the possibility that it was a growth fault. It appears as though it is an old fault, affecting layers below the Tensleep up to displacement values of roughly 100-120 feet. At the Tensleep surface, the fault disrupts the bed from a range of about 20-50 ft, from East to West. At over 300 ft thick, the Tensleep bed is not discontinued in entirety by this major fault. If CO2 were to be
injected in Section 10 it could move vertically up through this fault. Nonetheless, if the overlying cap rock is as thick and impermeable as estimated, CO2movement would be
slowed considerably.
CONCLUSION
Using the seismic and 3D subsurface modeling tools to interpret and show seismic data provided to be useful for characterization and observation. However, the extent of this modeling analysis would need to be greatly expanded in order to accurately model an
entire region subject to CO2injection. Furthermore, higher frequency seismic data should
be used for these characterizations. 30 Hz frequency data only provides a resolution of
20-25 meters, and some structures are bound to be neglected with such a poor resolution.
depending on autopick, the data can be smoothed in an inaccurate manner. For example, the vertical and horizontal cross sections of the area were of much better quality than those of the diagonal orientation. This was due to the fact that every single vertical and horizontal line had been picked manually, whereas the diagonal slices were merged by autopicks. Smaller grid intervals would improve this merging problem. In addition to creating horizontal sections of beds within Teapot Dome, the entire fault network needs to be characterized and mapped in order for CO2injection simulations to predict flow
accurately. The heterogeneity, complexity, depth and inaccessibility of the Tensleep makes this difficult, but with the tools demonstrated in this analysis, can be done effectively. In addition to fault and local structures, porosity and permeability
coefficients and fracture geometry and frequency would need to be factored into a model that could be used for a large scale CO2 flow simulation.
If a large scale CO2 flow simulation is to be run successfully through a thoroughly mapped geological formation system like the Tensleep/Goose Egg, this may call for pilot injections in the region. The time-scale of this process is dependent on how well and how rapidly the region can be characterized, with enough scientific confidence that the simulations are accurate. If the goal of industrial carbon sequestration in geologic reservoirs is to mitigate enough carbon dioxide emissions to make a significant decrease in the amount that is emitted annually in the atmosphere, CO2 injections would have to
happen very soon and on a large scale. As of now, the characterizations that have been done of geologic reservoirs are not complete enough to entice that level of confidence.
ACKNOWLEDGEMENTS
The ideas, time and explanations provided by Professor David Mohrig and Kyle Straub are greatly appreciated. Additional thanks to Brian Black and the Rocky Mountain Oilfield Testing Center for providing data, to Jane Connor for writing supervision, and to Professor Kip Hodges for general guidance.
REFERENCES
1. Anderson, Soren and Newell, Richard. (2004), Prospects for Carbon Capture and
Storage Technologies, Annual Review of Environment and Resources, 29, 109-142
2. Benson, Sally M. (2004), Carbon Dioxide Capture and Storage in Underground Geologic Formations, from workshop proceedings, "The 10-50 Solution."
3. Feigon, Sharon et. al. (2003), TCRP Report 93: Travel Matters: Mitigating
Climate Change with Sustainable Surface Transportation. Transportation Research Board.
4. Friedmann, S.J. and Stamp, Vicki. in press, Teapot Dome: Site Characterization of a C02-Enhanced Oil Recovery Site in Eastern Wyoming.
5. Stamp, Vicki. (2005), The Teapot Dome Field Experimental Facility:
Characterization Experience with a Century-Old Oil Field, a Power Point Presentation for The SPE Applied Technology Workshop: CO2 Sequestration, Galveston, Texas.
6. Zhang, Quingsheng et. al. (2005), Sequence stratigraphy and reservoir
characterization of the Tensleep Formation in Teapot Dome and central Wyoming, Power Point Presentation received via Julio Friedmann, personal communication.