Publisher’s version / Version de l'éditeur:
Vous avez des questions? Nous pouvons vous aider. Pour communiquer directement avec un auteur, consultez la première page de la revue dans laquelle son article a été publié afin de trouver ses coordonnées. Si vous n’arrivez pas à les repérer, communiquez avec nous à [email protected].
Questions? Contact the NRC Publications Archive team at
[email protected]. If you wish to email the authors directly, please see the first page of the publication for their contact information.
https://publications-cnrc.canada.ca/fra/droits
L’accès à ce site Web et l’utilisation de son contenu sont assujettis aux conditions présentées dans le site LISEZ CES CONDITIONS ATTENTIVEMENT AVANT D’UTILISER CE SITE WEB.
Paper (National Research Council of Canada. Institute for Research in
Construction), 1990-06
READ THESE TERMS AND CONDITIONS CAREFULLY BEFORE USING THIS WEBSITE. https://nrc-publications.canada.ca/eng/copyright
NRC Publications Archive Record / Notice des Archives des publications du CNRC : https://nrc-publications.canada.ca/eng/view/object/?id=6ccd0a38-16aa-4e7d-9ec2-50b8fcafabeb https://publications-cnrc.canada.ca/fra/voir/objet/?id=6ccd0a38-16aa-4e7d-9ec2-50b8fcafabeb
NRC Publications Archive
Archives des publications du CNRC
This publication could be one of several versions: author’s original, accepted manuscript or the publisher’s version. / La version de cette publication peut être l’une des suivantes : la version prépublication de l’auteur, la version acceptée du manuscrit ou la version de l’éditeur.
For the publisher’s version, please access the DOI link below./ Pour consulter la version de l’éditeur, utilisez le lien DOI ci-dessous.
https://doi.org/10.4224/40001226
Access and use of this website and the material on it are subject to the Terms and Conditions set forth at
An energy approach for assessing seismic liquefaction potential
Law, K. T.; Cao, Y. L.; He, G. N.
Ser
National Research Conseil nationalTH1
1
*I
Council Canada de recherches CanadaN21d
no.
1657
c o 2Ieprinted from
BLDG,
Canadian
Geotechnical
Journal
Reimpression de la
canadienne
de
geotechnique
An
energy approach for assessing seismic liquefaction
potential
Volume 27 Number 3 1990
ANALYZED
Pages 320-329
NRCC 31593
(IRC Paper 1657)
-
An energy approach for assessing seismic liquefaction potential
K. T. LAW AND Y. L. CAO
Geotechnical Section, Institute for Research in Construction, National Research Council of Canada, Ottawa, Ont., Canada KIA OR6
AND
G . N . H E
Department of Civil Engineering, Dalian University of Technology, Dalian, China
Received May 26, 1989 Accepted January 15, 1990
An energy method for assessing liquefaction potential of granular soils was developed based on laboratory tests and observational data obtained in past major earthquakes. Cyclic triaxial and cyclic simple shear tests were conducted and the results show that a unique relation exists between the dissipated energy during cyclic load and the excess pore pressure that eventually led to liquefaction failure. This unique relation has been combined with an energy attenuation equation to develop a criterion for defining the liquefaction potential of a site. Parameters for the criterion were evaluated from 136 sites involved in 13 major earthquakes over the world. A comparison was made between the energy method and the commonly used stress method. The energy method was found to be simpler to apply and more reliable.
Key words: energy, earthquake, liquefaction potential, standard penetration test, laboratory cyclic test, excess pore granular soils, case records.
Une mCthode basCe sur 1'Cnergie pour Cvaluer le potentiel de IiquCfaction des sols pulvCrulents a CtC dCveloppCe a partir d'essais en laboratoire et de donnCes d'observation obtenues au cours des principaw tremblements de terre antkrieurs. Des essais triaxiaux cycliques et des essais de cisaillement simple cycliques ont CtC faits, et les resultats dCmontrent qu'il existe une relation unique entre l'tnergie dissipCe au cours du chargement cyclique et l'exctdent de pression interstitielle qui conduit Cventuellement a la rupture en liquefaction. Cette relation unique a CtC combinCe avec une Cquation d'attknuation d'knergie pour dCfinir un crittre de liqukfaction potentielle d'un site. Des paramttres pour le critkre ont CtC CvaluCs a partir de 136 sites impliquCs dans 13 tremblements de terre majeurs a travers le monde. La mCthode de 1'Cnergie a CtC comparCe avec la mCthode de contrainte plus couramment utilisee. I1 a CtC observe que la mCthode de 1'Cnergie est plus simple a utiliser et plus fiable.
Mots clis : tnergie, tremblement de terre, potentiel de liqubfaction, essai de pCnCtration standard, essai cyclique en laboratoire, pression interstitielle, sols pulverulents, histoire de cas.
[Traduit par la revue]
Can. Geotech. J. 27, 320-329 (1990)
Introduction
Soil liquefaction may arise when saturated granular or cohesionless soils are shaken, resulting in a loss of strength. In this state the soil will behave like a liquid. This will cause building settlement or tipping, sand boils, ground cracks, landslides, dam instability, highway embankment failures, or other hazards. Such damages are generally of great con- cern to public safety and are of economic significance.
The assessment of the potential for liquefaction due to an earthquake at a site is a complex engineering problem. Many factors influence the mechanism of liquefaction. They include the magnitude and intensity of the earthquake, the seismic attenuation characteristics, the distance from the source of the earthquake, soil type and properties, confining pressure, and other site-specific conditions. Considerable attention has been given to solving this problem and a number of methods now exist for analysis of liquefaction potential.
There are two broad groups of analysis. The first group (Seed and Idriss 1967, 1971) involves estimating the shear stress level likely to develop in the field under a certain design earthquake. Then laboratory tests are conducted on soil samples to determine the liquefaction resistance under the design earthquake. By comparing the induced shear level
Printed in Canada / lmprime au Canada
and the liquefaction resistance, liquefiable zones are identified.
The second group of analysis is based on field observations of performance of sites subjected to earthquakes in the past. Data on earthquake characteristics and soil resistance measured with the standard penetration test are compiled to establish an empirical relationship for new sites. This group can be further divided into two classes. The first class is based on the possible dynamic stress induced at a site under a design earthquake (Iwasaki et al. 1978; Seed et al. 1983). The second class is based on the dissipated seismic energy (He 1981; Davis and Berrill 1982). Although the first class has been more widely applied, the second class possesses some advantages, which will be described later. This paper describes a study that builds on the energy con- cept for assessing the liquefaction potential of a site. By means of laboratory testing, a basic relationship is estab- lished between the excess pore pressure that ultimately leads to liquefaction and parameters governing the soil state. This relationship is combined with dissipated seismic energy and the corrected standard penetration resistance to form a simple criterion for evaluating liquefaction potential. Case records of 136 sites were studied and the results show that this energy method is simpler and more reliable than the stress method by Seed et al. (1983).
LAW ET AL. 321
STRESS 40
1
1
FIG. 1. Hysteretic loop of the soil under cyclic loading. Development of an energy approach
Soil will deform under vibrations in a hysteretic manner as
I shown in Fig. 1 . During the deformation process, energy
will be dissipated. The amount of energy dissipated is com- monly represented by the area of the hysteresis loop.
For dry sand, deformation leads to slippage and rear- rangement of the sand grains. Consequently, a volumetric change of the soil skeleton will result. If the sand is saturated and if drainage is not permitted during deformation, the tendency of the volumetric change is to cause a transfer of the effective stress from the soil grains to the pore water. An excess pore pressure (Au) is then generated as proposed by Martin et al. (1975):
[ l ] Au = E, Av
where E, is the modulus of resilience of the sand and Av the equivalent volumetric change in a dry state.
As the volumetric change is related to the energy dissipated in the soil ( w ) , [ l ] can be rewritten as
[2] Au = E, F(w) or
[ 3 ] Au = G(w)
where F(w) and G(w) are functions of the dissipated energy. These functions can be experimentally determined. Experimental study
Fujian standard sand was used for the experimental study. It is a clean medium sand with a uniformity coefficient (C,) of 1.59, mean effective size (DSo) of 0.40 mm, maximum void ratio (em,) of 0.855, and minimum void ratio (emin) of 0.554.
Two test devices were used in the testing program: ( 1 ) a cyclic triaxial cell and (2) a cyclic torsional simple shear apparatus. The cyclic triaxial cell tested samples of 80 mm height and 39.1 mm diameter. It used water as cell fluid. The cyclic load was applied with an electromagnetic drive. This device differs from the electropneumatic drive commonly used in North America in that cyclic load of a much larger frequency range (0.1-50 Hz) can be applied. The torsional simple shear apparatus was developed by Tatsuoka et al. (1982). It applied horizontal cyclic torque on a hollow cylin- drical specimen of 100 mm outer diameter, 60 mm inner diameter, and 100 mm height. The torque was provided via an electropneumatic drive. Again, water was used as the cell fluid to apply the cell pressure.
U 1
0 5 10 15 20 25 30 35 40 45 50
TIME (s)
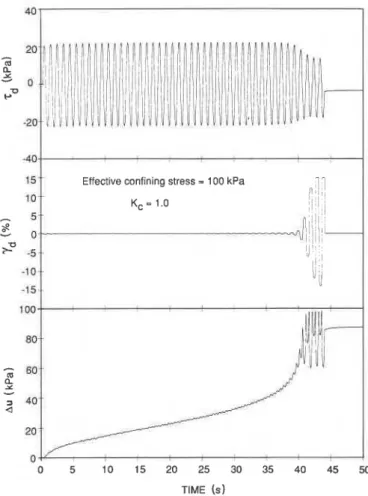
FIG. 2. Typical stress ( T , ) , strain (y,), and pore pressure (Au) plots of a cyclic torsional test.
For both test devices, samples were prepared using the moist tamping method in appropriate moulds. The satura- tion process consisted of passing carbon dioxide through the sample under a small cell pressure to displace the air in the void space. Distilled water was then passed through the sample to replace the carbon dioxide. Any trace of carbon dioxide that remained in the sample would dissolve in the pore water when a back pressure of either 100 or 200 kP_a was applied. The pore pressure to confining stress ratio, B, measured after consolidation was generally in the neighbourhood of 0.95.
Samples were prepared at different relative densities (D,) and consolidated at different pressures. Both isotropic (Kc = 1 .O) and anisotropic (Kc # 1 .O) consolidation were used, where Kc is the consolidation ratio defined as Kc = u;/u,f,, with a,! and a{ being the consolidation pressure in the vertical and the horizontal direction, respectively. A constant frequency of 1 Hz was maintained in all the tests.
During the undrained cyclic shearing stage, readings were taken via electronic sensors using an IBM PC compatible data acquisition system. For a cycle in the cyclic triaxial test, 40 readings were taken of each of excess pore pressure, ver- tical cyclic load, and vertical displacement. Similarly, in the torsional simple shear test, 40 readings were taken of each of excess pore pressure, horizontal cyclic torque, horizontal rotation, and vertical displacement. The appropriate read- ings were processed after the test to define the hysteresis loop for estimating the dissipated energy. The stress, strain, and pore pressure responses during the cyclic triaxial and the
CAN. GEOTECH. J. VOL. 27, 1990
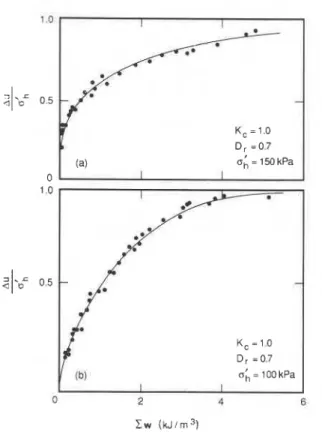
FIG. 3. Typical laboratory test results on Fujian medium sand: (a) triaxial tests; (b) torsional tests.
cyclic torsional simple shear tests are similar to those reported in the open literature for common sand. Typical test result of a cyclic torsional simple shear test are shown in Fig. 2.
A concept of cumulated energy per unit volume (C w) is introduced to analyze the test results. This quantity is obtained by the summing of all the areas of the hysteresis loops, represented on a stress-strain plot, after a certain number of load cycles. Figure 3 shows typical test results for both the cyclic triaxial and the torsional simple shear tests. The excess pore pressure Au normalized by a,!, is plotted against C win the figure. The test results show that within reasonable experimental scatter, there exists a func- tional relationship between Ada,!, and C w .
A normalized dimensionless energy is proposed here to account for the influence of a{, Kc, and Dr. It is expressed as
where Fl(Kc) is the normalizing function to account for Kc
and F2(Dr) is the normalizing function to account for Dr. Based on statistical analysis of all the test data from the cyclic triaxial tests, Fl can be given by
[51 Fl(Kc) = 1
- E
log(Kc)where
t
depends on soil type and test condition. For this case, [ = 3.0.The function F2 was determined using the test results from the cyclic torsional simple shear tests and the following is found to be applicable:
[6] F2(D,) = 10"Dr-0.70)
where
3-
also depends on soil type and test condition andis equal to - 2.0 in this test series.
""I I
FIG. 4. Normalized excess pore pressure A d a { vs. normalized dissipated energy W N .
FIG. 5. Normalized excess pore pressure A d a { vs. normalized dissipated energy WN on a log-log plot.
Putting [5] and [6] into [ 4 ] , one obtains the normalized energy (WN) corresponding to the normalized excess pressure ( A d a { ) and the results are plotted in Fig. 4. A single functional relationship between these two quantities emerges from the data. To mathematically define the rela- tionship, the results are replotted in Fig. 5 on a log-log scale. This plot shows there is an approximate linear relationship between Au/u{ and WN. The relationship can be repre- sented by Au [7] - = a
wg
4
or by substitution into [4]: Au [8] - = a[F,(Kc) F2(D,) C w / a ~ ] ~4
Equation [8] states that the excess pore pressure under cyclic load for a given sand can be uniquely related to the consolidation pressure, consolidation ratio, relative density, and the cumulative dissipated energy.
For the development in the ensuing sections, this unique- ness is vital, though the exact evaluation of parameters such as
t ,
(, a, and0 is not necessary, as will be illustrated.
Assessment of liquefaction potential at a site
The total energy (E) in joules released from an earthquake of magnitude M on the Richter scale is given by (Gutenberg and Richter 1956)
[ g ] E = 104.8+1.5M
This energy equation is chosen here because it has been widely used. Other representations such as that by Street
LAW ET AL.
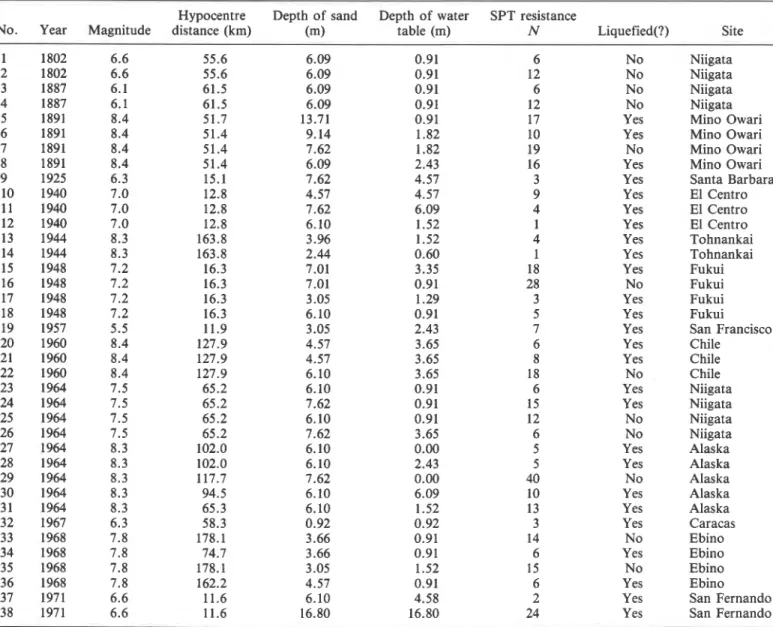
TABLE 1. Site conditions and earthquake data for liquefaction study (after Seed et al. 1975)
Hypocentre Depth of sand Depth of water SPT resistance
No. Year Magnitude distance (km) (m) table (m) N Liquefied(?) Site
No No No No Yes Yes No Yes Yes Yes Yes Yes Yes Yes Yes No Yes Yes Yes Yes Yes No Yes Yes No No Yes Yes No Yes Yes Yes No Yes No Yes Yes Yes Niigata Niigata Niigata Niigata Mino Owari Mino Owari Mino Owari Mino Owari Santa Barbara El Centro El Centro El Centro Tohnankai Tohnankai Fukui Fu kui Fukui Fukui San Francisco Chile Chile Chile Niigata Niigata Niigata Niigata Alaska Alaska Alaska Alaska Alaska Caracas Ebino Ebino Ebino Ebino San Fernando San Fernando and Lacroix (1979) are useful for specific regions. Consistent
use of one single equation will give rise to some scatter when analyzing the case histories. This will be reflected in the precision of the proposed method to be dealt with in a later section.
Only a fraction of the total energy will arrive at a site away from the earthquake source. Some energy will be dissipated by material attenuation along ray paths and further attenua- tion will occur because of geometric damping. From studies
by Murphy and O'Brien (1977), Hasegawa et al. (1981), and
Nuttli (1979), the attenuation equation for the seismic energy per unit soil volume arriving at a site (EI) can be expressed as a function of the hypocentral distance (R):
[lo] EI(E, R) = B E / R ~
where 19 is assumed to be a constant and B is a coefficient depending on the properties of the rock through which the seismic waves traverse; its value ranges from 2.5 to 5.0.
A part of the vibration energy arriving at a site (EI) will be dissipated by the soil found at the site. The amount of
dissipated energy per unit volume (C w) is dependent on EI
and the soil state at the site. The soil state can be
characterized by the relative density and the stress system on the soil, which in turn can be represented by an energy dissipation function A:
[ I l l C w =
X(4,
Kc, D,) EdE, R)The use of [ l l ] may raise two questions. The first deals with soil amplification and the second with the amount of energy reaching the upper part of a soil layer after some energy loss in the lower part.
Soil amplification is the process by which ground motions in certain frequency ranges may be magnified. This is always accompanied by attenuation of ground motions in another frequency range. The stress method for assessing liquefac- tion potential is based on the maximum peak horizontal acceleration at the ground surface. This implies that some part of ground motions is selectively accounted for while another part is being ignored. This, therefore, constitues a definite deficiency in the stress method. On the other hand,
the total energy travelling through and dissipated in a soil
media remains unchanged whether part of the motions is amplified or attenuated. The use of the energy approach therefore more adequately accounts for the complete spec-
324 CAN. GEOTECH. J. VOL. 27, 1990
trum of ground motions that gives rise to liquefaction failure.
Equation [lo] describes the energy arriving at any part of a soil layer. As shown later, the coefficient B is found to be 4.3, a value resulting from the combined effects of geometric damping (in which case B = 2) and hysteresis damping. For the upper part of a soil layer, the hypocentral distance will be larger than that of the lower part. The E, for the upper part, therefore, will be smaller than that for the lower part, indicating an absorption of energy in the lower part. In practice, however, R is in 10's of kilometres and the thickness of the soil layer in 10's of metres; the energy EI arriving at different depths of the soil layer is therefore not significantly different.
Substituting [9]-[l l] into [8], one obtains:
Au = a Fl(Kc) F2(D,) A("{, Kc, D,) 6 x 10¹⁵M+4.8 0
[I21
7
o h U { R ~
I
The right-hand side of [12] contains functions of ui, Kc, and Dr. These functions, along with the constants, can be lumped into a single function, r]. To simplify the application
of [12], the parameters for r] should be chosen on the basis
that it can be easily determined and reflects the influence of ui, Kc, and D, (Gibbs and Holtz 1957). It is proposed here to use the resistance from the standard penetration test (SPT) corrected to a standard effective vertical overburden stress (Nl) (Seed et al. 1983) and for different energy effi- ciencies associated with test procedures (Seed et al. 1985). Hence r] can be represented by
The use of the effective vertical stress for correcting N values should not be confused with the use of effective hor- izontal stress for assessing liquefaction potential in the lab- oratory. The correction is a process by which N values obtained at different depths corresponding to different con: fining stresses can be compared on a single stress reference. This reference is arbitrary and other references such as the effective horizontal stress could have been used.
Putting [13] into [12] yields
For cohesionless soils, the condition of liquefaction is reached when the stress or the in situ confining stress (a{) is completely transferred to the pore water so that the excess pore pressure is equal to a{, i.e., when
where vL(Nl) is the critical value of r](Nl) at which liquefac- tion will take place.
Equation [15] can be simplified to allow for a ready appreciation of the mechanics of liquefaction. The term vL(Nl) is a function of soil resistance as measured by the
SPT. It is called the liquefaction resistance function. The other functions involving M and R, both having influence on the energy arriving at the site, can be combined to form a function, T(M, R), that reflects the intensity of the earth- quake. Hence, T(M, R) is called the seismic energy intensity function and is given by
[16] T(M, R) = 1 0 ' . 5 M / ~ B
Liquefaction will take place when the seismic energy inten- sity function exceeds the liquefaction resistance function. This can be represented by
The next task is to evaluate the functions T and r ] ~ , by analysis of recorded observations made during past earthquakes.
Analysis of existing records
Two main sources of data were used in this analysis. The first was from the works of the University of California at Berkeley (Seed et al. 1975). This source listed 11 damaging earthquakes that occurred in the U.S.A., Japan, and Chile in the period 1802- 197 1. The earthquake magnitudes ranged from 5.5 to 8.4. A total of 38 sites was investigated for liquefaction or the lack of it.
The second source was from China (Xie 1984). Two major earthquakes were considered in which appropriate informa- tion was available. The 1976 devastating Tangshan earth- quake killed 248 000 people. The magnitude was 7.8 and the hypocentre was at 11 km right beneath the city. The damage was extensive over a large area and 92 sites were studied. The other earthquake occurred in Haicheng in 1975, with a magnitude of 7.3. Six sites were considered from this earthquake.
For each site the following information was gathered: earthquake magnitude, hypocentre or epicentre location, soil type, depth of soil studied, depth of groundwater table, stan- dard penetration resistance, hypocentre distance of the site, peak acceleration at the ground surface, average induced dynamic stress ratio, T,,/U;, and identification of liquefac- tion occurrence. A data base was compiled for all 136 records. The appropriate information for the present analysis is shown in Tables 1 and 2. A summary of all the events is shown in Table 3.
Corrections for resistance from standard penetration test
(SPT)
The standard penetration resistance
(N)
is the number of blows by a hammer of a standard weight required to drive a standard sampling tube 0.3 m into the ground. The value of N for a given soil, is, therefore, proportional to the energy delivered to the drill stem. As noted by Seed et al. (1985), this energy is affected by the energy delivery system, the shape of the hammer, and the procedures of operation. To standardize the input for determining the function qL(Nl), correction has to be made on the basis of efficiency of the energy delivered to the drill stem. As the majority of the field data in the U.S.A. were obtained using the safety hammer that develops 60% energy efficiency, Seed et al.(1985) suggested the following for standardizing the data: [18] N,jO = 'PN
LAW ET AL. 325
TABLE 2. Site conditions and earthquake data from China for liquefaction study (after Xie 1984)
No. Year Magnitude distance (km) Type of sand* Hypocentre Depth of sand (m)
Depth of water table (m) 0.8 1
.o
1.2 0.8 0.5 1.6 0.7 1.1 1.4 1.1 1.4 1.2 1.1 1.2 0.6 0.7 0.9 2.0 3.1 1.6 1.5 2.0 1.2 0.7 1.3 1.o
1.0 1.o
1 .o 0.6 2.5 1.o
0.6 1.6 3.3 1.1 3.0 3.2 2.3 2.2 2.3 2.5 2.9 0.6 3.0 1.3 1.1 0.7 0.6 1.o
0.6 1.5 2.3 2.0 3.3 3.8 1.5 1.1 2.8 3.1 3.1 0.4 SPT resistance N Site Yes Yes Yes Yes Yes Yes Yes Yes Yes Yes Yes Yes Yes Yes Yes Yes Yes No No No No No No No No No No No No No No No No Yes Yes Yes Yes Yes Yes Yes Yes Yes Yes Yes Yes Yes Yes Yes Yes Yes Yes Yes No No No No No No No No No Yes Tangshan Tangshan Tangshan Tangshan Tangshan Tangshan Tangshan Tangshan Tangshan Tangshan Tangshan Tangshan Tangshan Tangshan Tangshan Tangshan Tangshan Tangshan Tangshan Tangshan Tangshan Tangshan Tangshan Tangshan Tangshan Tangshan Tangshan Tangshan Tangshan Tangshan Tangshan Tangshan Tangs han Tangshan Tangshan Tangshan Tangshan Tangshan Tangshan Tangshan Tangshan Tangshan Tangshan Tangshan Tangshan Tangshan Tangshan Tangshan Tangshan Tangshan Tangshan Tangshan Tangshan Tangshan Tangshan Tangshan Tangshan Tangshan Tangshan Tangshan Tangshan Tangshan326 CAN. GEOTECH. J. VOL. 27, 1990
TABLE 2 (concluded)
Hypocentre Depth of sand Depth of water SPT resistance
No. Year Magnitude distance (km) Type of sand* (m) table (rn) N Liquefied(?) Site
Yes Yes Yes Yes Yes Yes Yes Yes Yes Yes Yes Yes Yes Yes Yes Yes Yes Yes No No No No No No No No No No No No Yes Yes Yes Yes No No Tangshan Tangshan Tangshan Tangshan Tangshan Tangshan Tangshan Tangshan Tangshan Tangshan Tangshan Tangshan Tangshan Tangshan Tangshan Tangshan Tangshan Tangshan Tangshan Tangshan Tangshan Tangshan Tangshan Tangshan Tangshan Tangshan Tangshan Tangshan Tangshan Tangshan Haicheng Haicheng Haicheng Haicheng Haicheng Haicheng * I for sand, 2 for silty sand.
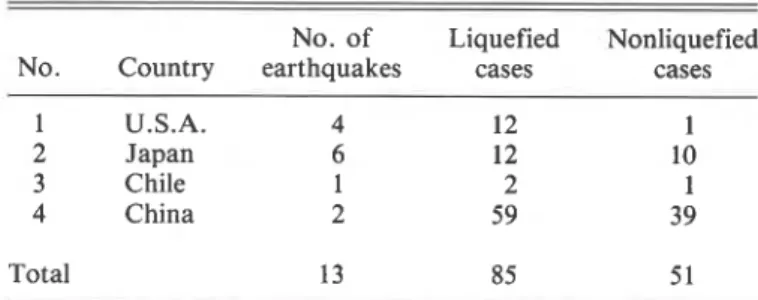
TABLE 3. Summary of data base for seismic liquefaction cases (1802-1976)
No. of Liquefied Nonliquefied
No. Country earthquakes cases cases
- - 1 U.S.A. 4 12 1 2 Japan 6 12 10 3 Chile 1 2 1 4 China 2 59 39 Total 13 85 5 1
where N60 = SPT resistance standardized to 60% energy efficiency,
[19] q = ER/60
and ER = energy efficiency of SPT system from which the uncorrected resistance N was obtained. Such a standardiza- tion has been used in the analysis in the present paper. Since data from the U.S.A., Chile, Japan, and China were used, the following briefly describes the appropriate corrections. According to Seed et al. (1985), the practice of SPT in the U.S.A. and in most Pan-American countries yields the
following: for a safety hammer used with 2 wraps of a rope around a pulley, 9 E 1.0; for a donut hammer used with 2 wraps of a rope around a pulley, \k E 0.75.
Kovacs and Salomone (1984) and Seed et al. (1985) have compared the SPT in the U.S.A. and in Japan. They showed that the energy efficiency from the SPT in Japan is higher than that in the U.S.A. However, the Japanese practice adopts a significantly slower frequency and a smaller drill hole. The combined effects for loose to medium dense sand lead to 9 = 1.17 for a donut hammer with free-fall release, and 9 = 1.0 for a donut hammer with special throw release. Experience of the use of SPT in China was summarized by Huang (1982) and Seed et al. (1985). Prior to 1975, the Chinese SPT hammers were operated manually with the rope and pulley method. The corresponding 9 is equal to 0.83. More recently, Chinese engineers generally use an automatic mechanical trip to release the hammer. This yields an energy efficiency of about 60%; hence 9 is equal to 1.0.
After correction for energy and operational variations, the SPT resistance also requires a correction for the effective overburden pressure, a:. An arbitrary reference a: =
100 kPa was used here as proposed by Seed et al. (1983) and the following correction applies:
10' 0.1 1 10 100 CORRECTED SPT RESISTANCE, N1 LAW ET AL. I I LIQUEFIED SlTE 0 NONLlQUEFlED SlTE f a ' . 10' 0.1 1 10 100 CORRECTED SPT RESISTANCE, N 1
-
0FIG. 6 . Correlation of seismic energy intensity function with corrected SPT resistance from the data of Seed et al. (1975).
where CN = a function of a: at the depth where the penetration test was conducted. Typical values of CN were given by Seed et al. (1983). The fully corrected N, value was used in establishing the qL(Nl) function.
m
-
Parameter B for earthquake intensity function
The determination of the earthquake intensity function as defined by [16] requires the evaluation of parameter B. This parameter describes the attenuation characteristics of the seismic energy as expressed in [lo]. For a highly fractured rock mass, the energy absorption is high. The correspond- ing energy attenuation will be high and the B value will be large. On the other hand, when the rock mass is intact, the B value will be low.
Hasegawa et al. (1981) summarized existing information and proposed a mean B value of 4.3 k 0.5 for western Canada and western U.S.A., where highly fractured rock prevails. A B = 4.3 was chosen for the present study, as all the field data are from regions of highly fractured rock mass. Hence @
s',
a . 0-
0 1 I where R is in kilometres. 0% O-
-
0-
(D 0Analysis of data of Seed et al. (1975)
This set of data is plotted in Fig. 6. On the basis of the treatment of the data by Seed et al. (1975) and Seed et al. (1983), the overwhelming majority of the sites can be con- sidered as composed of sand. Both T and N, are shown on a logarithmic scale. Each filled circle represents a case of liquefaction failure, while each unfilled circle represents a nonliquefied site. A straight line is drawn to define the boundary separating the liquefied and nonliquefied sites. This line, therefore, mathematically corresponds to the equa- tion for the condition of liquefaction and be written as
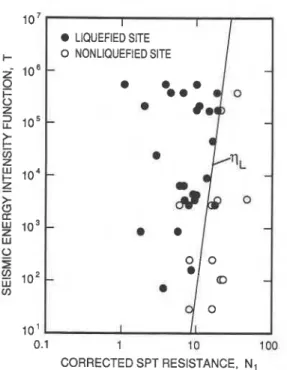
FIG. 7. Correlation of seismic energy intensity function with corrected SPT resistance for sand sites from the Chinese data (Xie 1984).
10' 0.1
FIG. 8. Correlation of seismic energy intensity function with corrected SPT resistance for silty sand sites from the Chinese data (Xie 1984). 1 10 100 I I LIQUEFIED SlTE 0 NONLlQUEFlED SlTE
-
Substituting [22] and [21] into [17], one obtains CORRECTED SPT RESISTANCE, N1
.'
-
a8
-
.@
IAnalysis of Chinese data
The Chinese data (Table 2) show that a significant number of sites are located on silty sand, which behaves differently from sand. The data, therefore, warrant a separation of these two materials for a more accurate definition of qL(Nl). The data for sand are plotted in Fig. 7. Again, a line
I I
-
I 13 I-
-
-
11, FOR-
SILTY SAND- I I I 'll~FOR-
I SAND I I ICAN. GEOTECH. J. VOL. 27, 1990
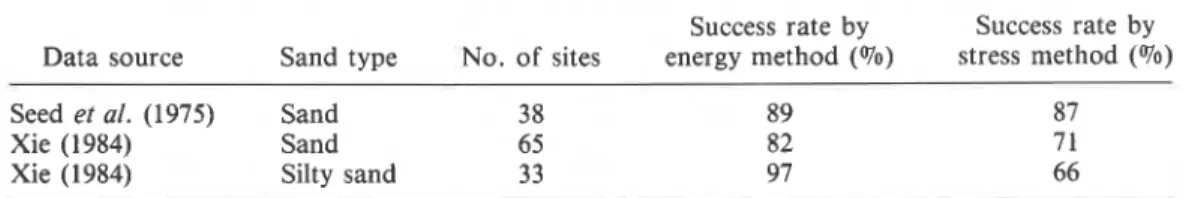
TABLE 4. Comparison of success rates on predicting liquefaction events by the present energy method and by the stress method of Seed et al. (1983)
Success rate by Success rate by
Data source Sand type No. of sites energy method (070) stress method (%)
Seed et al. (1975) Sand 3 8
Xie (1984) Sand 65
Xie (1984) Silty sand 33
can be drawn to divide the liquefied and nonliquefied sites. This line is identical to that for the data described in the previous section.
Figure 8 plots the data for the silty sand sites. A similar line can also be drawn to distinguish the liquefied sites from the nonliquefied ones. The mathematical expression for this line, however, is different from that for sand. It is given by [24] qL(Nl) = 1.14 x
~
i
x~
.
~
This liquefaction resistance function implies that silty sand can withstand a higher earthquake intensity than sand of the same resistance Nl. This is probably due to the cohesiveness of the silty component that enhances the dynamic resistance of the silty sand. According to Zhou (1981), the silty sand found near Tangshan is composed of about 60% silt-size particles or less and about 14% clay.
Comparison of energy method and stress method
The present method is simpler to apply than the method by Seed et al. (1983). The present method requires the values of R and M. For an earthquake that has taken place, these two quantities can now be reasonably determined. For design purposes, however, these quantities have to be predicted using a probabilistic approach that is readily avail- able in the open literature (e.g., Basham et al. 1982). As soon as these quantities are obtained, along with the Nl values, the liquefaction potential of a site can be examined based on [17].
The stress method of Seed et al. also requires evaluation of two quantities of an earthquake: peak horizontal accel- eration of the bedrock (a,) and magnitude (M). The pro- cess of determination of a, and M is similar to that of the present method. After evaluation, however, these values cannot be applied directly to examine the liquefaction potential of a site, assuming Nl is known. Two more steps are required. First, the peak horizontal acceleration at the ground surface has to be estimated using a, with due regard to soil amplification or attenuation of vibration as mentioned earlier. This change of ground motion charac- teristics depends on the geometry and properties of the soil layers. Second, this method is based on observations of earthquakes of M approximately equal to 7.5. Estimation of liquefaction potential at other magnitudes is based on a laboratory study to yield a curve showing the liquefaction resistances at various numbers of cycles of loading. This curve then provides correction factors for application of values of M other than 7.5.
The use of the energy concept in the present study is unambiguous compared with the acceleration concept in the stress method. Energy is a scalar and as such there is no need to determine any direction. Acceleration is a vector with two horizontal components and a vertical component. Only the maximum value of horizontal acceleration is used and the vertical component is ignored in the stress method. There
89 87
82 71
97 66
is a growing appreciation of a significant vertical component (e.g., Atkinson 1986) that many have bearing on the stress method.
The present energy method is more reliable than the stress method. It should be noted that both methods produce curves for examining the likelihood of liquefaction failure for sand and for silty sand. While the energy method is based on the Chinese data and the data of Seed et al. (1975), the stress method is based also on the data of Seed et al. (1975) and other data from Seed et al. (1983), who claimed that the stress method is applicable to the Chinese data. Therefore, application of both methods to the data base col- lected in this study will fairly reflect their relative reliability. A comparison of the results is shown in Table 4. For the first group of data from Seed et al. (1975), the success rates of correctly ~redicting the occurrence and nonoccurrence of liquefactidn failure-are 89% and 87% for the energy and the stress methods, respectively. For the Chinese data involv- ing sand sites, the success rates of the energy method and the stress method are 82% and 71070, respectively. For the silty sand sites, the corresponding success rates are 97% and 66070, respectively. Therefore, the energy method has a higher rate of success in evaluating liquefaction potential.
A worked example
The use of [23] for analyzing liquefaction potential is illustrated with an example from the recent 1989 Loma Prieta (San Francisco) earthquake. The magnitude on the Richter scale of this earthquake is 7.1 and the focal depth is 18.5 km. This earthquake is considered the largest natural disaster in U.S. history, with estimated damage costs as high as U.S. $10 billion. Liquefaction failure was extensive (Astaneh et al. 1989). In the Marina district on the central part of the north- ern coast of San Francisco, the senior author noted at least 20 spots of sand boils during a site visit shortly after the earthquake. This district is 100 km away from the epicentre. The hypocentral distance R is therefore equal to (loo2
+
1 8 . 5 ~ ) " ~ = 101.7 km. Substituting the values of R and M into [23], one obtains, for the condition of liquefaction fail- ure, a corrected SPT resistance Nl of less than 10.3.The subsoil deposit of the Marina district is composed of a hydraulic fill placed on top of a thick layer of San Francisco Bay mud. The material of the sand boils is a dark gray uniform sand with occasional sea shells, indicating the hydraulic fill liquefied during the earthquake. Such a mate- rial having a value of Nl less than 10.3 is not surprising.
Summary and conclusions
A study has been conducted to establish a method for site evaluation of liquefaction potential based on an energy approach. Cyclic triaxial and cyclic torsional simple shear tests have been conducted on a Fujian medium sand. The results were analyzed along with earthquake parameters to
LAW ET AL. 329
derive a simple equation for determining liquefaction poten- tial. The equation was applied to published records to evaluate the appropriate parameters and to test its validity. The following conclusions can be drawn from the study: (1) A unique relationship exists between excess pore pressure and dissipated energy during cyclic loading on sand. This relationship, mathematically represented by [8], takes into account consolidation stress, consolidation ratio, and relative density.
(2) The unique relationship can be combined with an earth- quake energy attenuation equation to yield a simple criterion, [17], for defining the condition of liquefaction. This criterion involves the use of earthquake magnitude, hypocentral distance, and the corrected resistance from the standard penetration test.
(3) Constants for the criterion have been determined based on 136 sites from 13 major earthquakes over the world. (4) This energy method has been compared with the stress method by Seed et al. (1983). The comparison shows the energy method is simpler to apply and more reliable.
Acknowledgements
HE, G.N. 1981. Energy analysis procedure for evaluating liquefac- tion potential [in Chinese]. Chinese Journal of Geotechnical Enginering, 3: 11-21.
HUANG, S.M. 1982. Experience on a standard penetration test. Proceedings, 2nd European Symposium on Penetration Testing, Amsterdam, vol. 1, pp. 61-66.
IWASAKI, T., TATSUOKA, F., TOKIDA, K., and YASUDA, S. 1978. A practical method for assessing soil liquefaction potential based on case histories at various sites in Japan. Proceedings, 2nd International Conference on Microzonation for Safer Construction-Research and Applications, vol. 2, pp. 885-896. K o v ~ c s , W.D., and SALOMONE, L.A. 1984. Field evaluation of SPT energy, equipment and methods in Japan compared with the SPT in the United States. National Bureau of Standards, U.S. Department of Commerce, NBSlE-2910.
MARTIN, G.R., FINN, W.D.L., and SEED, H.B. 1975. Fundamen- tals of liquefaction under cyclic loading. ASCE Journal of the Geotechnical Engineering Division, 101: 423-438.
MURPHY, J.R., and O'BRIEN, L. J. 1977. The correlation of peak ground acceleration amplitude with seismic intensity and other physical parameters. Bulletin of the Seismological Society of America, 67: 877-915.
NUTTLI, O.W. 1979. The relation of sustained maximum ground acceleration and velocity to earthquake intensity and magnitude. US Armv Engineer Waterwavs Ex~eriment
.
-
Station. Miscella-The authors express their sincere appreciation for the neous Paper S-76-1, Report 16, p. 74.
assistance of the geotechnical laboratory staff, Dalian SEED, H.B., and IDRISS, I.M. 1967. Analysis of soil
University of Technology, China, in conducting the test pro- liquefaction-Niigata earthquake. ASCE Journal of the Soil
gram. The research was partly funded by Natural Sciences Mechanics and Foundations Division$ 93: 83-lO8.
and ~ ~~~~~~~~h council ~ of canada operation i ~ - ~ 1971. Simplified procedure for evaluating soil liquefaction ~ ~ i ~ ~
grant No. A4387. potential. ASCE Journal of the Soil Mechanics and Foundations
Division, 97: 1249-1273. ASTANEH, A., BERTERO, V.V., BOLT, B.A., MAHIN, S.A.,
MOEHLE, J.P., and SEED, R.B. 1989. Preliminary report on the seismological and engineering aspects of the October 17, 1989 Santa Cruz (Loma Pireta) earthquake. Earthquake Engineer- ing Research Center College of Engineering, University of California, Berkley, Report UCB/EERC-89/14.
ATKINSON, G.M. 1986. Ground motion for eastern North America. Ontario Hydro, Toronto, Ont., Report 86353. BASHAM, P. W., WEICHERT, D.H., ANGLIN, F.M., and BERRY,
M.J. 1982. New probabilistic strong seismic ground motion maps of Canada: a compilation of earthquake source zones, methods and results. Energy, Mines and Resources Canada, Earth Physics Branch, Open File 82-33.
DAVIS, R.O., and BERRILL, J.B. 1982. Energy dissipation and seismic liquefaction in sands. Earthquake Engineering & Struc- tural Dynamics, 10: 59-68.
GIBBS, H.J., and HOLTZ, W.G. 1957. Research on determining the density of sands by spoon penetration testing. Proceedings, 4th International Conference on Soil Mechanics and Foundation Engineering, London, vol. 1, pp. 35-39.
GUTENBERG, B., and RICHTER, C.F. 1956. Magnitude and energy of earthquakes. Annali di Geofisica, 9: 1-15.
HASEGAWA, H.S., BASHAM, P.W., and BERRY, M. J. 1981. Attenuation relations for strong seismic ground motion in Canada. Bulletin of the Seismological Society of America, 71:
1943-1962.
SEED, H.B., ARANGO, I., and CHAN, C.K. 1975. Evaluation of soil liquefaction potential during earthquake. Earthquake Engineering Research Center, University of California. Berkley, Report EERC75-28.
SEED, H.B., IDRISS, I.M., and ARANGO, I. 1983. Evaluation of liquefaction potential using field performance data. ASCE Journal of Geotechnical Engineering, 109: 458-482.
SEED, H.B., TOKIMATSU, K., HARDER, L.F., and CHUNG, R.M. 1985. Influence of SPT procedure in soil liquefaction resistance evaluations. ASCE Journal of Geotechnical Engineering, 111:
1425-1445.
STREET, R.L., and LACROIX, A. 1979. An empirical study of New England seismicity: 1727-1977. Bulletin of the Seismological Society of America, 69: 159-175.
TATSUOKA, F., MURAMATSU, M., and SASAKI, T. 1982. Cyclic undrained stress-strain behaviour of dense sand by torsional simple shear test. Soils and Foundations, 22: 55-70.
XIE, J.F. 1984. Some comments on the formula for estimating the liquefaction of sand in revised aseismic design code. China Earthquake Engineering and Engineering Vibration, 2: 95-126. ZHOU, S.G. 1981. Influence of fines on evaluating liquefaction of
sand by CPT. International Conference on Recent Advances in Geotechnical Earthquake Engineering and Soil Dynamics, St. Louis, MO, vol. 1, pp. 167-172.