Characterization, Orientation, and Deformation Behavior
of the Double Gyroid Phase
in Elastomeric Triblock Copolymers
by
Benita Jean Dair
B.S., Materials Science and Engineering, 1994
Cornell University, Ithaca, NY
Submitted to
the Department of Materials Science and Engineering and
the Program in Polymer Science and Technology
in Partial Fulfilment of the Requirements for the Degree of
Doctor of Philosophy in Polymers
at the
Massachusetts Institute of Technology
February 1999
C Massachusetts Institute of Technology, 1999. All Rights Reserved.
Author ...
M terials Science and Engineering
January 8, 1999
Certified by
...
. . . . .. . ...-... N .... ... . . . ...Edwin L. Thomas
Morris Cohen Professor of Materials Science and Engineering
Thesis Advisor
Accepted by ...
Linn W. Hobbs
MASSACHUSETTS INV,
John F. Elliott Professor of Materials
aJfgjU Chairman, Departmental Committee on Graduate StudentsCharacterization, Orientation, and Deformation Behavior of the Double Gyroid Phase in Elastomeric Triblock Copolymers
by
Benita Jean Dair
Submitted to the Department of Materials Science and Engineering and the Program in Polymer Science and Technology
on January 8, 1999 in Partial Fulfilment of the Requirements for the Degree of Doctor of Philosophy in Polymers
ABSTRACT
An oriented polystyrene-polyisoprene-polystyrene (SIS) double gyroid (DG) nanocomposite comprised of two separate interpenetrating glassy networks embedded in a rubbery matrix is studied as a function of applied strain to elucidate the anisotropic deformation microstructure and mechanisms. The morphologies of 34%-36% S SIS triblock copolymer thermoplastic elastomers were characterized to have double gyroid (DG) morphology by a combination of transmission electron microscopy (TEM), small-angle x-ray scattering (SAXS), simulations of level set surfaces using TEMsim, laser diffraction, and fast Fourier transforms (FFT). The polymers were then processed via roll casting, which produced oriented cylinder (34%S) and lamellar (36%S) films. Annealing treatment enabled nucleation and growth of the equilibrium oriented DG phase in the 34%S. The
<111> DG directions nucleated from the cylinder axes, and twinned {11 0}-type DG planes
nucleated in the plane of the film.
Mechanical properties and deformation microstructures were investigated via synchrotron
SAXS and simultaneous load-deformation measurements, as well as TEM of microtomed
sections from stretched DG fixed by high energy electron crosslinking. In the flow [111] direction, along the tightly wound continuous PS 3-fold screw helices, the modulus is 5
times larger than in the transverse direction, there is yielding with a distinct neck, 50%
higher mechanical hysteresis, and immediate residual strain of 100%. SAXS and TEM indicate that yielding and necking occur via plastic deformation of the PS domains, which then elongate and draw upon further stretching. At the highest strains, some pullout of PS endblocks is seen. In the transverse direction, samples do not neck, but rather undergo distributed yielding, indicative of defects and many grains in this direction. SAXS and TEM show that strain in this direction is accomodated by rotation of grains into the stretch direction followed by buckling of the [111] PS helices. The remarkable anisotropy of the mechanical properties is due to the high PS connectivity in the flow direction, and no continuous PS domains in the transverse. These materials were also found to have both microscopic and macroscopic memory and recover fully upon annealing above the glass
transition temperature of PS.
Thesis Supervisor: Edwin L. Thomas
Acknowledgments
I would like to thank my commitee, Prof. Edwin Thomas, Prof. Bernhardt Wuensch, and Prof. Mary Boyce, for providing me opportunities and guidance throughout my graduate school years, being encouraging, supportive and helpful, and taking interest in my professional and academic development. I am also grateful to Prof. Edward Kramer, previously at Cornell University, now at UC Santa Barbara, for encouragement, support, and advice during my formative undergraduate years at Cornell, and continuing throughout my graduate schooling. I am very thankful to Christian Honeker, who became my friend, teacher, and adviser ever from the start of tenure in the group.
The research would not have been possible without the help of the following people:
- Prof. Nikos Hadjichristidis and Apostolos Avgeropoulos from the University of Athens, Greece, for synthesizing the two SIS polymers with double gyroid composition, on which this thesis is based.
" Brian Walther, previously at DEXCO, now at to DOW, for synthesizing the commercial
analogs to the prototype triblocks at DEXCO.
" Malcolm Capel at NSLS beamline X12B, and Kenneth Wright at the MIT High Voltage
Laboratory for their expertise and assistance at the respective facilities.
" Prof. Lorna Gibson and Prof. Ali Argon for their generous time and scientific insight.
- Carl Zimba (NIST) and Stephane Joly for assistance at BNL, Ariel Eisen for assistance with spectra and birefringence measurements, AnneValerie Ruzzette and Rob Lammertink for assistance in rheology and ODT measurements, Jorgen Bergstrom for his assistance with finite element modelling
- Ramon Albalak for the design of the rollcaster, Christian Honeker and Carl Zimba for the design and modification of the stretcher and Jim Hoffman for providing TEMsim, - Mme. Sylvia Deplanque at the Librarie de Laboratoire de Mineralogie-Cristallographie,
Universite Pierre-et-Marie-Curie, Paris, France, for sending crystallography references, from which the introductory chapter on gyroid history developed.
" Lew Fetters (Exxon), Prof. Andrew Keller (University of Bristol), Prof. Yachin
Cohen, Prof. Edward Merrill, Michael Shin, Hartmut Rudmann, Yot Boontongkong, Anuj Bellare, and Olivera Kesler for helpful scientific and experimental discussions.
I thank the National Science Foundation and the Society of Automative Engineers for my financial support, and the Air Force Office for Scientific Research and National Science Foundation for research funds.
Thanks to all my family and friends, especially Berkland Baptist Church, for generous love and support throughout.
Most of all, I thank God for His grace, love, mercy, and faithfulness for me to complete the thesis.
Table of Contents
Page Number Title Page ... 1 Abstract ... 2 Acknowledgments ... 3 Table of Contents ... 5 List of Figures ... 8 List of Tables ... ... 18List of Symbols and Abbreviations ... 19
1. Thesis Overview and Organization ... 21
1.1 Opening Remarks ... 21
1.2 Overview ... 21
1.3 Thesis Organization ... 22
2. Background and M otivation ... 24
2.1 Project Objective and Motivation ... 24
2.2 Composites as Insight into Block Copolymer Properties ... 25
2.3 Block Copolymers as Polymer Composites ... 26
2.3.1 Block Copolymer Physics ... 27
2.3.2 Block Copolymer Morphologies ... 29
2.4 Block Copolymer Architectures ... 31
2.5 Triblock copolymers as Thermoplastic Elastomers ... 32
2.6 Enhanced M echanical Properties of the Interconnected Phases ... 33
2.7 Related M aterials and Models ... 37
2.7.1 Interpenetrating Networks ... 37
2.7.2 Cellular Materials ... 39
2.7.3 Theoretical Moduli Predictions for Interpenetrating-Phased Composites .... 39
2.8 M echanical Anisotropy of Cubic M aterials ... 41
2.8.1 Stress ... 42
2.8.2 Strain ... 43
2.8.3 Elasticity Tensor ... 44
2.8.4 Criteria for Mechanical Isotropy ... 46
2.9 References ... 48
3. History and Description of Gyroid and Double Gyroid ... 53
3.1 Crystallographic History of Gyroid ... 53
3.2 History of the Discovery of Double Gyroid in Soap Systems ... 55
3.3 History of the Discovery of Gyroid in Mathematical Minimal Surfaces ... 56
3.4 Double Gyroid in Subsequent Physical Systems ... 59
3.5 Description Of The Double Gyroid ... 61
3.6 References ... 66
4. Experimental Procedures ... 69
4.1 General Procedures for Morphological Characterization ... 69
4.1.1 Experimental Procedures ... 69
4.1.1.1 Small Angle X-ray Scattering ... 69
4.1.1.2 Transmission Electron Microscopy ... 71
4.1.2 M odeling of the DG and DD M orphologies ... 75
4.2 Imparting Orientation ... 77
4.2.1 Roll Casting Apparatus and Process ... 77
4.3 Experimental Procedures for Mechanical Testing ... 84
4.3.1 Tensile Specimen Preparation ... 84
4.3.2 Deformation Stages ... 85
4.3.2.1 Instron Tester ... 85
4.3.2.2 Mini Tensile Tester ... 85
4.3.3 Synchrotron SAXS ... 87
4.3.3.1 Set-U p ... 87
4.3.3.2 Calibration ... 89
4.3.3.3 In-Situ SAXS Experiments ... ... 89
4.3.3.3.1 Dynamic Series ... 90
4.3.3.3.2 Rotation Series ... 91
4.3.3.4 Analyzing SAXS Patterns ... 91
4.3.3.5 In-Situ Load Deformation Curves ... 92
4.3.4 In-Situ TEM (MIT High Voltage Lab) ... 92
4.4 R eferences ... ... 93
5. Acquiring Interconnected Cubic Triblock Copolymers ... 95
5.1 History of DD and DG Morphologies in Block Copolymers ... 96
5.2 Laboratory Scale SIS Triblocks (U. of Athens) ... 101
5.2.1 Synthesis and Chemical Characterization Procedures ... 101
5.2.2 32%S and 34%S SIS Triblocks ... 103
5.2.2.1 Synthesis by Linking Diblocks with Dichlorodimethylsilane ... 103
5.2.2.2 Morphological Characterization...105
5.2.2.2.1 The 32%S SIS Triblock ... 105
5.2.2.2.2 The 34%S SIS Triblock ... 106
5.2.3. The 36% S SIS Triblock ... 117
5.2.3.1 Sequential Addition of Monomers ... 117
5.2.3.2 Morphological Characterization ... 118
5.3. Industrial Scale SIS Triblocks (Dexco) ... 121
5.4 Morphology Results and Discussion ... 127
5.5 M ineral O il Blends ... 130
5.6 R eferences ... 133
6. Morphology of Rollcast Polymers with Composition in the DG Range ... 137
6.1 As-Roll Cast Morphologies ... 137
6.1.1 As-Roll Cast Morphology of 34 SIS ... 137
6.1.2 As-Roll Cast Morphology of 36 SIS ... 138
6.2 Background on Epitaxy and Transition Mechanisms ... 143
6.2.1 Lamellar, DG, and Cylinder Epitaxial Relationships ... 143
6.2.2 Transition Mechanisms ... 145
6.2.2.1 DG * Cylinder Transitions ... 146
6.2.2.1.1 Surfactant Systems ... ... 146
6.2.2.1.2 Block Copolymer Systems ... 147
6.2.2.1.3 Theoretical Calculations of Cylinder-to-DG Transitions in Block Copolymer Systems ... 147
6.2.2.2 Lamellar-to-DG Transition ... 149
6.2.2.2.1 Surfactant Systems ... 149
6.2.2.2.2 The Role of the Perforated Layer Phase in the Lamellar-to-DG Transition in Block Copolymer Systems ... 151
6.2.2.3 The Perforated Layer Phase ... 153
6.2.2.4 Kinetic Studies ... 156
6.3 Roll Cast, Annealed Morphology ... 158
6.3.2 Roll Cast Annealed 34%S SIS (Having Cylinder Precursor) ... 159
6.3.3 Equatorial Doublet ... 159
6.3.4 Indexing Orientation of Roll Cast 34%S SIS ... 162
6.3.5 TEM of Roll Cast Annealed 34%S SIS ... 165
6.4 R eferences ... 163
7. Mechanical Properties of the DG phase...176
7.1 Engineering Properties ... 176
7.1.1 Tables and V alues ... 176
7.1.2 Definition of Properties and Procedures for Assigning Values ... 178
7.2 General Mechanical Properties of Triblock Copolymers ... 183
7.2.1 Background on the Early Studies ... 183
7.2.2 Mechanical Properties of DG Triblock Copolymers: Discussion ... 188
7.3 Deformation Behavior of Polygranular Isotropic DG ... 195
7.3.1 Stress-Strain Behavior of DG Relative to the Classical Morphologies ... 195
7.3.2 Deformation Behavior of Polygranular Isotropic DG via SAXS ... 198
7.4 Orientation 205 7.5 Deformation of Oriented DG in the [111] Direction ... 206
7.5.1 Geometry of Oriented DG in the [111] Direction ... 206
7.5.2 In-situ SAXS of Deformation Along the [111] Direction ... 208
7.5.3 TEM of DG Deformed in the [111] Direction ... 212
7.5.4 Stress Relaxation of the [111] Direction ... 214
7.5.5 Discussion 216 7.6 Deformation of Oriented DG in the Transverse Direction ... 217
7.6.1 Description of the Transverse Direction ... 217
7.6.2 In-situ SAXS of Deformation in the Transverse Direction ... 217
7.6.3 TEM of DG Deformed in the Transverse Direction ... 220
7.6.4 Stress Relaxation of the Transverse Direction ... 227
7.7 R eferences ... 229
8. Predicting the <111> Modulus ... 234
8.1 Relative Modulus of DG along <111> Versus Cylinders Along the Axis ... 234
8.2 Estimating an Absolute Modulus from Beam Theory ... 239
8.2.1 General Cantilever Beam Bending ... 239
8.2.2 Application to Struts ... 241
8.2.2.1 Struts as Uniform Rods Deformed by Pure Bending ... 241
8.3 R eferences ... 253
9. Conclusions and Future Outlook ... 254
9.1 C onclusions ... 254
9.2 Future O utlook ... 255
List of Figures
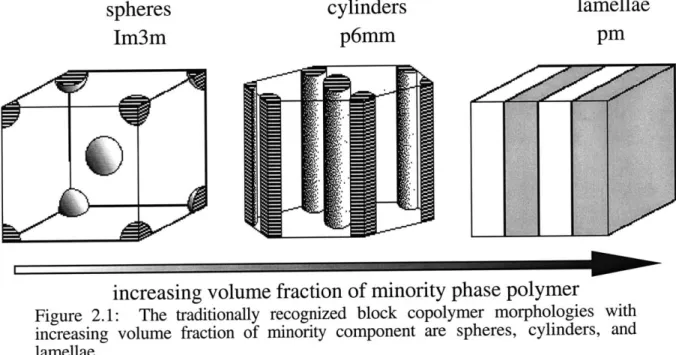
Figure 2.1: Figure 2.2: Figure 2.3: Figure 2.4: Figure 2.5: Figure 2.6: Figure 2.7: Figure 2.8: Figure 2.9: Figure 3.1:The traditionally recognized block copolymer morphologies with increasing volume fraction of minority component are spheres, cylinders, and lam ellae. ... 29
Ordered tricontinuous double gyroid and double diamond morphologies. Each structure consists of two connected networks, here shown in dark and grey shading. The space groups of each structure are given above each figure. (after Seddon, et al., 1993). ... 30 Schematics of linear block copolymers: a) AB diblock, b) ABA triblock, c) ABC triblock, d) 6-arm star diblock copolymer. The junctions between blocks are indicated by black dots. ... 31
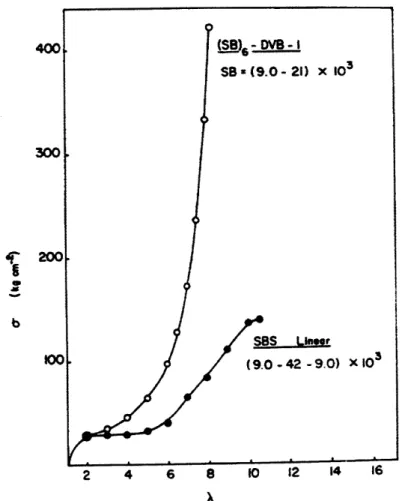
Stress-strain curves for linear triblock (probably cylinders) and for star block copolymer (interconnected cubic). a is the stress in kg/cm2, while X is the extensional ratio (i.e., engineering strain). (Bi and Fetters, 1974,
1976). ... 35
DMTA results for a 5-arm and 6-arm star, reproduced from Kinning,
1986. The sample identification 5/30/10 represents a 5-arm star having
diblock arms of 30% PS and 10K (10,000) molecular weight. The 5-arm star has a cylinder morphology, while the 6-arm star has the OBS m orphology. ... 36
Unpublished data from Alward (Ph.D. Thesis, 1989) comparing the stress-strain behavior of the OBS phase and the cylinder phase. ... 37 Resolved components of a generalized stress (adapted from Zener, 1948,
p. 10). ... 42
After deformation, a point originally at P moves to P', with a corresponding displacement vector u. ... 43 General displacement = pure deformation + rigid body rotation. ... 43 Schematics of a) left and b) right gyroid with {321} faces (reproduced from Klockmann's Lehrbuch der Mineralogie). It is particularly clear on these two {321} gyroid crystals that the surfaces lead the eye to turn to the left or right. ... 54
Figure 3.2: Figure 3.3: Figure 3.4: Figure 3.5: Figure 3.6: Figure 3.7: Figure 4.1: Figure 4.2:
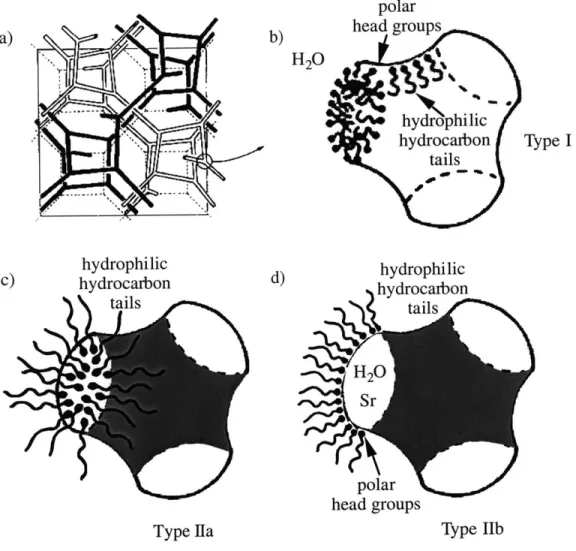
(a) A unit cell of the skeletal graph representation of the tricontinuous periodic Iald structure viewed slightly off a <100> direction. (b-d) Three enlargements of the node where three struts come together. The system in which the paraffin chains are on the inside of the struts is termed "type I", while that in which the paraffin chains are on the outside is termed "type
II". b) Type I represents the cases where the struts are composed of entire
molecules with the polar head groups laying on the surface of the strut. c) Type Ha represents the cases where the struts are composed of the heads of the molecules in water and the matrix is composed of the hydrocarbon tails and d) type IIb represents the cases where the struts are loci of the polar head groups, with the struts themselves composed of water, while the matrix is composed of the hydrocarbon tails. (Adapted from references [Rancon, 1987 #1748] and [Luzzati, 1967 #1727]). ... 57
Schematic of a portion of a surface (shaded region). At any given point on the surface, the local normal is n and the two principal radii of curvature, R, and R2, which are the maximum and minimum radii of curvature of the surface, respectively. The principal curvatures, C1 and C2, are defined as
1 1
C1 =
i
and C2= -R . ... 58Schematic of DG struts and nodes at 34 vol% minority (17 vol% per network). a) A strut is indicated by the rectangle, while a node is indicated by a circle. b) Neighboring nodal planes are twisted by 70.53, which gives rise to the spiraling or gyrating nature of the networks. At this volume fraction minority, the length-to-diameter ratio of a strut is 3:1.
... 62
Views along different axes of a 'negative' DG crystal (air bubbles in the monocrystal) having {21 1} facets, as seen in the C120E6 / water system
(from [Sotta, 1991 #1823]). ... 63
To form a unit panel, cut along the bold lines, folding along the dotted lines such that the bolded edges of the slit touch. Eight such panels can be joined together to form the 3D DG crystal having {211} type facets; each corner touches 4 others, while each side touches 1 other. (Provided by P. Sotta and M. Weber of the Laboratoire de Physique de Solides, Universit6 Paris-Sud, Orsay Cedex, France.). ... 64 from Rancon and Charvolin, 1987. Schematic of the 3 axis of the [111], which consists of a stack of nodes from alternating networks. ... 65
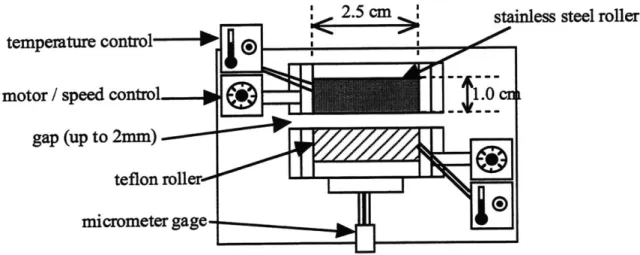
Schematic of the rollcaster. The basic parts include two motor-drivien counter-rotating rollers, one of teflon, the other of stainless steel, and a micrometer gauge to set the gap distance between rollers. ... 78
Figure 4.3: Figure 4.4: Figure 4.5: Figure 4.6: Figure 4.7: Figure 4.8: Figure 4.9: Figure 4.10: Figure 4.11: Figure 5.1: Figure 5.2: Figure 5.3: Figure 5.4: Figure 5.5:
a) Roll-casting a film from solution. The rollers counter-rotate at the same angular velocity. As the solvent evaporates, the polymer film adheres to the steel roller, as in figure 2b. b&c) Definition of the rollcast axes; x is in the flow direction, y is normal to the film, and ^z is in the plane of the film along the neutral axis. ... 79 Schematic of the mini rollcaster, with heating capabilities. The rollers are
2.5 cm long and 1 cm in diameter. ... 81
Theoretical symmetry of a roll cast film. Each face has 2mm plane 2 2 2
symmetry, giving an overall - point group symmetry. ... 83
Schematic of the roll-cast morphology of cylinders and lamellae. The roll cast cylinders lie in the plane of the roll cast film, and the roll cast lamellae lie perpendicular to the plane of the film, in the direction of the roll cast direction. ... 83
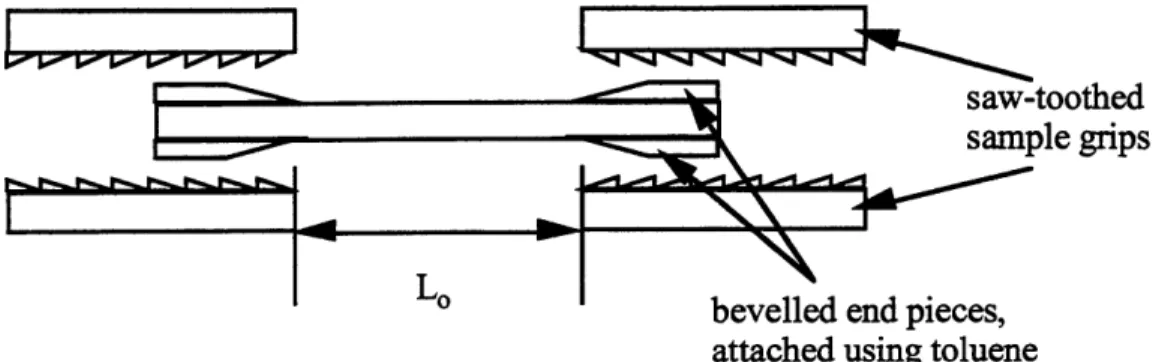
Schematic of the saw-toothed sample grips, and the sample to be stretched with the attached end pieces. L, is measured as the length between the edges of the end pieces. ... 85
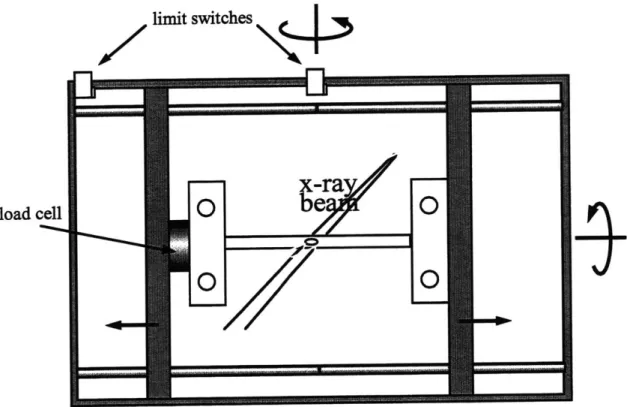
Schematic of the Mini tensile stretcher used on X12B for in-situ SAXS-deformation experiments. ... 86
(a) Samples are mounted in between grip-sandwiches, held together by (b) screws with three Belleville washers acting as springs. ... 87
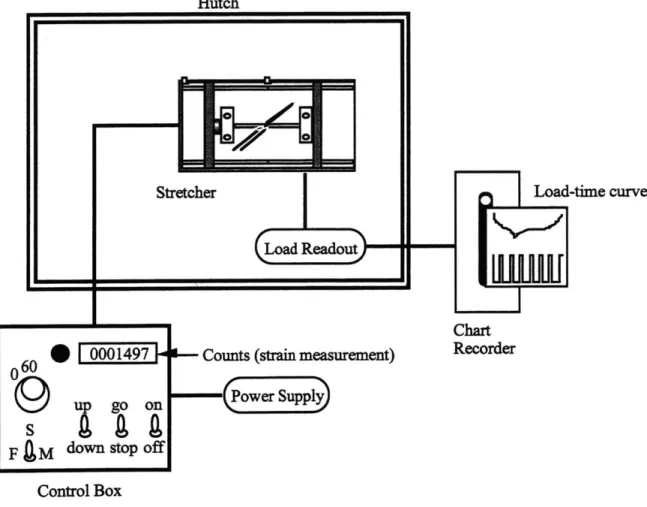
Schematic of the experimental set up at X12B, NSLS, BNL. ... 88
Schematic of the integration paths used to reduce the 2D SAXS patterns to
1D intensity vs. q plots. ... 91 SEC chromatograms of the a) 32% S SIS and b) 34% S SIS triblock
copolym ers. ... 104
Small Angle X-ray Scattering pattern of the 32%S SIS (1 1K/55K/1 1K) triblock made by Apostolos and Hadjichristidis. The observed peaks occur in ratios of 1 : f: f4: F7, indicating p6mm symmetry. ... 105 Bright-field TEM images of 32% S SIS triblock. a) An axial view of the hexagonally packed cylinders. b) A transverse view of the cylinders. ... 106 Bright-field TEM images of the 34% S SIS triblock. Grains exhibit a) 6-fold symmetry, b) 4-6-fold symmetry, and c) 2-6-fold symmetry. ... 107 Small Angle X-ray scattering pattern of the 34%S SIS (13.K/46.4/13.6) triblock indexed to the Ia3d space group. The pattern is 2-D azimuthally integrated 360*. Ln [q2*I(q)] (relative intensity) is plotted vs. q. The
black arrows indicate the the actual peaks, while the grey arrows represent theoretically allowed peaks. ... 107
Figure 5.6: Figure 5.7: Figure 5.8: Figure 5.9: Figure 5.10: Figure 5.11: Figure 5.12: Figure 5.13: Figure 5.14: Figure 5.15: Figure 5.16:
a) Bright-field TEM image of a 6-fold projection of the 34%S SIS cast from toluene. The light regions are PS and the dark regions are PI stained with OsO4. b) Optical diffraction pattern taken from the same image. c) Simulated [111] projection of the DG level surface: s.p=+/-1.0 unit cell thick. d) FFT of the simulated DG [110]projection. e) Simulated
[111 }projection of the DD level surface, PI-rich; s-p=+/-0.8; 0.25 unit cell
thick. f) FFT of the simulated D [111] projection. ... 114
a) Bright-field TEM image of a 4-fold projection of the 34%S SIS cast from toluene. The light regions are PS and the dark regions are PI stained with OsO4. b) Optical diffraction pattern taken from the same image. ... 115 a) Bright-field TEM image of a 2-fold projection of the 34%S SIS cast from toluene. The light regions are PS and the dark regions are PI stained with OsO4. b). Optical diffraction pattern taken form the same image. c) Simulated [110] projection of the DG level surface: s-p = +/- 1.0; 1.0 unit
cell thick. d) FFT of the simulated DG [110] projection. e) Simulated
[110} projection of the DD level surface, PI-rich; sp=+/- 0.8; 1.0 unit cell
thick. f) FFT of the simulated D [110] projection. g). Simulated [113] projection of the DD level surface, PI-rich; s p=+/- 0.8; 0.5 unit cell thick. h). FFT of the simulated D [113] projection. ... 116
SEC chromatogram of the 36% PS SIS triblock copolymer made by
sequential addition of monomers. ... 118
Plot of the azimuthally integrated in [q 2 * I(q)] vs. q for the 36% S
13.6/44/12 kg/mol SIS triblock. The arrows indicate the allowed reflections for the Ia3d space group. ... 119
Small angle x-ray scattering data for Dexco sample 6725-51, 39.3 weight
% S SIS polymer. The observed peaks occur in ratios of 1:2:3:4:5,
consistent with a lamellar morphology. ... 122
Bright field TEM image of Dexco sample 6725-51, 39.3 weight % S SIS polymer. The light regions are PS and the dark regions are PI. ... 122 TEM images of Dexco sample 6725-49, 35.0% S SIS. a) View characteristic of cylinder morphology - the left hand side depicts the cylinders end-on, showing the hexagonally packed rods, and the right hand side depicts the side view of the cylinders. In addition to the cylinder microdomain morphology, there exist regions exhibiting b) 6-fold symmetry, c) 4-fold symmetry, and d) 2-fold symmetry, characteristic of a cubic morphology. From experience with other polymers which show the
DG morphology, these domains are likely to be DG. ... 123 SAXS data of Dexco sample 6725-49, 35 wt% S SIS. Plot of In [q2 * (q)]
vs q, azim uthally integrated. ... 124
TEM micrographs of Dexco , 33.8 wt% S. a) hexagonal packing of PS cylinders, and b) transverse view of the cylinders. ... 125 SAXS pattern of Dexco 6725-50, 33.8% S SIS. ... 126
Figure 5.17: Figure 5.18: Figure 6.1: Figure 6.2: Figure 6.3: Figure 6.4: Figure 6.5: Figure 6.6: Figure 6.7: Figure 6.8:
XN vs. volume fraction PS for SIS triblocks synthesized by Dexco and the
Hadjichristidis group in U. of Athens. ... 127 SAXS scattering data for SIS-mineral oil blends. ... 131 2D SAXS pattern of as-roll cast 34%S SIS, taken in the through-thickness (y) direction. The roll cast direction (x) is in the vertical. The arrows
indicate diffuse off-equatorial scattering. ... 139 2D azimuthal integrations of the SAXS pattern in figure 6.1. The top
graph is a full azimuthal integration and the lower graph is a 100 integration around the equator. ... 139 2D SAXS pattern for 36 SIS, roll cast unannealed but left 5 days with
residual solvent before being dried completely under vacuum. The pattern was taken with the beam through the film (y); shown here the roll cast flow direction (x) is vertical. The arrows indicate the diffuse off-equatorial scattering. ... 140 2D azimuthal integration of the roll cast unannealed sample 36 SIS pattern
shown in figure 6.7. The top (solid) line is the full integration, and the lower (dotted) line is a 10* integration around the equator. ... 140 (reproduced from [Rangon, 1988 #1736]) SAXS pattern of a sample containing 62% C120E6 in water. The sample is monocrystalline lamellar at high temperatures and bicontinuous cubic Ia3d (DG) at low temperatures. This pattern shows scattering of the lamellar phase just above the lamellar-to-cubic transition temperature, with the lamellae perpendicular to the plane of the page. The arrows indicate the off-equatorial diffuse scattering. ... 142
a) 3-D perspective representations of lamellae (La), DG (Qa), and cylinders (Ha), and their correct orientations relative to one another. b): The bottom figure shows the planes of lamellae, DG, and cylinders in which epitaxial relations between the phases are observed. (Both figures are adapted from Rangon and Charvolin (1988). ... 145
Schematic of the mechanism for the cylinder-to-DG transition, as viewed down the cylinder axis (left) and the [111] DG axis (right), adapted from [Clerc, 1991 #1714];. The solitary cylinders in the left figure will transform into the 3 DG axes from the surrounding 6 cylinders. The 31,
32, and 3 axes are labelled in the DG figure on the right. In the
mechanism proposed by Clerc et al., each 3-fold screw axis is formed as a consequence of being connected to three 3 axes. ... 146
Schematic of cylinders transforming to DG. The transition is initiated when a 5-functional node forms, consisting of a planar trifunctional node with a cylinder running through it. The cylinder pinches off and the ends form trifunctional nodes with other cylinders, thereby propagating the transition. from M atsen (1998). ... 148
Figure 6.9: Figure 6.10: Figure 6.11: Figure 6.12: Figure 6.13: Figure 6.14: Figure 6.15: Figures 6.16: Figure 6.17: Figure 6.18: Figure 6.19:
Schematic of the model by Clerc et al. for transition of lamellae to DG, as seen from the side. The [{001 } lamellar planes transforming to the {211
}
DG planes. Viewing is along the <100> lamellar direction and the <111> DG direction. a) The lamellae planes become perforated and form
hexagonally connected rods laying in the plane of the lamellae. b) The planar hexagons now twist. c) Every second lamellae form connections up
and down to become one of the DG networks. From Clerc (1991). ... 151 a) The modulated layer (ML) phase. b) The perforated layer (PL) phase. Here, the perforated layers are packed in an ABAB arrangement. ... 152 From [Hajduk, 1998 #1779]. Schematic of the pathways for L *-+ DG
transitions. ... 157 2D SAXS pattern of roll cast annealed 36%S SIS. The q-ratios are
normalized with respect to the value of the outer peak (higher q) of the equatorial doublet. The reasons for choosing the outer peak is discussed in section 5.2.4.2.1. ... 160
The 2D SAXS pattern of roll cast annealed 34%S SIS, labelled with the q-ratios normalized to the outer peak of the equatorial doublet. ... 160
Integrated SAXS pattern of the roll cast 34%S SIS annealed 2 weeks at
120C. The ln q*I(q) vs. q azimuthal integration is taken over 200 about
the equator of figure 6.13b. ... 161 2D SAXS pattern of Dexco 4211, 30 wt%S SIS with block molecular
weights 15-72-15 kg/mol. The polymer was roll cast on the mini-roll caster with the same parameters as for all of the roll cast polymers used in this thesis and annealed at 120*C for 2 weeks. The ring along the second peak indicates that there are some grains not oriented along the roll cast direction. ... 161
a) 2D SAXS patterns of roll cast DG relative to the axes of the film. The box shows the orientations of the patterns relative to each other and to the roll cast axes. b) 2D SAXS pattern with the beam oriented through the roll cast film, with the roll cast axis along the vertical. The q values of the peaks are labelled. c) 2D SAXS pattern of a roll cast film with the beam oriented along the neutral axis. d) 2D SAXS pattern down the roll cast axis. The q values of the peaks in both patterns are labelled. ... 163 a) TEM image in the plane of a roll cast annealed 34%S SIS film. b)
SAXS pattern of a sample. c) Optical transform of the TEM image shown
in figure 6.17a. d) Fast Fourier Transform of the image in 6.17a. ... 166 In the cubic system, the indices of the plane are the same as those describing the normal to the plane. ... 168
TEMsim projections of the level set model of DG with sp = ± 1.0,
corresponding to 34% PS by volume, in the a) {10} and b) {112} projections. The solid lines delineate mirror planes, the dashed lines denote glide planes, and the bold lines outline the edges of the unit cells. The black lens-shapes indicate 2-fold rotational axes. ... 168
Figure 6.20: Figure 6.21: Figure 6.22: Figure 6.23: Figure 7.1: Figure 7.2: Figure 7.3: Figure 7.4: Figure 7.5: Figure 7.6: Figure 7.7: Figure 7.8: FIgure 7.9:
The FFTs of a) the {110} and b) the {112} projections shown in figures 6.19a and b, respectively. ... 168 2D SAXS pattern with layer lines superimposed. ... 169
a) The pattern of the
{110}
projection of the DG where <111> direction lies along the roll cast axis. b) The 1800 rotation of that in figure 6.21 a about the [111] axis, which forms with equal probability. ... 171 Scattering pattern of two { I10} planes twinned about the [111] axis with indexing of only one of the lattices indexed. The dashed black line indicates the original {110} and {001} axes of the lattice which is indexed, while the dashed grey line indicates the axes of the lattice which is not indexed. ... 172Overlayed stress-strain curves of oriented DG stretched in the [111] and transverse directions, as well as a stress-strain curve for polygranular isotropic D G . ... 177
Stress-strain curve for a isotropic sample which exhibits necking, and the values for which the yield stress and strain are reported. ... 179
Photo of a real sample undergoing necking. The gauge length of the sam ple shown is -16 mm . ... 179
Stress strain curve for a sample which does not exhibit necking, and the values for which the yield stress and strain are reported. ... 180
Schematic of a load-unload stress-strain curve. The hysteresis is found by the ratio of the areas A / (A+B). ... 181
Schematic of a stress-strain curve on the first stretch (bold line) and on a subsequent stretch (dotted line). ... 182
Stress-strain curves of isotropic DG (bold), overlayed with the classical morphologies of spheres (18% S SIS, block molecular weights 11.5 / 105 /
11.5 kg/mol, denoted "S"), cylinders (30% S, block molecular weights 14.5 / 68 / 14.5 kg/mol, denoted "C"), and lamellae (45% S SIS, block
molecular weights 18 / 44 / 18 kg/mol, denoted "L"). The polymers are commercially available from the Dexco company. a) Stress-strain behavior to 600% strain. b) Stress-strain behavior to 100% strain. The curves of the classical morphologies were kindly provided by C. C. H oneker. ... 177
Stress-strain curve of an isotropic/polygranular 34%S SIS DG (center), with accompanying SAXS patterns ... 203
An isotropic 34%S SIS DG loaded to 40% total strain capturing the necking transition (schematic shown center), with SAXS patterns of different points along the neck transition. Point A is closest to unnecked material, while point E is in the necked region where the local strain is approxim ately 300-375% . ... 204
Figure 7.10: Figure 7.11: Figure 7.12: Figure 7.13: Figure 7.14: Figure 7.15: Figure 7.16: Figure 7.17 Figure 7.18
a) Cross-sectional area view of the DG down the [111] direction. b) Perspective view of the prism of the DG phase with the hexagonal base shown in figure 7.8a. The bolded lines indicate struts which contribute to the [111] modulus, and the dashed lines indicate struts which do not. The area of the base is 4 d d . . . .. ....207 Stress-strain curve of roll cast annealed 34%S SIS DG stretched in the
[111] direction (center) with accompanying SAXS patterns along the
stress-strain curve. ... 210 A roll cast annealed 34%S SIS DG stretched in the [111] direction loaded
to 50% total strain capturing the necking transition (schematic shown center), with SAXS patterns of different points along the neck transition. Point A is closest to unnecked region, while point C is in the necked region where the local strain is approximately 200%. ... 211
TEM micrographs of the DG stretched in the [111] direction at various levels of strain. The roll cast direction as well as the [111] is along the vertical. Samples are viewed through the film (in the [110] direction). ... 213 a) (top) Imposed strain-vs-time history stress-relaxation study of the [111] direction. b) (bottom) Stress-time response to the imposed steps of strain ..215 Stress-strain curve of roll cast annealed 34%S SIS DG stretched transverse to the [111] direction (center), with accompanying SAXS patterns at different points along the stress-strain curve. ... 219
TEM micrographs of the DG stretched transverse to the flow direction at various strains. The [111] roll cast direction is along the vertical. Samples are viewed through the film (in the [110] direction). ... 222
a) TEM image of roll cast 34%S SIS DG deformed 125% transverse to the roll cast direction. b) FFT of the image in figure 7.17a. d) Main components of Fourier space chosen for inverse FFT. c) Real space components corresponding to the Fourier components shown in figure
7.17d. e) The streak components of Fourier space shown in figure 7.17a
chosen for inverse FFT. f) Real space components corresponding to the streaks in the diffraction pattern. g) The higher-intensity ends of the streaks shown in the FFT in figure 7.17a. h) Corresponding real space
components of the FFT in figure 7.17h. 223-224
a) TEM image of roll cast 34%S SIS DG deformed 125% transverse to the roll cast direction. b) FFT of the image in figure 7.18a. d) Main components of Fourier space chosen for inverse FFT. c) Real space components corresponding to the Fourier components shown in figure
7.18d. e) The streak components of Fourier space shown in figure 7.18a
chosen for inverse FFT. f) Real space components corresponding to the streaks in the diffraction pattern. g) The higher-intensity ends of the streaks shown in the FFT in figure 7.18a. h) Corresponding real space
Figure 7.19: Figure 8.1: Figure 8.2: Figure 8.3: Figure 8.4: Figure 8.5: Figure 8.6: Figure 8.7: Figure 8.8:
a) Imposed strain-time curve of the stress relaxation experiment in the transverse direction. b) Stress-time curve showing stress relaxation. ... 228
Cross-sectional area views of a) cylinders down the cylinder axes, and b)
DG down the <111> direction. The area outlined in hexagons are
analogous areas of the two morphologies. The area of the cylinder hexagon with respect to cylinder spacings is A = 6 d1l d10, and the area
of the DG hexagon with respect to DG spacings is A = 4 d22 d211 . ... 235
Prisms of the cylinder and DG phase with the hexagonal bases shown in figures 8.la and 8.lb. a) The cylinder "prism". The cylinder phase has no periodicity in the direction along the axes such that the height of the "prism" can be defined arbitrarily. b) The DG prism is 6-struts deep in the
<111> direction. The bolded lines indicate struts which contribute to the <111> modulus, and the dashed lines indicate struts which do not. Figure
4b: The DG prism is 6-struts deep in the [111] direction. The bolded lines indicate struts which contribute to the [111] modulus, and the dashed lines indicate struts which do not. ... 236 A schematic of a simple cantilever of length L, and material properties E
and I, loaded with force F at the end. The maximum deflection occurs at the end and is given by equation (8.5). ... 240 a) A beam loaded at an angle 0 from the axis of the beam. b) The forces can be resolved into the bending, axial, and shear components. ... 241 Simplified views of struts as sticks. a) A view down the [111] direction of a reinforcing helix comprised of struts angled at 350 to the [111] direction.
b) A side view of the same. The bold lines donote struts which participate
in strengthening the [111], while the dashed lines indicate struts which do not. c) Loading conditions of a typical strut. The black strut denotes the original strut, whereas the grey strut denotes the deflected strut. ... 242 a) A schematic of a strut and the applied force. The strut is angled at 35* to the <111> (force) axis such that the bending component of the force (applied normal to the strut "cantilever") is F1 = F sin 35*. The initial
length of the strut in the <111> direction is LO [111] = Lcos35*. b)A schematic of a strut and the bending deflection resulting from the force applied as in 8.6a. The component of the deflection in the <111> direction is8111 = SL sin 35*. ... 243
A sketch of the DG strut as drawn from a TEMsim DG (011) surface
projection with t = ± 1.0 (corresponding to a DG triblock with volume
fractions 17% PS -66% PI - 17% PS, for a total 34 wt% PS). The x-axis
is scaled such that the full length of the strut is L, and the y-axis is scaled such that the diameter of the center of the strut is L/3. ... 245 The r(x) (found from a trace of the TEMsim level set model) and 4th order polynomial fit for the radius of a DG strut as a function of strut length. ... 246
a) The moment of inertia I(x) is given as I (x) = 7 r (x)4, where r(x) 4 Figure 8.10: Figure 8.11: Figure 8.12: Figures 8.13 Figure 8.14:
varies with distance according to figure 8.8. The units of I scale as L4 because r(x) is scaled with respect to the length of the cantilever, L. b) The bending moment M(x) is given as M (x) = P -x . ... 247
The moment-area method provides a graphical method for finding the deflection of a linear elastic beam from a force applied at the end of the beam. The deflection is given as the area under the (M / E I) curve (shaded) and the moment arm from the centroid of the area to the point of applied load. ... 248
M/EI as a function of length along the cantilever, as plotted using values found in figures 8.9 a and b, and EpS = 3000 MPa. r(x), I(x), and hence
MIEI (x) are all scaled to units of length of the cantilever, L. ... 248
A schem atic of a strut. ... 250
a-b: A strut can be modeled as a cantilever; the nodal end anchors the strut, and any deformation due to an applied load is taken up by the thinner end. Therefore, the strut can be approximated as a cantilever beam, with the force applied at the thinner portion. ... 250
Representation of axial, bending and shear deflections. ... 253 Figure 8.9:
List of Tables
Table 2.1: Moduli of cubic metals in various directions and the anisotropy ratios ... 46 Table 4.1 a: Theoretically Allowed Reflections of Sphere, Cylinder, and Lamellar
M orphologies ... 73 Table 4. 1b: Theoretically Allowed Reflections Double Gyroid and Double Diamond
M orphologies ... 74 Table 4.2: Parameters of the runs at Xl2B ... 89
Table 5.1: Characteristics of the triblock copolymers. Molecular weights are as given from SEC/RI chromatogram s ... ... 104
Table 5.2: High Symmetry Projections of Cubic Space Groups having q2 - F. ... 109
Table 5.3: Molecular characteristics of the polymer made by sequential addition ... 118 Table 5.4: Characteristics of the polymers synthesized by Avgeropoulos of the
Hadjichristidis group at the University of Athens, Greece ... 120
Table 5.5: Dexco polymers and their characteristics ... 121
Table 5.6: Morphologies of the Different Molecular Weight SIS Triblocks with
Com position -34-35% S ... 126 Table 5.7: 18/44/18 SIS Mineral Oil Blends ... 132
Table 7.la: Mechanical Properties of the Double Gyroid (values averaged
over 5 sam ples) ... 177
Table 7.1b: Mechanical Properties of the Double Gyroid After Stretching to 600%
List of Symbols and Abbreviations
ABA ABC BCC BNL C6H6 CaH2 CdCl 3 Cl2Si(CH3) 2 CMC CT CYL dhkl DD DG DMA DMTA dn/dc FFT G G* GPC H-NMR HeNe HPL 14132 I(q) Iald Imim IMDS IPN LALLS LAM LC NL Mn MO mSImS MW n-BuLi NSLS OBDD OBS CsO4 CTgeneric triblock copolymer with the two endblocks of the same component generic triblock terpolymer with three different blocks
body centered cubic
Brookhaven National Laboratory benzene
sodium hydride cadmium chloride dichlorodimethylsilane
constant mean curvature (surface) constant thickness (surface) cylinders
interlayer spacing of the {hkl} planes double diamond
double gyroid
dynamic mechanical analysis
dynamic mechanical thermal analysis refractive index increments
fast Fourier transform
gyroid, or sometimes double gyroid (an old notation) double gyroid (old notation)
gel permeation chromatography nuclear magnetic resonance helium-neon (laser)
hexagonally perforated layers
cubic space group #214, to which the single gyroid belongs intensity as a function of the scattering vector
cubic space group #230, to which the double gyroid belongs cubic space group, to which the spheres morphology belong intermaterial dividing surface
interpenetrating network
wavelength of radiation (Chapter 4) extensional ratio (Chapter 7)
low-angle laser photometer lamellae
lamellar catenoid modulated layers
number-average molecular weight mineral oil
poly(alpha-methylstyrene) -polyisoprene -poly(alpha-methylstyrene) triblock copolymer
weight-average molecular weight n-butyl lithium
National Syncrotron Light Source at Brookhaven National Laboratory ordered bicontinuous double diamond
ordered bicontinuous structure osmium tetroxide
f- osmotic pressure
p6mm hexagonal plane group to which the cylinder morphology belongs
PB poly(1,4-butadiene)
PDI polydispersity index
PI poly(1,4-isoprene)
PL perforated layers
Pn3m cubic space group #224, to which the double diamond belongs
PS poly(styrene)
PSNa polystyrylsodium
q scattering vector
qn magnitude of the scattering vector of the nth peak
qhkI magnitude of the scattering vector of the {hkl} reflection
SAXS small angle x-ray scattering
SBS poly(styrene)-poly(l,4 butadiene)-(poly)styrene
SEC size exclusion chromatography
SIS poly(styrene)-poly(l ,4 isoprene)-(poly)styrene
TEM transmission electron microscopy
TEMsim transmission electron microscopy simulation program T9 glass transition temperature
T9Ps glass transition temperature of polystyrene, 100*C
0 half of the scattering angle
THF tetrahydrofuran
TPE thermoplastic elastomer
UV/SEC ultraviolet size exclusion chromatography
vol % volume per cent
wt % weight per cent
w/v weight per volume
X12B beamline at the National Syncrotron Light Source at Brookhaven National Laboratory
Chapter 1: Thesis Overview and Organization
1.1 Opening Remarks
I was convinced of studying mechanical properties in graduate schotil. My reasons were not so clear other than I just liked it. As an undergraduate, I was enthralled with the classes which pertained to the molecular and morphological impacts on mechanical properties, and through this, I discovered Materials Science. Perhaps first as some psychological compensation for my youth, I developed a curiosity for breaking things, which was later fueled by my senior thesis project on understanding the fracture behavior of reinforced polymer interfaces from a molecular behavior point of view.
In my search for graduate advisors, I happened to visit Prof. Thomas after he had just finished a paper reporting the discovery of the novel double gyroid microphase in block copolymers. As his mind was fresh on the double gyroid and on the novel interconnected phases, he proposed that I study "the mechanical properties of the interconnected cubic phases". Although I did not have a real understanding of either the double gyroid or the double diamond morphologies or the types of mechanical tests that would be involved, I was drawn in by the mechanicalproperties opportunity.
In the 4+ years that I have spent on the project, I have been exposed to many subjects in addition to mechanical properties, such as electron microscopy, diffraction, scattering, mathematical surfaces, phase behavior, polymer physics, thermodynamics, and kinetics, to name a few. The initial challenges were not with the mechanical properties, but rather with finding an appropriate polymer system, and then with characterizing the oriented morphology. It was only after these issues were resolved could the mechanical
and deformation behavior be interpreted in light of the morphology.
1.2 Overview
This thesis reports on the characterization and the mechanical properties of oriented or polygranular double gyroid morphologies in elastomeric block copolymer systems. In hindsight, the project can be separated into three main stages: morphological characterization of the novel phases, orientation, and mechanical properties. Materials systems were chosen to be compatible with existing industries, such that novel morphologies could provide options for improved or varied properties. Through collaborations with groups at the University of Athens, Greece and at DEXCO, a series of elastomeric triblock copolymers were obtained in composition windows appropriate for the novel morphologies. The morphologies of these polymers were then characterized, and two polymers were found to be double gyroid.
The double gyroid morphology has cubic Ia3d symmetry and hence the potential for anisotropic mechanical properties. The properties of isotropic or polycrystalline samples are superpositions of the responses of the structure to deformation along many different orientations, which complicate interpretation. By producing highly textured DG, mechanical properties along the different directions of the mechanically anisotropic DG phase could be investigated. Therefore, the polymers were oriented and textured via roll casting, a processing technique developed in the Thomas lab, in order permit sampling the anisotropic mechanical behavior. However, the oriented polymers were not obviously double gyroid and were subsequently characterized for their morphology.
Roll cast double gyroid samples were then deformed and observed via synchrotron small angle x-ray scattering and transmission electron microscopy. The high energies and high flux of synchrotron radiation allow for increased spatial and temporal resolution, respectively. The diffraction patterns could be taken in 30 seconds or less, allowing deformation to be monitored in situ as a function of strain. TEM complemented the diffraction information by providing a real space correspondence to the SAXS patterns. Samples stretched to different strains were first crosslinked to retain the stretched state, before preparing them for microscopy. The combination of SAXS and TEM information allowed models to be developed for deformation and evolution of structures up to large strains in the different directions.
1.3 Thesis Organization
Chapter 2 provides the motivation for the project, the background of block copolymer architectures and morphologies through polymer physics principles, and the justification of the chosen system. Chapter 3 gives the historical framework of gyroids, the origin of the term, and its use in the crystallography and in the mathematics community. The double gyroid is then described for insight into the geometry of this novel phase found in block copolymers. Chapter 4 details the experimental procedures used in the morphological characterization of polymers, in producing roll cast films, in mechanical testing, and in small-angle x-ray and transmission electron microscopy investigations into the deformation behavior.
Chapter 5 describes the collaborations that ensued on finding an appropriate polymer system. It discusses the characterization of the novel phases through electron microscopy, small-angle scattering, and theoretical simulations based on mathematical models of the surfaces between the two microphases. Chapter 6 discusses the morphology and indexing of the scattering patterns from roll-cast polymers that would otherwise be double gyroid if quiescently cast. Chapter 7 presents the mechanical properties and
deformation behavior of the double gyroid phase, isotropic or oriented, through mechanical testing, in situ synchrotron scattering, and electron microscopy. The behavior is interpreted in light of the morphological response of the double gyroid. Chapter 8 offers a beam-bending model to predict the [111] modulus of the double gyroid. Finally, Chapter 9 summarizes the results and conclusions and presents the future outlook and possible paths to continue the research in the various areas.
Chapter 2: Background and Motivation
This chapter provides the motivation and background for the project. First, the general issues and factors affecting mechanical behavior of composite materials are discussed. Then, block copolymer morphology and phase behavior are reviewed, followed by copolymer architecture considerations, in order to better understand the reasoning behind the choice of polymer system.
Then, the preliminary observations of the enhanced mechanical properties of the interconnected cubic phases are recounted as a historical framework behind this formal study of the mechanical properties of the double gyroid phase in elastomeric triblock copolymers.
2.1 Project Objective and Motivation
The objective of this thesis project was to conduct a formal study of the mechanical behavior of the double gyroid cubic phase in a rubbery polystyrene-polyisoprene-polystyrene (PS-PI-PS) triblock system. There were several reasons for choosing the system and the project.
First, two studies, Bi and Fetters (1976) and Alward and Thomas (1985) demonstrated enhanced mechanical performance of block copolymers with the then-unknown interconnected morphologies. These two preliminary studies provided the present impetus for embarking on a formal study of the mechanical properties of the cubic
systems.
Morphology studies in 1986 showed that cubic phases existed in AB and star-diblock copolymer systems. For mechanical robustness, at least a triblock architecture is necessary. By appropriate choice of composition, the tricontinuous cubic phase could possibly be achieved in triblock copolymers, since a triblock copolymer is architecturally intermediate between a diblock and a starblock. As an interconnected cubic phase had not yet been observed in triblock systems, a composition range over which cubic phases existed could only be estimated. In particular, diblock styrene-diene systems were found to form cubic morphologies in the range 32 - 38 wt. % styrene (Anderson and Thomas, 1988).
Glassy-rubbery triblock copolymers have already been used extensively in the thermoplastic elastomer (TPE) industry (Holden, Legge, Quirk, and Schroeder, 1996). Existing production facilities and synthesis knowledge and experience are available, with only minor shifts in the composition of the TPEs that are currently produced, materials with
an industrial standpoint as different properties would open up possibilities for new and improved applications.
2.2 Composites as Insight into Block Copolymer Properties
It is widely known that the behavior of a composite will be unlike each of its constituent phases. Several factors contribute to the behavior of the overall composite, including
-the difference in constituent properties
-the length scales of the structures compared to stress gradients
- the geometry and topology of the structures within the composite (i.e., the morphology), and
-the strength of the interface between components.
It has been of interest to the engineering community to characterize or predict the mechanical properties of such composite materials. Such efforts have resulted in
compilations of mechanical properties data and rules of mixtures.
If the two constituent phases of a composite have very different individual mechanical properties, the mechanical properties of the composite phase will have properties distinct from either of the two constituents alone. The most interesting properties arise if the composite is a mixture of constituents containing vastly different properties (e.g., one phase is conducting and the other insulating, or one phase is hard and brittle while the other is soft and ductile).
In addition to composition, the length scales of the constituent domains can be varied to give macro-, micro-, or even nano-composites. Typical engineering composites, such as concrete, are examples of macrocomposites. Here, the diameter of the steel reinforcing bars is on the order of centimeters and lengths of meters. Rock aggregates are also millimeter/centimeter composites, while sand is composed of micrometer- to millimeter- sized particles. Microcomposites, e.g., fiberglass and nanocomposites, e.g., silicate ceramic composites, have characteristic length scales on the order of micrometers and nanometers, respectively.
Accompanying the length scales is a corresponding change in surface-to-volume ratio of the different types of composites and this will affect the properties of the overall composite. Macrocomposites will have the smallest surface-to-volume ratio, while nanocomposites will have the largest surface-to-volume ratio.
Length-scale-dependent mechanicalproperties arise due to the size of the stress field relative to the size of the different materials in the composite and the characteristic dimensions of deformation structures. For example, in engineering composites such as
fiberglass, if the spacing between the fibers is small and the applied load is high such that the stress fields of the fibers overlap, then the composite will behave differently than if the fibers were far apart enough to act independently. Thus, one key question is at what length scale does the composite stop acting as a heterogeneous medium and start acting like a homogeneous material? For instance, concrete is at one extreme and normally acts as a heterogeneous composite; a miscible polymer blend, however, is at the other extreme and responds as a homogeneous material.
Often one of the components is much stiffer and stronger than the other and is designated the reinforcing component. The interfacial strength between the reinforcing component and the matrix also affects the overall mechanical behavior of the composite. If the strength of the interface is the limiting factor, then the main mode of deformation will be concerned with crack initiation and propagation along the interface. However, if the interface between components is sufficiently strong, then the deformation of the whole will concern cooperative deformation and the influence of the deformation mechanism of one phase on that of the other.
2.3 Block Copolymers as Polymer Composites
One of the most widely studied polymer composite materials are those that are formed by block copolymers, whereby two or more different polymer chains are
chemically joined together. These polymer composites typically consist of a glassy component (e.g., styrene) and a rubbery component (e.g., diene) with the purpose of combining the beneficial properties and minimizing the disadvantageous properties of both. These polystyrene-polydiene block copolymers are interesting systems for several reasons.
First, the reinforcing structures typically have a length scale on the order of 100 A . The interfacial width is a function of X(T), and is approximately 40 A for polystyrene-polyisoprene. Here, microphase separation occurs at 120 C. These factors, suggest that the polydiene phase may not act rubbery and the polystyrene phase may not act glassy when the material is deformed. Hence, the composite may exhibit mechanical properties and deformation mechanisms that are unlike the bulk component materials.
Secondly, the two components are bonded by a covalent bond every -400
A
2 along the surface separating the components. Therefore the deformation behavior of the composite is not, as is the case for many other types of composites, only limited by the delamination of the phases from one another.Thirdly, the microstructure of the composite can vary widely. Different morphologies will result depending on the relative amounts of A and B. By manipulating the composition of the minority phase and thus the morphology of the sample, the
macroscopic properties can be tailored. In particular, the properties and behavior of the sample will depend on the morphology within the sample; e.g., a rubbery matrix with glassy spheres packed in a body-centered cubic matrix will have different mechanical properties than a rubbery matrix with glassy cylinders on a hexagonal lattice.
2.3.1 Block Copolymer Physics
A block polymer is one in which each chain is composed of two or more different
polymer chains which are chemically joined together. The different components may or may not be compatible with one another. The compatibility is quantitatively embodied in X(T), the segment-segment interaction parameter, which is a function of temperature. In an A/B block copolymer system, if XAB > 0, the two components have a tendency to demix.
The higher the total number of Kuhn lengths N, i.e., the number of polymer "units" whose positions in space are uncorrelated with its adjacent neighbors, the higher the number of interactions between the two incompatible components. The enthalpy arising from these unfavorable interactions dominates over the entropy of mixing for long chains (large XN),
and the system will microphase separate as the copolymer is cooled from the high temperature homogeneously mixed state. Block copolymer systems of sufficient A(XN)
= (XN - (XN)critical) self-assemble into ordered microcomposites upon cooling from the
melt. For example, the immiscibility of the two constituents causes the A blocks to segregate away from the B blocks, so as to minimize the number of unfavorable contacts. However, because the A blocks are covalently joined to the B blocks, they cannot completely phase separate; rather, they form microdomains, which have a shape and a periodicity (Leibler, 1980), (Bates and Fredrickson, 1990). The blocks arrange themselves to form an interface between the constituent phases, called the intermaterial dividing surface
(IMDS). This interface adopts a shape that tends to minimize the contacts between the two
components, and hence minimizes its surface area to approximate constant mean curvature
(CMC) (Thomas, Anderson, Henkee, and Hoffman, 1988), (Lambert, Radzilowski, and
Thomas, 1996). However, an entropic penalty must be paid with the chains stretching away from the IMDS on both sides to preserve a constant density throughout space. The chain stretching is relieved to a certain extent by allowing the longer blocks more room relative to the shorter blocks, and hence the IMDSs adopt a curvature towards the domains containing the shorter blocks. The balance between area minimization and chain stretching results in the arrangement of the domains into a morphology, which consists of the types of domain structures formed and their packing and arrangement in space. The ratio of the block lengths and the architecture of the molecule will determine the exact shape and spacing of the IMDS .
Helfand and Wasserman (1976,1978,1980) built upon the pioneering work of Meier (1969, 1973) and of Leibler (1980) to develop the theory of microphase separation for block copolymers in the strong segregation regime (where the interface thickness, ,, is small compared to the domain periodicity, D) using mean field theory (Helfand,
1974,1975) Ohta and Kawasaki (1986) later furthered this work to develop an expression
for the free energy of a microphase-separated morphology and the equilibrium domain sizes. For example, the free energy of a lamellar morphology can be expressed as
_2a N 3kBT D2
AF = AH - TAS - D+ 2 (2.1)
p0 D 8a2 N
where a is the interfacial energy (arising from the unfavorable interactions between the two components, p0 is the number of monomer units per volume (which needs to be kept
constant throughout volume and hence causes the chain stretching), kB is the Boltzmann constant, T is temperature in Kelvin, a is the Kuhn statistical segment length, D is the domain spacing, and N is the degree of polymerization. At equilibrium,
DAF = 0
(2.2)
aD
such that the equilibrium spacing can be found as
D = 2 N2 2/3 (2.3)
3 p0
the predicted 2/3 power law. Using equations 2.1 and 2.3, the ratio of the enthalpy and entropy contributions to the free energy at equilibrium are calculated to be
AH 2 AS 1
- - and -. (2.4)
AF De 3 AFJDe. 3
Thus, at equilibrium conditions, the enthalpic interactions are twice as important as the entropic chain stretching factors, and the equilibrium morphology attempts to first reduce the number of unfavorable contacts between the components and then to increase entropy
![Figure 3.7: from (Rangon et al., 1987). Schematic of the 3 axis of the [111], which consists of a stack of nodes from alternating networks.](https://thumb-eu.123doks.com/thumbv2/123doknet/14252461.488389/65.918.186.731.134.514/figure-rangon-schematic-consists-stack-nodes-alternating-networks.webp)