HAL Id: hal-00801201
https://hal.archives-ouvertes.fr/hal-00801201
Submitted on 15 Mar 2013
HAL is a multi-disciplinary open access
archive for the deposit and dissemination of
sci-entific research documents, whether they are
pub-lished or not. The documents may come from
teaching and research institutions in France or
L’archive ouverte pluridisciplinaire HAL, est
destinée au dépôt et à la diffusion de documents
scientifiques de niveau recherche, publiés ou non,
émanant des établissements d’enseignement et de
recherche français ou étrangers, des laboratoires
Time-Frequency Signal Processing for a Self-Mixing
Laser Sensor for Vibration Measurement
Usman Zabit, Olivier Bernal, Thierry Bosch
To cite this version:
Usman Zabit, Olivier Bernal, Thierry Bosch. Time-Frequency Signal Processing for a Self-Mixing
Laser Sensor for Vibration Measurement. IEEE Sensors Conference 2012 Taipei, Oct 2012, Taipei,
Taiwan. pp.IEEE Sensors Conference, �10.1109/ICSENS.2012.6411122�. �hal-00801201�
Time-Frequency Signal Processing for a Self-Mixing
Laser Sensor for Vibration Measurement
U. Zabit, O. D. Bernal and T. Bosch
Univ de Toulouse, INP, LAAS, F-31400 Toulouse, France CNRS, LAAS, 7 avenue du Colonel Roche, F-31400 Toulouse, France
Abstract— In this paper, a novel time-frequency signal processing approach is presented for a Self-Mixing (SM) interferometric
Laser Diode (LD) sensor that enables measurement of harmonic and arbitrarily shaped vibrations. The proposed time-frequency technique ameliorates the measurement precision of a previously published time-domain based displacement retrieval technique called the Phase Unwrapping Method (PUM). By incorporating a frequency-domain analysis to the PUM, we not only improve the measurement precision but also recover information about target movement harmonics that can be used for modal analysis applications. In addition, the time-frequency processing has been found to be robust in case of variations in optical feedback coupling factor. The time-frequency technique has thus provided a precision of approx. 15nm rms (while that of PUM is approx. 40nm rms) for micrometric harmonic and arbitrarily shaped vibrations by using a SM sensor based on a LD emitting at 785nm.
I. INTRODUCTION
Self-mixing (SM) or optical feedback interferometry technique has been widely used for metrological sensing applications during the last two decades as it results in a simple, compact, self-aligned, and low-cost sensor [1].
SM effect occurs in a laser when a part of the beam backscattered by a target is coupled back into the laser cavity and causes interference with the emitted beam, thus modifying the spectral properties of the laser. The variations in the optical output power of the laser diode P(t) caused by this optical feedback can be written as [2]:
( )
t P[
m(
x( )
t)
]
P = 01+ .cos F (1) where P0 is the emitted optical power under free-running conditions, m is the modulation index and xF(t) is the laser output phase in the presence of feedback, given by:
( )
( )
( )
2 2 t t D t x F F = π λ (2)where D(t) is the target displacement.
The emission wavelength subject to feedback λF(t) is given by the phase equation [2]:
( )
( )
( )
( )
0 F sin F arctan 0
x t −x t −C x t + α =
(3)
where α is the linewidth enhancement factor and x0(t) is the laser output phase in the absence of feedback, given by:
( )
( )
2 2 0 0λ
π
Dt t x = (4)where λ0 is the emission wavelength under free running conditions. The feedback coupling factor C is given by
ext L D C γ α κ τ τ 2 1+ = (4)
where τL and τD are the round trip times in the internal and external cavities respectively, γ is the coupling efficiency and
κext depends linearly on the surface reflectivity of the target. The C parameter plays an important role in the SM interferometry as variations in C cause changes in the so called SM operating regimes [1], where each regime would require specific signal processing for the sake of displacement extraction [2]. For the present work, care has been taken to maintain the SM signal in the moderate regime with C ranging from 1 to 4 due to the fact that such a regime requires simplified SM fringe detection processing and is not affected by the fringe-loss issue [3].
A typical SM sensing set-up and a SM signal P(t) corresponding to a movement of target D(t) are presented in Fig. 1. The built-in photodiode available in the laser diode package can be used to measure the variations in the optical output power of the laser diode P(t) caused by the optical feedback. Each fringe in the SM signal represents a target displacement of λ/2. So, by using simple fringe counting, a sensor would ensure λ/2 precision by detecting all fringes [4]. However, various algorithms exist that allow even better measurement precision [5-7].
(c) 2013 IEEE. Personal use of this material is permitted. Permission from IEEE must be obtained for all other users, including reprinting/ republishing this material for advertising or promotional purposes, creating new collective works for resale or redistribution to servers or lists, or reuse of any copyrighted components of this work in other works.
Figure 1. Block diagram of a typical Self-Mixing (SM) sensing set-up requiring only a laser diode package with its built-in photodiode and a
collimating lens. A piezoelectric transducer (PZT) has been used as target. Variations in the optical output power of the laser diode P(t) are
processed to retrieve the target motion D(t).
Figure 2. Block diagram of the Phase Unwrapping Method (PUM) indicating its two principal steps [5].
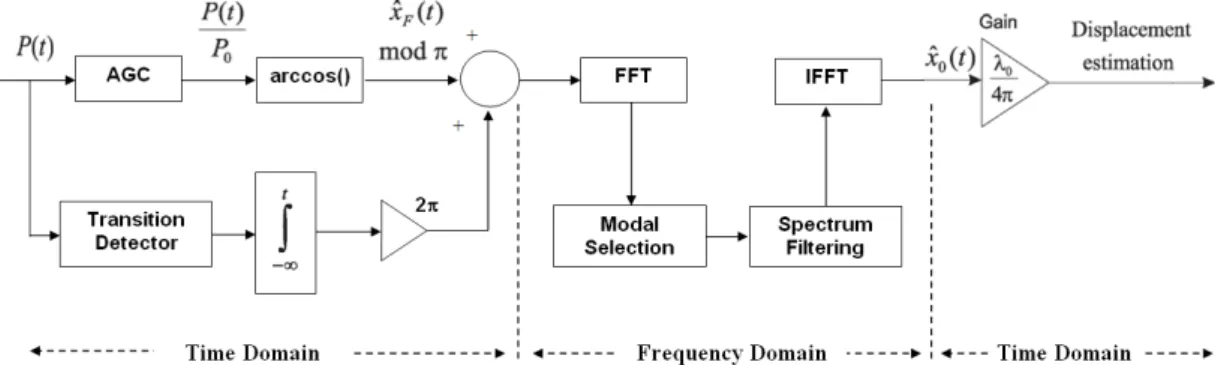
Figure 3. Block diagram of Time-Frequency signal processing of a SM interferometric sensor signal.
II. PHASE UNWRAPPING METHOD
Let us start with a brief presentation of the Phase Unwrapping Method (PUM) [5] which is summarized in the schematic block diagram of Fig. 2. It can be split up into two principal steps.
The first one leads to the rough estimation of the phase
xF(t). After an Automatic Gain Control (AGC) of P(t) to get P(t)/PO ranging over a ±1 interval, an arc-cosine function is used to get xF(t) mod π (eq. 1). The derivative of the arccos(P(t)) is then compared with a threshold value to ascertain the presence of a transition (or a fringe) through the transition detector. An integrator then adds or subtracts 2π to
xF(t), depending on the sign of the transition associated with a SM fringe. Hence, the feedback phase xF is thus roughly retrieved (The first step of PUM is then denoted as Rough PUM or RPUM for all subsequent discussion).
The second step of PUM deals with the joint estimation of parameters, C and θ=xF(t=0) + arctan(α), by applying an iterative bi-dimensional minimization routine on the phase equation (3). This then leads to an approximation of free-running laser phase x0 proportional to target motion D(t).
It is due to these two principal steps that the PUM is able to provide a target movement measurement precision of
roughly λ/16. The experimental results that would be presented at the end of the paper will attest to such a precision of the PUM.
Let us now move on to our proposed time-frequency based processing of the self-mixing signal that reutilizes the building blocks provided by the PUM. The resultant algorithm is named Modified Phase Unwrapping Method (MPUM) and is detailed in the next section.
III. MODIFIED PHASE UNWRAPPING METHOD
A closer look into the working of the two principal steps of PUM indicates that the first step (corresponding to the RPUM) is relatively easy to implement and results in a staircase shaped feedback phase signal as a result of 2π addition/subtraction. The second step of PUM, however, is more complicated to implement due to its dependence on the use of an iterative bi-dimensional minimization routine. It is finally this step that allows recovering the free-running laser phase x0 from stair-case shaped feedback phase xF.
So, keeping in mind the nature of these two principal steps of the PUM, it was decided to approach the second step of the PUM in a different manner that may allow us to avoid any iterative minimization routines while achieving at least equivalent or even better target movement measurement precision.
Figure 7. Residual difference between the reference commercial sensor and vibration retrieval using RPUM (a), PUM (b), and MPUM (c). Figure 4. RPUM (red) and MPUM (blue) for an experimental SM
signal with C=3.85.
Figure 6. Experimental SM signals with different C values corresponding to a target vibration of 5µm at 90Hz.
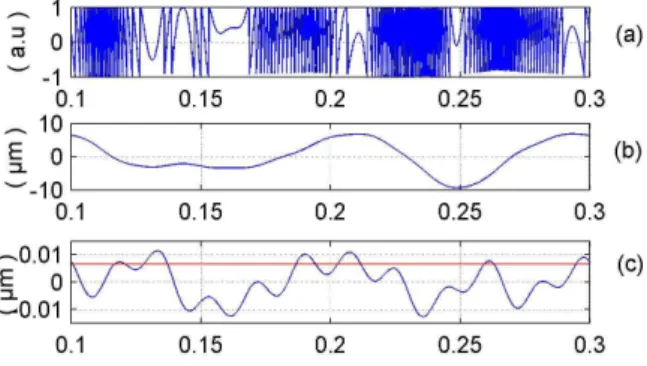
Figure 5. Simulated arbitrary movement: (a) SM signal, (b) retrieved movement, and (c) error (blue) and RMS error (red).
The block diagram of the ensuing MPUM that is based on a time domain-frequency domain signal processing of SM interferometric sensor signal is thus presented in Fig. 3.
As already mentioned, it was decided to keep the first step of PUM. This results in recovering the roughly retrieved feedback phase xF. Then, the second step is replaced with a frequency domain analysis of the roughly retrieved feedback phase xF (see Fig. 3). Thus, by using FFT (Fast Fourier Transform), the frequency components making up the target movement are analyzed. By using a threshold, those frequency components that make up the main mode of the target movement (or modes in case of non-harmonic movement of the target) can be selected. Then, the unwanted noise and harmonics contained in the frequency spectrum of xF are filtered and finally, using the Inverse FFT (IFFT) allows us to retrieve x0.
Fig. 4 shows RPUM and MPUM based signals for an experimental SM signal whose C value is estimated to be 3.85. It can be seen that the time domain-frequency domain signal processing has allowed us to recover the target movement.
Let us now present the experimental set-up used to acquire SM signals subsequently used for processing and comparison.
IV. EXPERIMENTAL SET-UP
The experimental set-up used to validate the working of
the time domain-frequency domain signal processing of SM interferometric laser sensor signals is shown in Fig. 1. The SM sensor is based on a Hitachi HL7851 laser diode package emitting at λ=785 nm with an output power of 50 mW. A commercial PZT (piezoelectric transducer) actuator from Physik Instrumente (P753.2CD) was used as target. This device has a built-in capacitive feedback sensor with 2nm resolution that was subsequently used as a reference sensor to quantify the error of our processing method.
V. RESULTS
Various simulations and experimental tests were done to validate the proposed signal processing as explained below.
A. Simulations
Firstly, different harmonic vibrations having a varying feedback coupling factor C value were simulated using [8] and then processed using the presented signal processing methods. It was thus observed that the MPUM provided better precision results as compared with the PUM for a variation in C in the range of 1 to 4.
Then, arbitrarily shaped vibration signals were also tested. Such a kind of signal is presented in Fig. 5. It was again noted
(c) 2013 IEEE. Personal use of this material is permitted. Permission from IEEE must be obtained for all other users, including reprinting/ republishing this material for advertising or promotional purposes, creating new collective works for resale or redistribution to servers or lists, or reuse of any copyrighted components of this work in other works.
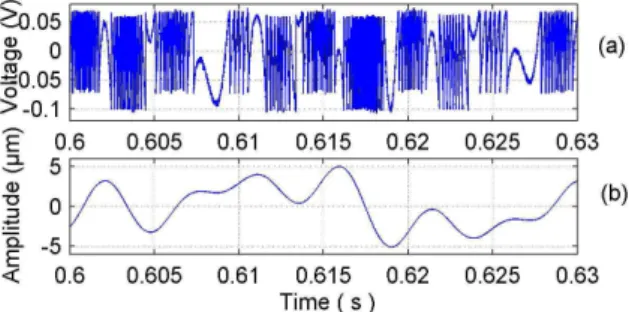
Figure 8. Experimental SM signal (a) for an arbitrary target movement and corresponding retrieval using MPUM (b). TABLE I. RMS ERROR RESULTS FOR EXPERIMENTAL SM
SIGNALS (SHOWN IN FIG.6) FOR DIFFERENT RETRIEVAL METHODS.
that the MPUM provided better precision results as compared with the PUM. The retrieved movement seen in Fig. 5 (b) presents an rms error of less than 10nm as seen in Fig. 5 (c).
B. Experimental Results
Let us now look into some of the results obtained for experimental SM signals acquired using the set-up indicated in Fig. 1.
Firstly, different experimental SM signals corresponding to a PZT vibration of 5µm at 90Hz were acquired where each of these had a different C value (see Fig. 6). The variation in the C value was achieved either by varying the sensor-to-target distance or by changing the laser spot size on the PZT (by focusing or defocusing the lens). Thus, it was possible to obtain a variation in C in the range of 1 to 4 while maintaining the same PZT movement.
Then, these different SM signals were processed by using the afore-mentioned displacement retrieval methods i.e. PUM, RPUM and MPUM. The rms error results for all of these methods were measured by comparing the retrieved displacement with the reference commercial sensor signal. These error results can be seen in Table 1. It can thus be observed that our proposed MPUM based on a time-frequency signal processing provides better results than PUM. Note that the estimation of the C value, indicated in Table 1, was achieved by using the PUM.
Fig. 7 presents the difference between the reference commercial sensor and vibration retrieval using RPUM, PUM, and MPUM for one of the afore-mentioned experimental SM signals. It can then be seen that a frequency domain processing of the RPUM allows us to obtain a signal that is even better than that of the PUM.
Finally, an experimental SM signal for an arbitrary target movement and corresponding retrieval using the MPUM are presented in Fig. 8 which shows that the MPUM is equally capable of processing non-harmonic movements.
VI. CONCLUSION
A novel time domain-frequency domain signal processing approach is presented for a Self-Mixing (SM) interferometric Laser Diode (LD) sensor which enables a better measurement of harmonic and arbitrarily shaped vibrations as compared to a previously published vibration retrieval technique, called the Phase Unwrapping Method (PUM).
The incorporation of a frequency-domain analysis to the PUM allows us to not only improve the measurement precision but also recover information about target movement harmonics that can be used for modal analysis applications. Furthermore, the time-frequency processing has been found to be robust in case of variations in the optical feedback coupling factor.
The time-frequency method has thus provided a precision of approx. 15nm rms (while that of PUM is approx. 40nm rms) for micrometric harmonic and arbitrarily shaped vibrations measured by using a self-mixing interferometric sensor based on a laser diode emitting at 785nm.
VII. ACKNOWLEDGEMENT
This research work has been funded in part by the Agence Nationale de la Recherche (ANR), France under the contract ANR-2011-EMMA-001-01.
REFERENCES
[1] S. Donati, “Developing self-mixing interferometry for instrumentation and measurements”, Laser & Photon. Rev., 6: 393417, May 2012. [2] U. Zabit, T. Bosch, and F. Bony “Adaptive transition detection
algorithm for a self-mixing displacement sensor”, IEEE Sensors Journal, vol. 9, Issue 12, pp. 1879–1886, 2009.
[3] U. Zabit, T. Bosch, F. Bony and A. D. Rakic, “A self-mixing displacement sensor with fringe-loss compensation for harmonic vibrations”, IEEE Photonics Technology Letters, vol. 22, No. 6, pp. 410–412, 2010.
[4] Ottonelli, S.; De Lucia, F.; di Vietro, M.; Dabbicco, M.; Scamarcio, G.; Mezzapesa, F.P.; , "A Compact Three Degrees-of-Freedom Motion Sensor Based on the Laser-Self-Mixing Effect," Photonics Technology Letters, IEEE , vol.20, no.16, pp.1360-1362, Aug.15, 2008.
[5] C. Bes, G. Plantier, and T. Bosch, “Displacement measurements using a self-mixing laser diode under moderate feedback”, IEEE Trans. Instr. & Measur., vol. 55, no. 4, pp. 1101–1105, 2006.
[6] Yuanlong Fan, Yanguang Yu, Jiangtao Xi, and Joe F.Chicharo, “Improving the measurement performance for a self-mixing interferometry-based displacement sensing system”, Applied Optics, Vol. 50, no 26,pp 5064-5072, Sept. 2011.
[7] M. Norgia, and A. Pesatori, “Fully analog self-mixing laser vibrometer”, Instrumentation and Measurement Technology Conference (I2MTC), 2011 IEEE , vol., no., pp.1-4, 10-12 May 2011. [8] G. Plantier, C. Bes, and T. Bosch, “Behavioral Model of a Self-Mixing
Laser Diode Sensor”, Quantum Electronics, IEEE Journal of , vol.41, no.9, pp. 1157- 1167, Sept. 2005.