Publisher’s version / Version de l'éditeur:
Manual on Moisture Control in Buildings, pp. 453-461, 1994-02
READ THESE TERMS AND CONDITIONS CAREFULLY BEFORE USING THIS WEBSITE. https://nrc-publications.canada.ca/eng/copyright
Vous avez des questions? Nous pouvons vous aider. Pour communiquer directement avec un auteur, consultez la première page de la revue dans laquelle son article a été publié afin de trouver ses coordonnées. Si vous n’arrivez pas à les repérer, communiquez avec nous à [email protected].
Questions? Contact the NRC Publications Archive team at
[email protected]. If you wish to email the authors directly, please see the first page of the publication for their contact information.
NRC Publications Archive
Archives des publications du CNRC
Access and use of this website and the material on it are subject to the Terms and Conditions set forth at
A conceptual system of moisture performance analysis
Bomberg, M. T.; Shirtliffe, C. J.
https://publications-cnrc.canada.ca/fra/droits
L’accès à ce site Web et l’utilisation de son contenu sont assujettis aux conditions présentées dans le site LISEZ CES CONDITIONS ATTENTIVEMENT AVANT D’UTILISER CE SITE WEB.
NRC Publications Record / Notice d'Archives des publications de CNRC:
https://nrc-publications.canada.ca/eng/view/object/?id=a717180a-8815-4795-9b70-4f9a68c0733e https://publications-cnrc.canada.ca/fra/voir/objet/?id=a717180a-8815-4795-9b70-4f9a68c0733e
A conceptual system of moisture
performance analysis
Bomberg, M.T.; Shirtliffe, C.J.
NRCC-37832
A version of this document is published in ASTM Manual Series, MNL-18, Philadelphia, PA. : American Society
for Testing and Materials, pp. 453-461, February-94:
The material in this document is covered by the provisions of the Copyright Act, by Canadian laws, policies, regulations and international agreements. Such provisions serve to identify the information source and, in specific instances, to prohibit reproduction of materials without written permission. For more information visit http://laws.justice.gc.ca/en/showtdm/cs/C-42
Les renseignements dans ce document sont protégés par la Loi sur le droit d’auteur, par les lois, les politiques et les règlements du Canada et des accords internationaux. Ces dispositions permettent d’identifier la source de l’information et, dans certains cas, d’interdire la copie de documents sans permission écrite. Pour obtenir de plus amples renseignements : http://lois.justice.gc.ca/fr/showtdm/cs/C-42
A Conceptual System of
Moisture Performance Analysis
26
by Mark
tセッュ「・イァ
Q@
and Cliff
J.
セイエャゥヲヲ・G@
IN A MANUAL SUCH AS THIS ONE, individual aspects of moisture
control are discussed in separate, 、ゥウ」ゥーャゥョ・セッイゥ・ョエ・、@ chap-ters, even though such a treatment of the subject matter does not allow the integration of these various aspects into a com-prehensive strategy of moisture control. Yet, there is a need for consolidating the multitude of findings ofthe research and field studies in the rapidly developing science of environmen· tal control in buildings. This chapter attempts to fill this need
by introducing a conceptual system of moisture performance analysis.
Performance of whole buildings as it depends on building components, e.g., external envelope, mechanical and electri-cal systems, and operational conditions (defined by climate and occupancy of the building), must also be related to the selection of materials forming the components of the build-ing system. In this process, the materials are selected on the basis of structural and environmental control considerations
[ 1]. Yet, while the structural design is well defined, this is not the case with the environmental control process. In the worst case, the environmental design is based on experience gained by the designer in the trial and error process.
Heat,. air, and moisture transport across a building enve-lope are inseparable phenomena. Each influences the other and is influenced by all the materials contained within the building envelope. Often we simplify the process of design by relating control of each phenomenon to a particular material or component. The thermal insulation, for example, is per-ceived to control heat transfer and the air barrier to control air leakage (Table 1 ). Likewise, the rain screen and vapor bar-rier eliminate ingress of moisture into the system.
While selected for one reason, these materials and com-ponents perform many different. and interrelated functions and frequently contribute to several of the processes that con-trol overall system performance. For instance, while concon-trol- control-ling air leakage, an air barrier system [2] may also provide effective control of moisture flow. Similarly, by increasing temperature in the wall cavity, a ·thermal insulating sheathing may also reduce the degree of condensation in the cavity
[ 3]. In the process of environmental control, the interactions between heat, air, and moisture transports must also be reviewed. And to ensure that all aspects of the building enve-lope perform effectively, we must deal with heat, air, and moisture transport collectively.
The primary function of the building envelope is to provide shelter from the outdoor environment and to enclose a
com-'Senior -research officers, Institute for Research in Construction, National Research Council of Canada, Ottawa, Canada KlA OR6.
453
fortable indoor space. To do this, the envelope needs struc-tural integrity and durability, particularly if it is to resist mois-ture damage. Of all environmental conditions, excessive moisture poses the biggest threat to integrity and durability, accounting for most of the damage in building envelopes. Many construction materials contain moisture, most notably, masonry or concrete. These materials demonstrate excellent performance characteristics as long as the moisture does not compromise the structural or physical integrity. However, excessive moisture jeopardizes both the material and its functionality.
When does a given moisture content become "excessive?" How do climate, operating conditions, and adjacent materi-als affect the wetting and drying of the materimateri-als? In designing for environmental control, professionals integrate two very different conceptual processes. One involves specific testing and analysis; the other encompasses broad qualitative assess-ments based on experience, judgment, and knowledge of what makes a building envelope function under a given set of conditions. On the analYtical side is a cqmplex array of tools, models, and data which describe the material, structural, and environmental factors relating to the building envelope. On the qualitative side is a sense of how a particular building envelope would function in that environment.
For example, a vapor barrier is typically classified at 1 perm (57 ng/m2 Pa), a unit that for wood frame housing in given
environmental conditions represents a sufficiently small flow of vapor flow. However, in calculations made for different regions of Canada using a complex model of heat, air, and moisture transport, barriers with permeance ranging from 0.1 to 10 perms could be found applicable [ 4].
So, despite the move to define vapor barriers by a precise measurements, ·the selection of the most appropriate envi-ronmental barrier involves both conceptual logic and math-ematical analysis. Designers must still conduct an overall qualitative assessment to determine whether the barrier, cho-sen for its quantitative properties, would actually function in the specific application.
In this respect, there is a growing disparity [ 5] between the selection of traditional materials for typical buildings and rapidly changing characteristics of new materials. In the absence of data on their field performance, the moisture-related data on new materials and components must be devel-oped through laboratory testing. But what information is needed? And what tests should be used to produce this ゥョヲッイセ@
mation? There being, at the present time, no established design process relating to moisture control, this chapter pos-tulates a concept of such a process, an integrated approach to
454 MANUAL ON MOISTURE CONTROL IN BUILDINGS
TABLE 1-Environmental baniers and driving forces.a
Driving Force Environmental Barrier Design Feature
Vapor pressure Vapor barrier Vapor diffusion control
Wind pressure
+
rain Pressure equalized rain (PER) screen Eliminates wind pressure difference acrossrain screen
Rain
Groundwater
Air pressures (wind loads, stack, etc.)
Air gap with weather barrier and flashings Dampproofing, gravel or crushed stone layer Air barrier (continuous airtight material and
Provides capillary break and leads water away Provides capillary break
Carries wind loads to the desired location load support)
Air pressure
+
high indoorhumidity
Air barrier Controls moisture flow via air leakage
Wind pressure difference Temperature difference High temperature,
e.g.,
fireWeather barrier with load support
Thermal insulation
Eliminates effects of windwashing Reduces the rate of heat flow
Thermal barrier, e.g., drywall Prevents rapid temperature rise on susceptible materials
aNote that in Table 1, in accordance with the Oxford American Dictionary, we use term barriers for all elements that control advance (retard) flows of heat, air, or
moisture.
the development of moisture control strategies in buildings, modeled after a well-developed process of structural design.
APPROACH
The selection of materials for use in the building envelope is done by architects and designers. This· selection is based on previous experience and the current information gathered during a number of successive design refinements, during which some aspects of the performance and the interactiOn of materials and systems are reviewed and revised accord-ingly. The knowledge gained on each application may be used in the later applications of the same system. This review of the design is informal, and its efficiency depends greatly on the experience with the particular construction system that the designer's team has. Often, when lacking experience with the particular construction system, the designer will produce a design that has not been optimized in terms of cost nor in the use of materials, especially newer materials.
A more rigorous approach is needed, where both material and system performance could be related to the specific cli-matic and service conditions that the envelope may experi-ence. This analysis should involve computer-based analysis of moisture flow, air leakage, and temperature distribution in building elements and systems. The concept of such an approach to the design of moisture control in a building enve-lope and a building environment is presented in this chapter.
In developing a comprehensive moisture performance analysis, we shall use an analogy with the process of struc-tural design, a concept introduced in the Scandinavian Mois-ture Research Program [6] and employed at Lund University
TABLE 2-Pattern of structural design.
Stage of Analysis
1. Material pre-selection 2.Loads
3. Mechanics of load transfer 4. Predicted stress-strain 5. Critical stress-strain
6. Material modification (dimensions)
Comments Previous experience Superposition, interaction Elastic regions Worst case
Safety factor, interactions Price versus property
[ 7 -9]. The structural design process, Table 2, involves the fol-lowing stages: selecting materials for the structural element, identifying the loads and mechanisms of load transfer, pre-dictfng the actual stresses and strains in the analyzed element, comparing these with the permissible levels of stress and deformation, verifying the material selection, and, when necessary, modifying the elements' dimensions. Structural design is a closed-loop process;. it starts with a material and analyzes how well this material could perform a specified function in the system. In the structural design, all the system interactions are introduced into the load factors, and the dimensioning of the structure was achieved during one stage of calculations. Neither type nor dimensions of the material are likely to be modified at the later stage of the design.
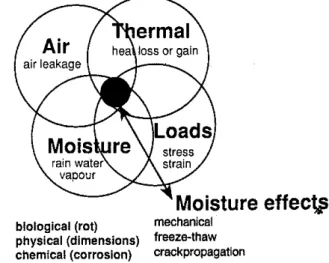
This is not the case when designing moisture controls in the building system. As shown in Fig. 1, the interactions between heat, air, and moisture transfer phenomena lead to the situa-tion where none of these design aspects may be analyzed in isolation from each other. A -change in one aspect of design must be analyzed in terms of other aspects of climatic control. For instance, an increased thermal insulation that results in a change of heat flow rate may change the likelihood of inter·
biological (rot) physical (dimensions) chemical (corrosion)
Moisture
・ヲヲ・」セ@
mechanical freeze-thaw crack propagationFIG. 1-lnteraction between heat, air, and moisture transfer phenomena.
CHAPTER 26-A CONCEPTUAL SYSTEM OF MOISTURE PERFORMANCE ANALYSIS 455
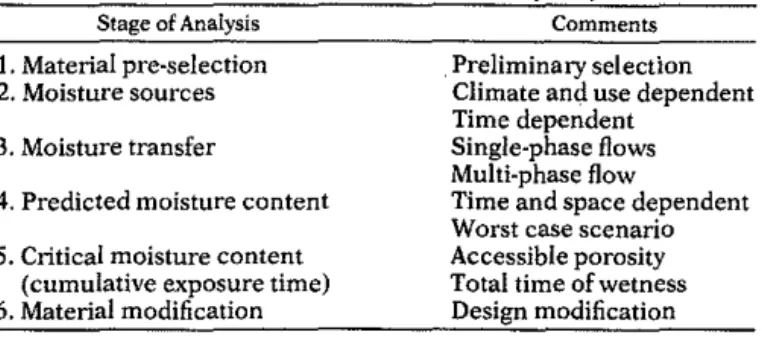
TABLE 3-Moisture performance analysis system.
Stage of Analysis
1. Material pre-selection 2. Moisture sources 3. Moisture transfer
4. Predicted moisture content 5. Critical moisture content
(cumulative exposure time) 6. Material modification
Comments
Preliminary selection Climate and use dependent Time dependent
Single-phase flows Multi-phase flow
Time and space dependent Worst case scenario Accessible porosity Total time of wetness Design modification
stitial vapor condensation, reduce drying potential of mate-rials within the structure, etc. Thus, the design of moisture control may require performing multi-stage calculations (iterative loops). Nevertheless, within each of these iterative loops the structural analogy may be applied. Table 3 shows that iterative loops were comprised of the following stages: 1. Selecting materials for initial analysis.
2. Identifying the sources of moisture.
3. Identifying the types of moisture flows and interactions between heat, air, and moisture.
4. Predicting the distribution of moisture in the analyzed ele-ment at a given time.
5. Identifying the permissible level of the selected control parameters.
6. Modifying material selection.
The structural analogy concepts and the system of petfor-mance analysis [ 1 0-15] can be combined to produce a system of moisture performance analysis.
MOISTURE PERFORMANCE ANALYSIS
The system.of moisture performance analysis requires the use of computational models to account for the effect of vari-able environmental conditions on moisture transfer through and moisture accumulation within the materials. From the distribution of moisture content in the material, as it varies with seasons of the year arid length of service, one may deter-mine if moisture content at any location exceeds the "criti-cal" level of moisture associated with possible damage. The criteria for damage, called here "the limiting performance characteristics," are determined in independent laboratory experiments. The moisture performance analysis, as shown in Table 3, comprises six stages.
In the first stage of the analysis, one makes a preliminary material selection. This selection Of material will be con-firmed or modified in the process of further analysis.
In the second stage of the analysis, one identities different sources of moisture. Some of these moisture sources depend on climatic conditions, e.g., rain or driving rain. Others depend on the service conditions and the design of the build-ing element [16]. Some of the moisture sources occur only during the construction stage, e.g., construction moisture. Yet other sources may occur in a periodic fashion, such as drying from the surface of a material previously exposed to higher humidity [ 1 7].
In the third stage of the analysis, one identifies the main mechanisms of moisture transfer and selects a model for cal-culations [1 8]. A model based on single-phase moisture flows uses well-defined material characteristics such as vapor per-meability or liquid conductivity, which, however, are difficult to measure [1 9]. A model based on multl·phase moisture flow is less elegant but uses material characteristics, such as mois-ture conductivity, that are easier to measure [20-22] (see Chapter 2).
Any model of moisture transfer must address three flows: heat, air, and moisture and their interactions. The need for simultaneous analysis of all three flows may be illustrated by a case of drying. The drying rate from the material surface is affected by many factors: temperature and moisture content at the surface, gradients oftemperature and moisture content at the surface, infrared radiation to and from the surface, and air movement and mass transfer coeffident at the surface.
In the fourth stage of this analysis, one of two performance characteristics will be applied. These characteristics are moisture content (MC) and cumulative exposure time with respect to the specified effect (CET), i.e., the sum of the peri-ods when moisture content exceeds the critical moisture con-tent with respect to a specific effect of moisture.
The first characteristic, the moisture content, relates to those phenomena in which exceeding a specific level of mois-ture content under given temperamois-ture conditions is likely to result in immediate damage; for example. freezing a material initially saturated above a critical level will result in spalling or cracking of the material.
The second characteristic, cumulad ve exposure time, relates to all phenomena where a long-term exposure is involved in the deterioration process. Ifi these cases, mois-ture may have insignificant impact on the short time basis (e.g., one or a few days); however, after many weeks, months, or years of exposure, these processes maY result in a signifi-cant damage. Yet, as' the long-term continuous exposure may have a different degree ofseverity-than a ウセイゥ・ウ@ of intermittent exposures of the same total duration, both time and exposure severity factors must be considered.
The following concept of cumulative e1<posure time (CET) is proposed. CET is a sum of the interval of time when the actual moisture content is equal to or higher than the critical moisture content times the degree of severity of this expo-sure, namely
CET
=
Sum(! · F,.) (I) where I is the interval during which the aetual moisture con-tent is equal to or higher than the critical moisture concon-tent, and Fex is the exposure severity factor .. The cumulative exposure time is ョ・・、セ、@ for a number of moisture effects such as corrosion, m()ld growth, wood decay, or effect of moisture on therma:l pffrlormance in all of which the degree of severity may vary wHh climatic condi-tions. For instance, corrosion of metals ex.posed to air occurs at different rates deperiding on temperature and humidity at the surface. The difference between the c.:...oncept of 1
'time of wetness" previously used in the durability research [23] and the "cumulative exposure time" ゥョエイッ、オ」セ、@ here is the pres-ence of the factor F ex.·
The factor Fex may vary between 0 and 1 d-epending on envi-ronmental conditions (temperature, ュッゥウセNオイ・@ content,
orrel-456 MANUAL ON MOISTURE CONTROL IN BUILDINGS
ative humidity). For instance, a corrosion process may start, say at room temperature at 90% RH, but will proceed much faster at the same temperature and 98% RH (at this humidity even a small temperature variation can cause surface con-densation that accelerates the c()rrosion process). Therefore, one could introduce a dependence of the factor Fu on relative humidity, for instance, by postulating that F u
=
0 at 90% andFex = 1 at 99.0%. The actual distribution of the Fex factor, i.e., how it changes between values ofO and 1 (linear, exponential, or stepwise) depends on the detailed knowledge of the dele-terious effect of moisture. Not much is known at the present time how severity factors depend on temperature or humidity conditions. Making approximations, such as use of a linear dependence of Fex. on humidity, appears sufficient, since as shown by Becker (15] or Kashiwagi [ 24], thereis a degree of latitude in use of weighing factors to evaluate performance of complex systems.
In the fifth stage of the analysis, the limiting levels of two performance characteristics discussed in the previous stage are identified. These limiting characteristics are termed "crit· ical," namely
I. The critical moisture content (CMC).
2. The critical cumulative exposure time (CCET).
The first concept, CMC, implies that there is a point with a par· amount significance for the analyzed effect of moisture. If the actual moisture content at any location of the material equals or exceeds the critical moisture content, CMC, there may be damage, i.e., the component rna y fail to maintain the required perlonnance level or structural integrity.
The second concept, namely the critical cumulative expo· sure time, CCET, is defined as the total exposure time (i.e., the sum of intervals "r) determined under extreme conditions.
It is equivalent to the period of reliable performance of the material (product) when the severity factor, defined in Eq I, is one. Again, if, at any point in space and time, the actual value of CET exceeds the critical value, CCET, damage is expected.
Calculating cumulative exposure time provides a mecha-nism to evaluate effects of periodic or seasonal wetting and drying on materials and systems. In the above considerations, the severity factor describes a probability of the moisture damage. When the process is characterized by an "immediate damage,'' e.g., frost damage, a narrow range of moisture con-tent brings probability of damage from a very low to a very high level (ascribed value of I for practical purposes). In case of cumulative processes such as mold, fungus growth, dimen-sional change, etc., probability of damage changes much slower with change in exposure conditions. When moisture content exceeds a critical value, the damage becomes prob-able (i.e., the severity factor becomes greater than zero). Yet, the process may take a long time before the product of time and severity factor reaches the critical value of CET.
In the sixth stage of the analysis, each of the two previously discussed performance characteristics, MC and CET, are compared with their limiting セ。ャオ・ウL@ called the critical mois-ture content, with respect to the specified effect, or the criti-cal cumulative exposure time, respectively. Comparing the predicted values of MC and CET with the critical levels (CMC
and CCET) permits the use of performance analYsis in mois-ture design.
On the level of material evaluation, these concepts assist in material selection. On the level of subsystem evaluation these concepts help to modify the design since in each 」。ウセ@ the comparison between MC and CMC, or CET and CCET becomes the basis for a decision in the design process. '
AN EXAMPLE OF LIMITING MATERIAL
PERFORMANCE CHARACTERISTICS
As previously discussed, a comparison between an actual performance characteristic' such as moisture content or cumulative exposure period with the limiting value is the key element of the moisture performance analysis. As the calcu-lation of the actual performance characteristics is discussed in many publications, notably in this manual, we deal with some of the limiting performance characteristics only.
Frost Durability
Frost durability of a material may be defined as its ability to withstand, without significant deterioration, the periods of freezing that actually occur throughout the whole period of service. This definition implies that frost durability is an envi-ronment-dependent property and that the same material may be durable under some field conditions but may be damaged under other conditions. Since the material must perform (be durable) under specific service conditions, one needs suit-able means tO examine the suitability of the material for the considered environment and to make a correct choice of material. Such means can be provided by moisture perfor-mance analysis where the moisture content of the material under actual service conditions is compared with its perfor-mance limits, i.e., CMC.
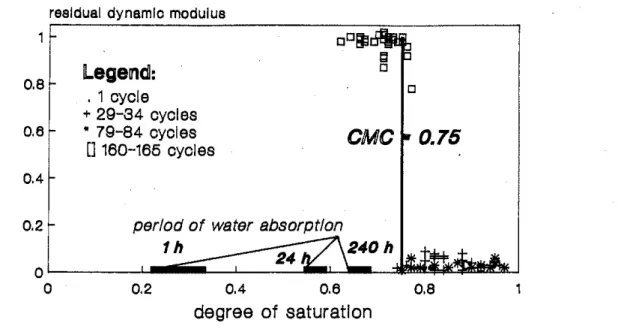
The concept of CMC with respect to freezing can be ill us· !rated by reviewing the results of tests performed by Pager-lund [ 7] on two different types of clay bricks. Two cases shown above differ. While the critical degree of saturation was not reached during 240 h of water absorption for clay bricks shown in Fig. 2, the CMC is reached during 144 h of water absorption for material shown in Fig. 3.
Frost durability is represented here by the residual dy-namic modulus, which is the dydy-namic Young's modulus divided by the modulus determined on the undisturbed spec· imen. Degree of saturation, S, is used on the other axis. The degree of saturation is the moisture content divided by the maximum that would be obtained if water has filled all the pores that are open and accessible for water ingress. The crit-ical moisture content becomes in these notations the critcrit-ical degree of saturation. The critical degree of saturation is the highest degree of saturation which may be found in a speci-men without it being damaged under freezing.
Figures 2 and 3 show the stage when freeze-tha'<W' cycling causes frost damage. The damage is characterized by a dra-matic reduction in the residual dynamic modulus. Identical results are obtained with different numbers of freeze-thaw cycles or one·step freezing (noncycling simulation). Thus, the critical degree of saturation (representing critical moisture
CHAPTER 26-A CONCEPTUAL SYSTEM OF MOISTURE PERFORMANCE ANALYSIS 457
o.e
0.6
0.4
0.2
residual dynamic modulus
legencJI:
. 1 cycle
+29-34 cycles
• 79-84 cycles
[]160-165 cycles
0.75
0.20.4
0.6
0.8
degree of saturation
FIG. 2-Residual dynamic Young's modulus In freeze-thaw testing of a well-burnt clay brick wilh density 1860 kgim' versus degree of moisture saturation.
content) is independent of the test method. This fact implies that the concept of CMC may be used as a performance cri· terion for this type of material.
When evaluating frost durability of the material, one must consider temperature of the material. Only when tempera-ture falls below the point at which pore water freezes (slightly below
ooc)
and the actual degree of saturation s。セZエ@ exceeds the critical degree of saturation, Sent• can frost damage in the material be expected (Fig. 4).In practice, one may ascribe a given threshold probability to a sub-zero temperature for a given period of the year. Any occurrence of S,c1 higher than S,r11 during this period would
become a criterion for possible frost damage.
residual dynamic modulus 1
o.e
Legend:
. 10 cycles
0.6
+26 cycles
• 104-159 cycles
0.4
The above example illustrates two stages in the process of evaluating the probability of frost damage in the material. First, one determines the critical degree of saturation (criti-cal moisture content) for freezing. Then one compares it with the actual degree of saturation predicted from the model for the specified climate. If, during the period of sub-zero tern· peratures, the actual degree of saturation exceeds the critical one, one may expect frost damage in this material.
Let us now compare the proposed evaluation of frost dura-bility with the traditional one. Traditionally, after being sub-jected to moisture ingress (absorption) under specific envi-ronmental conditiOns, the specimen is subjected to a freeze-thaw test. But the freeze-thawing part of the freeze· freeze-thaw cycle may
!•;r ••••
..
.
.
CMC
0.85
0.2
period of water absorption '4
1h
0.2
0.4
0.6
0.8
1degree of saturation
FIG. 3-Residual dynamic Young's modulus in freeze-thaw testing of an underburnt clay brick with density 1690 kgim' versus degree of moisture saturation.
·L---·-··-·---458 MANUAL ON MOISTURE CONTROL IN BUILDINGS
0
actual molatuf'fl contsnt
!
tsmperatuf'flf
lf'flezlng tsmperatuf'fl 2 4 6months
8 10 12FIG. 4-Hypothetical curves of temperature and degree of actual saturation shown to highlightcoincidence of
conditions when frost damage is likely to occur.
also be used to stimulate moisture ingress into material. Such a test comprises cycling between two exposures, thawing in water (moisture ingress) and freezing in the air, for instance, ASTM Standard Test Method for Resistance of Concrete to Rapid Freezing and Thawing (C 666-90). In some cases,
nota-bly concrete, the degree of material saturation with moisture
may increase with the duration of freeze-thaw cycling causing
damage after a sufficiently large number of cycles. In other cases, the same conditions of freezing and thawing may not increase the degree. of saturation at all. If the degree of satu· ration does not increase during the freeze-thaw cycling, one does not know whether this depends on a poor selection of the freeze-thaw conditions (conditions used for testing con-crete may not be suitable for testing other materials) or on the nature of the tested material.
In addition to the critical degree of saturation defined by the means of residual dynamic modulus, Figs. 2 and 3 show results of isothermal water intake as a function of time (these clay bricks were immersed in water for different periods, e.g., I, 24, 144, or 240 h). The short, thick line sections shown at the horizontal axis セ・ーイ・ウ・ョエ@ the degree of saturation attained during the water immersion test performed on several spec-imens. The degree of saturation for both types of clay bricks,
Sact• increases with time of immersion.
What would be the outcome of a freezing test applied to these two clay bricks after they were immersed in water for a selected period, for instance 24 and 144 h. In the first case, both types of the clay bricks would be declared "frost dura-ble"; in the second case (144 h of water absorption prior to the freeze-thaw test), the clay bricks shown in Fig. 2 would be thought "durable," but those in Fig. 3 would not. Would this
mean that the clay bricks shown in Fig. 2 are durable under field conditions?
Actual moisture content depends on a balance between wetting and drying of the material in the building envelope and cannot be approximated by an arbitrary procedure such as a day or even a week-long immersion in water. While the worst-case scenario could be approximated by such a proce-dure, it requires, however, a check if the moisture accumu-lation under different conditions of wetting (e.g., condensa-tion of thermally driven vapor) would exceed that obtained under water immersion, see Born berg [25].
MOISTURE PERFORMANCE EVALUATION
AND THE DESIGN PROCESS
Heat losses or gains, air leakage, and moisture transfer are influenced by the characteristics of all materials contained within the building element. Material selection must there-fore be among the considerations given to the whole system. It implies that the moisture performance analysis must be performed as several iterations on different levels of con-struction hierarchy. (The concept of hierarchy was intro-duced in the performance analysis [1 0] to link different levels of consideration starting from the micro-structures and going through materials, products, and elements up to the con-struction systems.)
Is this iterative process of moisture performance evalua-tion compatible with a typical architectural design proce-dure? The answer is yes-both processes are very similar. The moment an architect, intentionally or not, starts to modify a "proven" design, the success of the final design is largely dependent on the type of questions that members of the design team raise and the answers they receive. In discussing design procedure, Strelka [ 26] stated that: "It also requires a willingness to change not only minor details, but the basic design itself, if the feedback information indicates that this is desirable. To do this necessitates that the design be kept as flexible as possible until the consequences of any design pro-posal are fully reviewed."
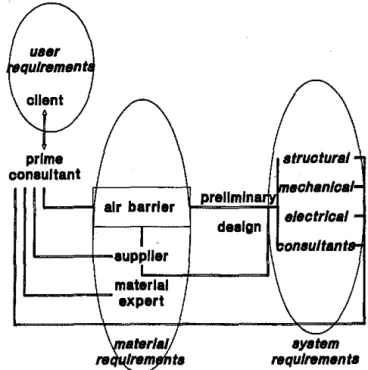
To compare the architectural design process with that of moisture performance analysis, we review the design of an air barrier in the exterior wall. In this example, as discussed by Strelka [26], the information flow starts with a search for suit-able materials. Typical questions that are asked about air bar-rier materials are about their ability to be extended, about pli-ability, adhesion, means of attachment, connection, support, aging (change of material characteristics with time), weath-ering, and repairs. After developing an initial design, the designer addresses all intersections and joints between 「オゥャ、セ@
ing elements (foundation-wall, floor, roof, wall-wall, wall-windows, and doors). To expect satisfactory ー・イャッイセ@
mance in these details, the designer must continue to ask questions on the performance of the whole system: What rate of air leakage is permitted? Does the leakage occur
it.
one place? How imperative is energy control? How critical is risk of drafts? Several iterations in design may be required until the answers to all these questions indicate that the designed element will have a satisfactory performance.CHAPTER 26-A CONCEPTUAL SYSTEM OF MOISTURE PERFORMANCE ANALYSIS 459 prime consultant
L----f
air barrier L---1-auppller L..----+-materlal expert prellmlna design system ftlqulrementaFIG. 5-Fiow of information during design of air barrier (see text). selection is completed the designer performs an analysis ofits performance. Such analysis continues, and the next ゥョヲッイセ@
mation loop includes the review of preliminary design with the structural, electrical, and mechanical consultants (Fig.
5).
design
case studies damage
The primary consultant must then review buildability aspects such as material installation under different weather conditions, degree of needed labor skills, and construction tolerances. This review must also address the long·term per· formance under service conditions: aging of the mater1.als, stress and deformations during service, projected cost of repairs, and maintenance. At any stage, the design may have to be modified, a new material selected, and the process repeated.
As shown in the above example, the designer or the prime consultant is always performing a sort of performance eval-uation. So, how is this analysis affectiilg the design process?
Application of moisture performance analysis introduces two new aspects:
I. It becomes a formal and recognized part of the design considerations.
2. It introduces a framework of organized procedures enforc-ing a review of specific performance aspects and replacenforc-ing ad hoc questions or assumptions.
Figure 6 illustrates the interactive character of the design pro-cess performed stepwise in a number of iterative loops.
As the professional judgment involves experience gained when evaluating the field performance of similar construc-tion systems, the evaluaconstruc-tion process comprises the review of field performance of similar systems (combined with review of architectural details in the proposed system and assess-ment of their buildability). the review of laboratory tests on materials, or mock-up tests on components as well as
predic-material
selection
design
selection
performance evaluation :
review of arch. details
mock-up testing _
commissioning tests
computer models
FIG. &-Evaluation of performance on the level of building element and system.
CHAPTER 26-A CONCEPTUAL SYSTEM OF MOISTURE PERFORMANCE ANALYSIS 461
sured Results," Thermal Performance of the Exterior Envelopes
of Buildings IV, Orlando, FL, ASHRAE, Atlanta, GA, 1989. [20] Kohonen, R., "Transient Analysis of the Thermal and Moisture
Physical Behaviour of Building Constructions," Building and Environment, Vol. 19, No.1, 1984, pp. 1-14.
[21] Kerestecioglu,A., Swami, M., Fairey, P., Gu, L., and Chandra, S., "Modeling Heat, Moisture and Contaminant Transport in ings: Toward a New Generation Software," Proceedings, Build-ing Simulation '89, Vancouver, BC, International BuildBuild-ing Per-formance Simulation Association, Sacramento, CA, 1989, pp. 333-340.
[22] Ojanen, T. and Kumaran, M. K., "Air Exfiltration and Moisture
Accumulation in Residential Wall Cavities," Thermal p・イOッイセ@
rnance of the Exterior Envelope of Buildings V, BTECC/DOE/
ASHRAE, 1992.
(23] Sereda, P. J., Croll, S. G., and Slade, H. F., "Measurement of the
Time-of-Wetness by Moisture Sensors and Their Calibration," Atmosphere Corrosion of Metals, ASTM STP 767, ASTM, Phila·
delphia, 1982,p.413.
[24] Kashiwagi, D. T. and Moor, W. C., "The Relationship Between
Energy Cost and Conservation Measures, Building Design, and Insulation Levels," Journal of Thermal Insulation and Building
Envelopes, April1993, pp. 375-394.
[25] Bamberg, M., "Laboratory Methods for Determining Moisture Absorption of Thermal Insulations, 1: Review," Journal of Ther·
mal Insulation, Vol. 6, ApJ;il 1983, pp. 232-249.
[26] Strelka, C. S., "Some Thoughts on Design Procedure," Draft 4, unpublished manuscript, IRC/NRC, 1985.