HAL Id: inserm-02908725
https://www.hal.inserm.fr/inserm-02908725
Submitted on 29 Jul 2020
HAL is a multi-disciplinary open access archive for the deposit and dissemination of sci-entific research documents, whether they are pub-lished or not. The documents may come from teaching and research institutions in France or abroad, or from public or private research centers.
L’archive ouverte pluridisciplinaire HAL, est destinée au dépôt et à la diffusion de documents scientifiques de niveau recherche, publiés ou non, émanant des établissements d’enseignement et de recherche français ou étrangers, des laboratoires publics ou privés.
Paradoxical activation of AMPK by glucose drives
selective EP300 activity in colorectal cancer
María Gutiérrez-Salmerón, José Manuel García-Martínez, Javier
Martínez-Useros, María Jesús Fernández-Aceñero, Benoit Viollet, Séverine
Olivier, Jagat Chauhan, Silvia Lucena, Antonio de la Vieja, Colin Goding, et
al.
To cite this version:
María Gutiérrez-Salmerón, José Manuel García-Martínez, Javier Martínez-Useros, María Jesús Fernández-Aceñero, Benoit Viollet, et al.. Paradoxical activation of AMPK by glucose drives se-lective EP300 activity in colorectal cancer. PLoS Biology, Public Library of Science, 2020, 18 (6), pp.e3000732. �10.1371/journal.pbio.3000732�. �inserm-02908725�
RESEARCH ARTICLE
Paradoxical activation of AMPK by glucose
drives selective EP300 activity in colorectal
cancer
Marı´a Gutie´rrez-Salmero´ nID1☯, Jose´ Manuel Garcı´a-Martı´nezID1☯, Javier Martı´nez-Useros2, Marı´a Jesu´ s Ferna´ndez-Aceñero3, Benoit ViolletID4, Severine OlivierID4, Jagat Chauhan5, Silvia R. LucenaID1, Antonio De la ViejaID6, Colin R. GodingID5, Ana Chocarro-CalvoID1,5*, Custodia Garcı´a-Jime´nezID1*
1 Area of Physiology, Faculty of Health Sciences, University Rey Juan Carlos, Alcorco´n, Madrid, Spain, 2 Translational Oncology Division, OncoHealth Institute, Health Research Institute-University Hospital Fundacio´ n Jime´nez Diaz-UAM, Madrid, Spain, 3 Department of Surgical Pathology, Hospital Gregorio Marañon, Madrid, Spain, 4 Universite´ de Paris, Institut Cochin, CNRS, INSERM, Paris, France, 5 Ludwig Institute for Cancer Research, Nuffield Department of Medicine, University of Oxford, Oxford, United Kingdom, 6 Unidad de Tumores Endocrinos (UFIEC), Instituto de Salud Carlos III and CiberOnc, Majadahonda, Madrid, Spain
☯These authors contributed equally to this work.
*[email protected](ACC);[email protected](CGJ)
Abstract
Coordination of gene expression with nutrient availability supports proliferation and homeo-stasis and is shaped by protein acetylation. Yet how physiological/pathological signals link acetylation to specific gene expression programs and whether such responses are cell-type–specific is unclear. AMP-activated protein kinase (AMPK) is a key energy sensor, acti-vated by glucose limitation to resolve nutrient supply–demand imbalances, critical for diabe-tes and cancer. Unexpectedly, we show here that, in gastroindiabe-testinal cancer cells, glucose activates AMPK to selectively induce EP300, but not CREB-binding protein (CBP). Conse-quently, EP300 is redirected away from nuclear receptors that promote differentiation towardsβ-catenin, a driver of proliferation and colorectal tumorigenesis. Importantly, block-ing glycogen synthesis permits reactive oxygen species (ROS) accumulation and AMPK activation in response to glucose in previously nonresponsive cells. Notably, glycogen con-tent and activity of the ROS/AMPK/EP300/β-catenin axis are opposite in healthy versus tumor sections. Glycogen content reduction from healthy to tumor tissue may explain AMPK switching from tumor suppressor to activator during tumor evolution.
Introduction
Coordination of gene expression programs that drive proliferation and differentiation is essen-tial to maintain homeostasis and for development. Understanding how the availability of nutrients needed for macromolecule synthesis is coordinated with gene expression reprogram-ming is a key issue. Recent insights have revealed a key integrating role for the evolutionarily
a1111111111 a1111111111 a1111111111 a1111111111 a1111111111 OPEN ACCESS
Citation: Gutie´rrez-Salmero´n M, Garcı´a-Martı´nez
JM, Martı´nez-Useros J, Ferna´ndez-Aceñero MJ, Viollet B, Olivier S, et al. (2020) Paradoxical activation of AMPK by glucose drives selective EP300 activity in colorectal cancer. PLoS Biol 18 (6): e3000732.https://doi.org/10.1371/journal. pbio.3000732
Academic Editor: Jason W. Locasale, Duke
University, UNITED STATES
Received: February 17, 2020 Accepted: May 27, 2020 Published: June 30, 2020
Copyright:© 2020 Gutie´rrez-Salmero´n et al. This is an open access article distributed under the terms of theCreative Commons Attribution License, which permits unrestricted use, distribution, and reproduction in any medium, provided the original author and source are credited.
Data Availability Statement: All relevant data are
within the paper and its Supporting Information files.
Funding: The financial support of the Spanish
government (Grant Numbers: AEI, Mineco/FEDER SAF2016-79837-R and PID2019-110998RB-100 to CG-J and MICIU/FEDER: RTI2018-099343-B-100 to AV)(http://www.ciencia.gob.es/portal/site/ MICINN/aei) is gratefully acknowledged. A.C-C. was supported by a European Union Marie Curie
conserved lysine acetyl-transferases EP300 and the highly related CREB-binding protein (CBP), which target histone and nonhistone proteins to modify their interactions and/or activ-ities [1]. Best known as co-factors for a wide range of transcription factors—including nuclear receptors,β-catenin, Smad, or p53—EP300 and CBP share most targets, and as functional dif-ferences remain unclear, they are often referred to as EP300/CBP. In addition to acting as tran-scription co-factors, EP300/CBP have also been implicated in DNA damage repair and control of proliferation [2], with increasing evidence suggesting a role in regulating metabolism [3–5] and autophagy [6,7]. Given the broad repertoire of interactors and the limited pools of EP300/ CBP, it has been suggested that there may be competition for EP300/CBP [1], raising the possi-bility that environmental cues signal to direct EP300/CBP interactions towards specific path-ways. For example, recruitment of EP300/CBP to the cAMP-response element binding protein CREB is enhanced by CREB phosphorylation in response to elevated cAMP [8] or intracellular calcium [9]. Alternatively, direct post-translational modification (PTM) of EP300/CBP itself may regulate its activity or association with specific interactors.
Several intra- and extracellular inputs modulate EP300/CBP activity, with PTMs such as methylation, ubiquitination, sumoylation, or phosphorylation [10] altering protein stability, interactions, and ultimately function [11]. Most notable are phosphorylation events within the C-terminal (Carboxy terminus [Ct]) region that relieve inhibition of the acetyl-transferase domain through a conformational switch [7]. EP300 can be phosphorylated within the Ct by AKT [12] and the mitogen-activated protein kinase (MAPK) extracellular signal-regulated kinase (ERK) [10] downstream from pro-proliferative receptor tyrosine kinases as well as by mammalian Target Of Rapamycin Complex 1 (mTORC1) [7], which is in turn activated by amino acids needed for proliferation. In-trans auto-acetylation of EP300 was suggested to yield increased acetyl-transferase activity that may enhance its stability [13,14]. In addition to the Ct regulatory inputs, the amino terminus (Nt) of EP300 is also modified at S89 by protein kinase C (PKC) or AMP-activated protein kinase (AMPK), a key cellular sensor that controls the balance between catabolism and anabolism. AMPK-mediated phosphorylation of EP300 prevents its interaction with nuclear hormone receptors [15]. Since AMPK is generally acti-vated in response to reduced glucose availability or by increased AMP:ATP or ADP:ATP ratio [16,17], AMPK-driven inhibition of EP300/nuclear receptor interaction provides a means to coordinate its activity with the supply of energy. However, it is unclear whether the response to changing glucose levels is specific to EP300 or CBP, whether it may affect gene expression programs independent of nuclear receptors, or whether the AMPK response differs between cell types. Especially relevant would be differences between cells that have physiological roles in glucose sensing and cells that exhibit metabolic pathologies such as cancer cells.
Given the critical importance of EP300/CBP for gene expression, understanding their regu-lation by the metabolic context during tumor evolution is a key issue. Here we explore the response of EP300 to changing glucose levels in gastrointestinal cancer cells. We show in vitro, in vivo, and in human clinical samples that, in contrast to expectation, exposure to glucose in colon cancer cells triggers AMPK activation that increases EP300 levels and redirects EP300 away from nuclear hormone receptors towardsβ-catenin, a key driver of colorectal cancer pro-liferation. By contrast, in healthy colon or other cancer cell types, glycogen storage blocks the ability of glucose to activate the reactive oxygen species (ROS)/AMPK/EP300/β-catenin axis.
Results
Cell-type–specific activation of EP300 but not CBP by glucose
Glucose uptake can fuel glycolysis to generate acetyl-CoA, a key co-factor for the EP300/CBP acetyl transferase [18,19] that should be important for several pathologies, including diabetes
PLOS BIOLOGY Glucose-mediated induction of EP300/ß-catenin by AMPK
FP7-PEOPLE-2013-IEF (PIEF-GA-2013-626098), EMBO Postdoctoral Long-Term Fellowship (ALTF 800–2013) and by Comunidad de Madrid: Ayudas Atraccio´n de Talento (2017-T1/BMD-5334); (https://gestiona3.madrid.org/quadrivium/ convocatorias/home/talento). SR.L. was supported by Comunidad de Madrid/FEDER- PEJD-2017-POST/BMD-3906. (https://gestiona3.madrid.org/ quadrivium/convocatorias/) J.C. and C.R.G. were supported by the Ludwig Institute for Cancer Research (https://www.ludwig.ox.ac.uk/). B.V. was funded by INSERM, CNRS, Universite´ Paris Descartes (http://www.idf.inserm.fr/) and SFD (Socie´te´ Francophone du Diabète:https://www. sfdiabete.org/) and S.O. by the Re´gion Ile-de-France. The funders had no role in study design, data collection and analysis, decision to publish, or preparation of the manuscript.
Competing interests: The authors have declared
that no competing interests exist.
Abbreviations: 8-OHdG,
8-hydroxy-2’-deoxyguanosine; 2-DG, 2-deoxy-glucose; A76, AMPK inducer A-769662; Ace-Lys, acetyl-lysine; ACC1, Acetyl-Coenzyme A Carboxilase 1; AICAR, 5-aminoimidazole-4-carboxamide ribonucleotide; AKT, Serine-Threonine Kinase AKT or PKB; AMPK, AMP-activated protein kinase; AOM,
azoxymethane; ATM, Serine-protein kinase ATM (Ataxia telangiectasia mutated); Bro,
Bromodomain; CBP, CREB-binding protein; CE, cytoplasmic extract; CGDS-R, R-Based package for accessing the Cancer Genomics Data Server; CHX, cycloheximide; CoQ10, Coenzyme Q10; CREB, Cyclic-AMP-Response Element Binding protein; Ct, Carboxy terminus; DCF-DA,
2’7’-dichlorodihydrofluorescein diacetate; DSS, Dextran Sodium Sulfate; EP300, Histone acetyltransferase p300; ERK, extracellular signal-regulated kinase 1; FBP, fructose-1,6-bisphosphate; FT, flow through; GAPDH, Glyceraldehyde 3-phosphate
dehydrogenase; GSEA, Gene Set Enrichment Analysis; GSK3β, glycogen synthase kinase 3β; GYS2, Glycogen Synthase 2; H3K9, Histone H3 Lysine 9; IRB, Institutional Review Board; KAT, lysine acetyl transferase catalytic center; KIX, Nuclear receptor and CREB interacting domains; KO, knockout; MAPK, mitogen-activated protein kinase; MSigDB, Molecular Signatures Database; mTORC1, mammalian Target Of Rapamycin Complex 1; P38, Mitogen-activated protein kinase P38; PAS, Periodic Acid-Schiff; PAS-D, Periodic Acid-Schiff with alpha amylase; PCAF, P300/CBP-associated factor; PhD, PhD finger; PKC, protein kinase C; PPARγ, Peroxisome Proliferator-Activated Receptor gamma; PTM, post translational modification; qRT-PCR, quantitative
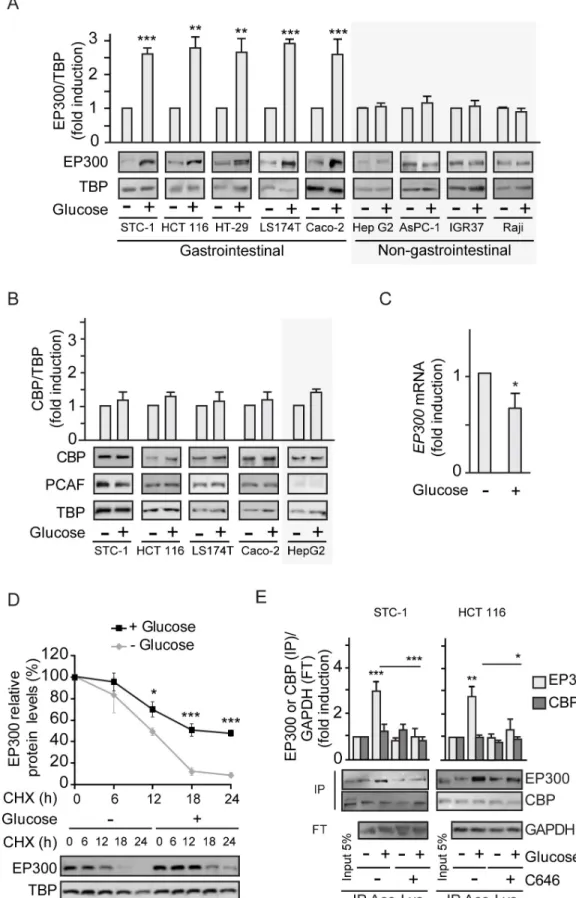
and cancer [1]. Addition of glucose to gastrointestinal murine (STC-1) or human (HCT 116) cancer cells previously starved of glucose for 36 h leads to significantly increased cytoplasmic and nuclear EP300 levels as detected by western blotting (S1A Fig) and immunofluorescence (S1B Fig); note that EP300 major fraction is nuclear. Remarkably, glucose-mediated induction of EP300 levels is restricted to gastrointestinal cancer cells (Fig 1A) with no effects in cancer cells from associated organs like pancreas AsPC-1 or liver Hep G2, or unrelated human cancer cells like IGR37 melanoma or Raji B-cell lymphoma. Surprisingly, despite the high homology of EP300 and CBP and the lack of identified stimuli that discriminate between them, exposure to glucose selectively increased EP300, as shown inFig 1AandS1A and S1B Fig, without alter-ing the levels of CBP or the associated acetyltransferase P300/CBP-associated factor (PCAF) (Fig 1B).
Although we anticipated elevated EP300 levels in response to glucose to be mediated by increased EP300 transcription, as reported for human endothelial umbilical vein cells (HUVEC) [3], unexpectedly, EP300 mRNA levels were moderately decreased in response to glucose (Fig 1C), indicating that glucose might increase EP300 protein stability. Indeed, inhibi-tion of protein synthesis by cycloheximide (CHX) revealed augmented EP300 protein stability in HCT 116 colon cancer cells exposed to glucose (Fig 1D), likely triggered by PTMs.
Since auto-acetylation of EP300/CBP in trans enhances its catalytic activity [13,14,20], EP300 acetylation status in response to glucose addition was examined by immunoprecipita-tion of cell extracts using an anti-acetyl lysine antibody followed by western blotting. The results revealed increased levels of acetylated EP300, but not acetylated CBP, following stimu-lation of STC-1 and HCT 116 cells with glucose (Fig 1E), with acetylation of EP300 being blocked using the selective EP300 inhibitor C646 [21]. Acetylation of H3K9, a specific target of EP300 but not of CBP [22,23], was also increased by glucose exposure and was prevented by C646 (S1C Fig).
Collectively, the results indicate that in gastrointestinal, but not in multiple other cancer cell types, glucose levels selectively increase EP300 but not CBP. The data suggest that addi-tional high-glucose–induced PTMs in EP300 may mediate its pro-proliferative effects on colon cancer cells.
Selective induction of EP300 by high glucose correlates with cell-type–
specific AMPK activation
We reasoned that differential interactions and enhanced acetylation of EP300 molecules in response to glucose may rely on additional PTMs and initially explored the possibility that glu-cose would regulate one of the several kinases known to phosphorylate EP300 (Fig 2A). Using H2O2as a positive control known to induce ERK, p38, AKT [24,25], and AMPK [26], glucose
only activated AMPK among these kinases (S2A Fig). We therefore focused our attention on AMPK, a kinase that we anticipated would be inhibited by glucose addition. To our surprise, time course experiments in gastrointestinal cancer cells revealed that glucose induced a signifi-cant activation of AMPK, as detected by the activating phosphorylation on T172, as well as increased phosphorylation of the canonical AMPK substrate Acetyl-Coenzyme A Carboxilase 1 (ACC1) on S79 (Fig 2B). Most notably, like EP300, AMPK was induced by glucose in the panel of gastrointestinal cancer cell lines, but not in hepatocellular carcinoma Hep G2 cells (Fig 2C). Importantly, phosphorylation at the EP300 consensus AMPK site (S89) correlated with increased EP300 protein levels in gastrointestinal cancer cells but not in Hep G2 liver can-cer cells (Fig 2D).
Elevated EP300 levels by glucose may generally increase EP300-substrate interactions, lead-ing to increased acetylation of EP300 substrates: EP300 itself and H3K9, as shown inFig 1E Reverse Transcription Polymerase Chain Reaction;
RAR, All-trans Retinoic Acid Receptor; ROS, reactive oxygen species; RSEM, RNA Sequencing by Expectation Maximization; RXR, 9-cis Retinoic Acid Receptor; SC, Scramble Control; siRNA, small interfering RNA; TBP, TATA-box-Binding Protein; TCGA, The Cancer Genome Atlas; TMA, tissue microarray; TR, Thyroid Hormone Receptor; VDR, Vitamin D Receptor; WT, wild type.
Fig 1. Glucose selectively increases EP300 in a cell-type–specific manner in gastrointestinal cancer cells. See related results inS1 FigHCT 116 or the indicated cells were starved of glucose for 36 h (−) before addition of glucose 25 mM for 24
andS1C Fig. However, since phosphorylation of EP300 (S89) by AMPK was previously reported to decrease EP300/Peroxisome Proliferator-Activated Receptor gamma (PPARγ) interactions in BHK cells [15], co-immunoprecipitations with anti-EP300 antibodies were used to evaluate EP300 interactions. EP300/PPARγ interactions, examined as a control, were down-regulated also in gastrointestinal cancer cells (Fig 2E). Likewise, EP300 interactions with the nuclear receptor for vitamin D (VDR), associated with colon differentiation, were also decreased, extending previous findings. Surprisingly, by contrast, the interactions of EP300 with the pro-proliferative factorβ-catenin, the effector of Wnt signaling critical for colon tumorigenesis, were remarkably increased. Furthermore, glucose induction of EP300/β-cate-nin interaction correlated with activation ofβ-catenin target genes critical for proliferation such asCCND1 (cyclin D) and MYC as revealed by quantitative Reverse Transcription
Poly-merase Chain Reaction (qRT-PCR) (Fig 2F).
In sum, the results indicate that glucose promotes a selective switch in EP300 to favor pro-liferation-related EP300/β-catenin interactions and suppresses differentiation-related EP300/ VDR interactions.
Cell-type–specific induction of EP300 by glucose relies on AMPK
activation
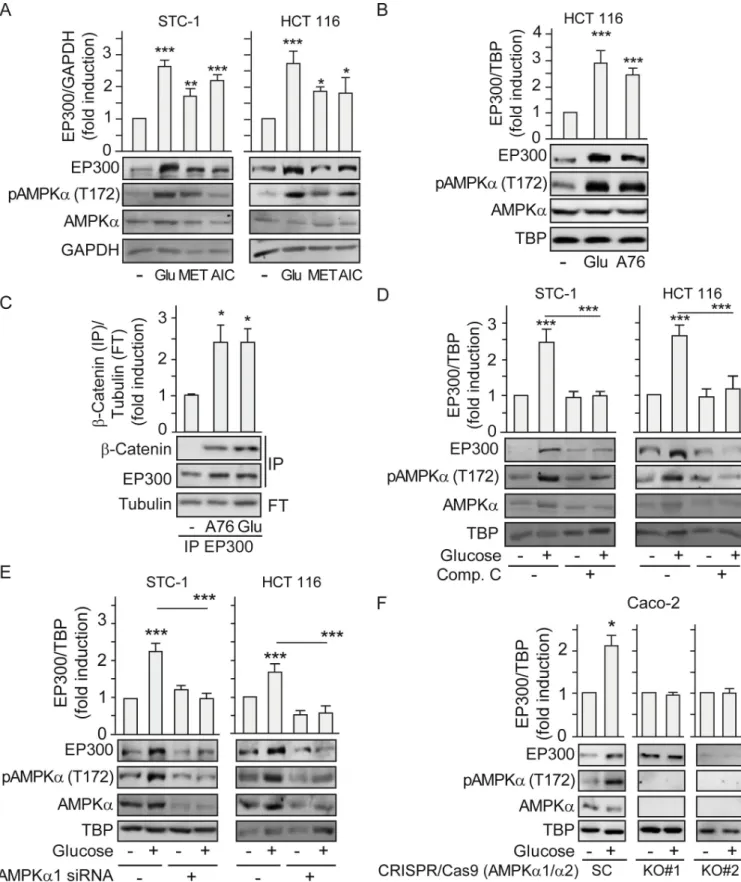
The ability of glucose to stimulate AMPK activity in gastrointestinal cancer cells suggested that it was a candidate regulator of the cell-type–specific response of EP300 to glucose. To deter-mine whether EP300 protein levels increased in response to glucose through AMPK induction, we manipulated AMPK activity and examined the EP300 response. Cells were exposed to met-formin or 5-aminoimidazole-4-carboxamide ribonucleotide (AICAR) that pharmacologically activate AMPK indirectly [27], with glucose being used as a positive control.Fig 3Areveals that both metformin and AICAR increased pAMPK (T172) and induced a parallel increase in EP300 levels in STC-1 and HCT 116 cells. Likewise, direct induction of AMPK with the activa-tor A769662, which binds to the AMPK beta1 subunit and acts both allosterically and via inhi-bition of AMPK (T172) dephosphorylation [28,29], also increased EP300 levels in HCT 116 (Fig 3B). Importantly, direct induction of AMPK with A769662 led to enhanced interaction between EP300 andβ-catenin (Fig 3C), that can promote colon cancer proliferation during tumorigenesis. Conversely, inhibiting AMPK using the ATP competitive Compound C blocked glucose induction of pAMPK (T172) and of EP300 (Fig 3D). Small interfering RNA (siRNA) mediated depletion of AMPK, and consequently of pAMPK (T172), also blocked EP300 accumulation in response to glucose in STC-1 and HTC 116 gastrointestinal cancer cell lines (Fig 3E). To eliminate any potential off-target effects of the siRNA or pharmacological
h (+). Where indicated, the EP300 inhibitor C646 was added at 5μM for the last 24 h. All panels except (C) contain representative western blots and statistical analysis of 3 independent experiments using whole cells extracts from indicated gastrointestinal or non-gastrointestinal cancer cells (A, B, and D) or extracts immunoprecipitated with anti-Ace-Lys antibody (E). (A) Comparison of EP300 induction by glucose in gastrointestinal and non-gastrointestinal cancer cell lines. (B) Selectivity of the cell-type–specific EP300 induction by glucose evaluating the close related CBP and associated PCAF acetyl transferases. (C) RT-qPCR of EP300 mRNA from HCT 116 cells starved of or cultured with glucose 25 mM for 24 h. Results show fold-induction normalized to 18S RNA expression. (D) Protein synthesis was inhibited with CHX and the degradation of EP300 was monitored in cells cultured without or with 25 mM glucose (time course) by western blotting of whole cell extracts. (E) Immunoprecipitation with anti-Ace-Lys antibody followed by western blotting using anti-EP300 or anti-CBP. GAPDH is the loading control shown in the FT. Input lane is not in the quantification. For statistical analysis,
n � 3 and values represent mean ± SEM;�P < 0.05;��P < 0.01;���P < 0.001. (A–C) by Student t test and (D–E) by one-way
ANOVA. Individual data can be found asS1 Dataand underlying raw images atS1 Raw Images. Ace-Lys, acetyl-lysine; CBP, CREB-binding protein; CHX, cycloheximide; EP300, Histone acetyltransferase p300; FT, flow through; GAPDH,
Glyceraldehyde 3-phosphate dehydrogenase; PCAF, P300/CBP-associated factor; RT-qPCR, quantitative Reverse Transcription Polymerase Chain Reaction; TBP, TATA-box-Binding Protein.
regulators of AMPK activity, we obtained 2 different clones of CRISPR/Cas9-mediated AMPK α1 and α2 knockout (KO) Caco-2 colon cancer cells [30,31]. Although the parental scramble Caco-2 cells responded to glucose by inducing EP300 protein levels, this effect was ablated in the AMPKα KO cells (Fig 3F). Furthermore, expression of a constitutively active deletion mutant of AMPK [32] reproduced the accumulation of EP300 in response to glucose (S3A Fig). By contrast, neither inhibition of EP300 using C646 (S3B Fig) nor overexpression of EP300 (S3C Fig) altered the induction of AMPK phosphorylation by glucose, indicating that EP300 lies downstream of AMPK and not upstream. Collectively, the data so far are consistent with glucose-driven activation of AMPK in gastrointestinal cancer cells leading to increased EP300 protein levels and selective interactions and activity.
Glucose metabolism-generated ROS activate AMPK in cancer cells that
cannot store glycogen
Since AMPK is a known energy sensor induced by starvation, it was surprising that the mecha-nism by which glucose induced EP300 in gastrointestinal cancer cells was through AMPK acti-vation. AMPK can be stimulated through both canonical and noncanonical pathways.
Canonical, energy-sensing pathways are dependent on increased intracellular AMP/ATP, ADP/ATP ratios. Noncanonical pathways are dependent on stresses, such as increased intra-cellular Ca+2or decreased fructose-1,6-bisphosphate (FBP levels) and are exemplified by ROS induction or glucose deprivation [33–37]. To explore the mechanism of AMPK activation by glucose, we examined whether, in gastrointestinal cancer cells, 25 mM glucose might induce osmotic stress that causes AMPK activation. STC-1 cells were cultured in parallel with similar concentrations of glucose or mannitol, a membrane-impermeable carbohydrate. Unlike glu-cose, mannitol induced accumulation neither of pAMPK (T172) nor of EP300 or EP300 phos-phorylation (S89) (S4A Fig), indicating that osmotic stress is not the cause of EP300 induction. The use of 2-deoxy-glucose (2-DG), a non-metabolizable carbohydrate, allowed us to explore the need of glucose metabolism for AMPK activation in gastrointestinal cancer cells. While both pAMPK (T172) and EP300 levels were induced by glucose in HCT 116 cells, addition of 2-DG interfered with glucose-mediated activation of AMPK and EP300 (S4B Fig). Together, these results suggest that glucose metabolism is necessary for AMPK induction. In conse-quence, we hypothesized that perhaps in Hep G2 cells (in which glucose did not induce AMPK), glucose was not metabolized but was stored instead as glycogen.
Glycogen storage was assayed using Periodic Acid-Schiff (PAS) staining, and pre-digestion withα-amylase or diastase (Periodic Acid-Schiff with alpha amylase [PAS-D]) that degrades glycogen was used to determine the specificity of PAS staining for glycogen. The results revealed that Hep G2 cells exhibited a basal level of glycogen and dramatically augmented
Fig 2. Glucose induction of EP300 correlates with cell-type–specific AMPK activation in gastrointestinal cancer cells. See related results inS2 Fig. (A) Scheme showing location of EP300 phosphorylation sites and responsible kinases. (B–D) Representative western blots of whole cell extracts from indicated cells cultured for 36 h in the absence of glucose (−) or in the presence of 25 mM glucose (+); GAPDH or TBP, loading controls. (C) Gastrointestinal cell-type– specific induction of pAMPK (T172). (B) Time course of pAMPK (T172) and EP300 induction upon addition of glucose 25 mM to STC-1 cells for the indicated times. The canonical AMPK substrate pACC1 (S79) is shown. (D) Gastrointestinal cell-type–specific induction of pEP300 (S89) as read out of pAMPK (T172) induction by glucose. (E) Immunoprecipitation with anti-EP300 antibody followed by western blotting using anti-β-catenin, anti-VDR, or anti-PPARγ. Tubulin, loading control shown in the FT. (F) RT-qPCR of the β-catenin target genes: CYCLIN D1 (CCND1) and MYC from HCT 116 cells. Values normalized with endogenous control (18S RNA) are refer to as fold induction over untreated cells. Statistical analysis of n � 3 and values represent mean± SEM;�P < 0.05;��P < 0.01;���P < 0.001. (B) by one-way ANOVA, (C–F) by Student t test. Underlying data can be found asS1 Dataand raw images
atS1 Raw Images. AKT, Serine-Threonine Kinase AKT or PKB; AMPK, AMP-activated protein kinase; ATM, Serine-protein kinase ATM (Ataxia telangiectasia mutated); Bro, Bromodomain; ERK, extracellular signal-regulated kinase 1; FT, flow through; GAPDH, Glyceraldehyde 3-phosphate dehydrogenase; KAT, Lysine acetyl transferase catalytic center; KIX, Nuclear receptor and CREB interacting domains; mTORC1, mammalian Target Of Rapamycin Complex 1; PhD, PhD finger; PPARγ, Peroxisome Proliferator-Activated Receptor gamma; P38, Mitogen-activated protein kinase P38; RT-qPCR, quantitative Reverse Transcription Polymerase Chain Reaction; TBP, TATA-box-Binding Protein; VDR, vitamin D receptor.
Fig 3. Glucose induction of EP300 and its interactions withβ-catenin rely on AMPK activation. See related results inS3 Fig. Indicated cells were cultured for 36 h in the absence of glucose (−) or in the presence of 25 mM glucose (+) for 24 h. All treatments with inducers or inhibitors as indicated were for 24 h. Representative western blots and statistical analysis of whole cell (A–B) and (D–F) or immunoprecipitated extracts with anti-EP300 antibody (C). GAPDH, TBP, or Tubulin are loading controls. (A) Effect of MET 5 mM and AICAR (AIC) 20μM compared to glucose 25 mM. (B) Effect of the specific AMPK inducer
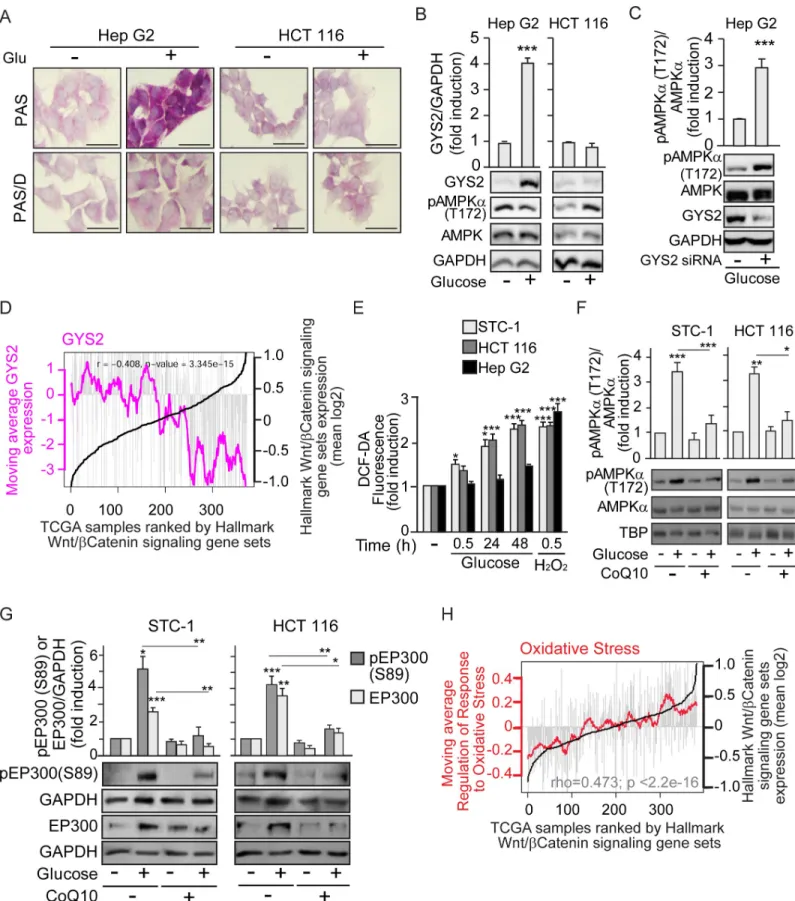
glycogen stores when exposed to glucose (Fig 4A). By contrast, HCT 116 colon cancer cells did not accumulate glycogen in response to high glucose exposure. In line with these results, glu-cose increased the levels of the rate-limiting glycogen synthesis enzyme Glycogen Synthase 2 (GYS2) in Hep G2 cells, but not in HCT 116 (Fig 4B). Note that increased GYS2 inversely cor-related with pAMPK (T172) in Hep G2 cells. Remarkably, siRNA-mediated GYS2 depletion led to AMPK induction by glucose in liver Hep G2 cancer cells (Fig 4C). Thus, blocking glyco-gen synthesis triggers AMPK activation by glucose in otherwise unresponsive cells.
As glucose-mediated activation of the AMPK/EP300 axis favors EP300/β-catenin associa-tion and would be inhibited in the presence of high GYS2, we anticipated that in liver cancer, in which GYS2 levels vary considerably, high GSY2 activity would correlate with reduced β-catenin activity. Remarkably,Fig 4Dshows that in The Cancer Genome Atlas (TCGA) liver cancer (HCC) cohort, high expression of Wnt/β-catenin targets strongly anti-correlated with GYS2 expression. A Kaplan-Meier plot of disease-free survival versus GYS2 content in this cohort (S4C Fig) indicated that high GYS2 expression is associated with significantly higher survival up to 80 months.
Since glucose metabolism was required for AMPK induction in gastrointestinal cancer cells unable to store glycogen, we evaluated the possibility that glucose metabolism-generated ROS can noncanonically induce AMPK [37]. In gastrointestinal cancer STC-1 and HCT 116 cell lines, high glucose concentrations increased the production of ROS over time up to levels com-parable to those induced by 30-min treatment with 100μM H2O2(Fig 4EandS4D Fig). By
contrast, Hep G2 hepatocellular carcinoma cells, which exhibited lower basal ROS, did not sig-nificantly increase ROS production upon exposure to glucose (Fig 4E). Lack of ROS produc-tion together with increased glycogen content in Hep G2 upon glucose exposure (Fig 4A), inhibited pAMPK (T172) in these cells (S4E Fig), ERK 1/2 phosphorylation is shown as a posi-tive control for H2O2[38]. Significantly, siRNA-specific depletion of GYS2 in Hep G2 cells
cul-tured with high glucose led to increased ROS (S4F Fig), consistent with glucose induction of pAMPK (T172) in Hep G2 depleted of GYS2 as shown inFig 4C.
Coenzyme Q (CoQ10), or ubiquinone, acts as an electron carrier from complex I or com-plex II to comcom-plex III within the inner mitochondrial membrane and is also a potent antioxi-dant that neutralizes free radicals [39]. In gastrointestinal cancer cells, CoQ10 reduced the production of ROS in response to glucose or H2O2(S4G Fig). Consistent with this, CoQ10
blocked the glucose-driven induction of pAMPK (T172) (Fig 4F) and the downstream pEP300 (S89) phosphorylation and accumulation of EP300 (Fig 4G). Importantly, glucose-mediated induction of H3K9 Ace was also prevented by CoQ10 (S4H Fig).
The results so far are consistent with a model in which colon cancer cells do not accumulate glycogen and glucose metabolism elevates ROS. Lack of glycogen and elevated ROS induce AMPK-mediated activation of EP300 to enhanceβ-catenin signaling. In line with this, a ROS-induced gene expression signature directly correlated with expression of a set ofβ-catenin tar-get genes in the TCGA colorectal cancer cohort (Fig 4H). Relevant to these results, since glyco-gen synthase kinase 3β (GSK3β) induces β-catenin degradation and glycoglyco-gen synthase
inactivation, note that glucose did not significantly change GSK3β activity in colon cancer
A-769662 (A76) 25μM on EP300 induction. (C) Effect of AMPK induction by A-769662 (A76) 50 μM on the EP300/β-catenin interactions. (D) Effect of AMPK inhibition by Compound C (20μM) on EP300 induction. (E) Depletion of the catalytic subunit of AMPK by transfection with AMPKα-specific siRNA (or an SC) for 48 h. Indicated cells were starved of glucose 24 h and refed with 25 mM glucose for another 24 h. (F) Effect of deletion of AMPKα on EP300 induction by glucose in colon cancer cells. Caco-2 colon cancer cells CRISPR/Cas9 deleted of AMPKα1 and α2 (AMPKα1/α2 KO) are compared to the corresponding SC [29]. Statistical analysis by one-way ANOVA (A–E) or by Studentt test (F). Values represent mean ± SEM; n � 3;�P < 0.05;��P < 0.01; ���P < 0.001. Individual data can be found asS1 Dataand underlying raw images atS1 Raw Images. AICAR, 5-aminoimidazole-4-carboxamide
ribonucleotide; AMPK, AMP-activated protein kinase; A76, AMPK inducer A-769662; Comp. C, Compound C; GAPDH, Glyceraldehyde 3-phosphate dehydrogenase; EP300, Histone acetyltransferase p300; KO, knockout; MET, metformin; SC, scramble control; TBP, TATA-box-Binding Protein.
Fig 4. Cell-type–specific glucose induction of AMPK depends on the fate of glucose: To be stored as glycogen or metabolized to increase ROS. See related results inS4 Fig. Cells were cultured as earlier; starvation of glucose lasted 24 h for cells that required pre-treatment with CoQ10 (10μM) or transfection. Before starvation, pre-treatment with CoQ10 was 12 h and transfection for 48 h. (A) Glycogen stores in Hep G2 and HCT 116 colon cancer cells, revealed by PAS staining. Diastase
cells, according to unchanged levels of pGSK3β (S9) as previously published [40]. Thus, the inability of colorectal cancer cells to divert glucose away from metabolism into glycogen storage underpins the cell-type–specific activation of the glucose/ROS/AMPK/EP300/β-catenin axis.
The ROS/AMPK/EP300/
β-catenin axis drives glucose-mediated
gastrointestinal cancer cell proliferation
Our results suggest that the interaction between EP300 andβ-catenin, a key event in gastroin-testinal neoplasia, is driven by glucose-mediated activation of AMPK via ROS. To confirm that this pathway drives proliferation, consistent with the ability of glucose to increase transcription of theβ-catenin target genes CCND1 and MYC (Fig 2F), we examined the effect of glucose and its downstream effectors on the cell cycle of gastrointestinal cancer cells. Flow cytometry indi-cated that increasing glucose levels accelerated cell cycle progression by shortening G1 to increase the number of cells in S and G2M (S5A Fig), with a total increase in the proliferation rate (S5B Fig).
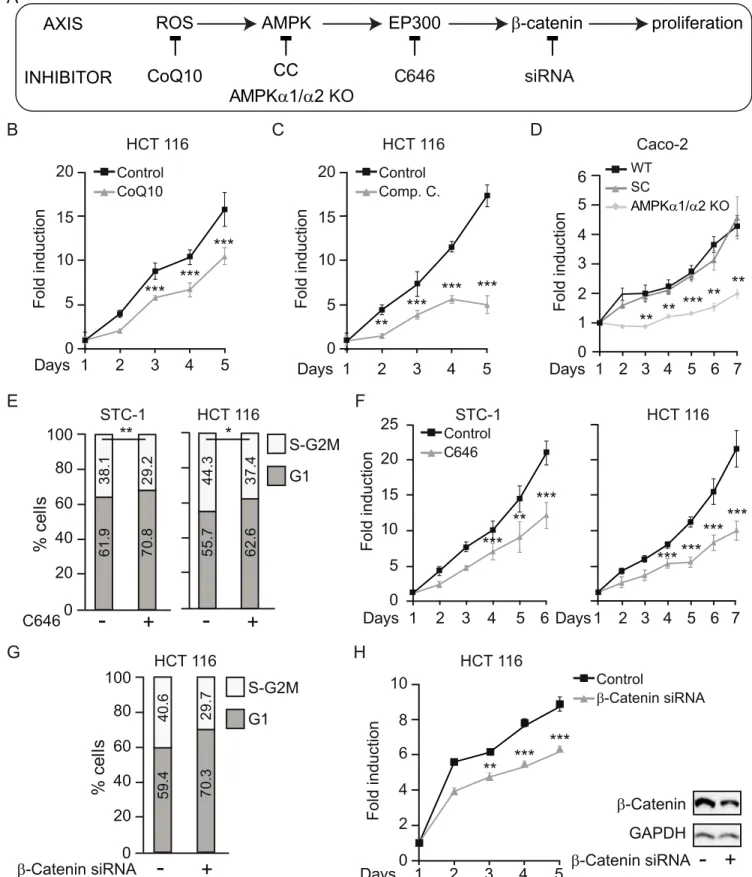
In support of a ROS/AMPK/EP300/β-catenin axis mediating glucose-induced proliferation of colon cancer cells, blockade at each level (Fig 5A) abolished the effects of glucose on prolif-eration. First, counteracting ROS accumulation with CoQ10 reduced the proliferative response of gastrointestinal cancer cells to high glucose (Fig 5B). Inhibition of AMPK with Compound C (Fig 5C) or AMPK deletion with CRISPR/Cas9 (Fig 5D) reduced proliferation to similar lev-els. Both AMPKα1/α2 KO clones (KO 1 and KO 2) were analyzed and gave similar results although, for simplicity, only clone KO 1 is shown. Moreover, inhibition of EP300 activity using C646 also interfered with high-glucose–induced acceleration of the cell cycle (Fig 5E) and decreased the cellular proliferation rate (Fig 5F). Finally, siRNA-mediated depletion of β-catenin also interfered with the acceleration of the cell cycle by glucose (Fig 5G) and blocked its pro-proliferative effects (Fig 5H), indicating that increased proliferation of colon cancer cells in response to glucose requiresβ-catenin.
Taken together, the results suggest that glucose specifically promotes gastrointestinal cancer cell growth through increased ROS production that induces AMPK and EP300-driven interac-tion with, and acetylainterac-tion of,β-catenin. Acetylation of β-catenin is required for nuclear accu-mulation in colon cancer cells [40].
The glucose/ROS/AMPK/EP300/β-catenin axis is on in mouse and human
colorectal cancer
To validate in vivo the pro-proliferative ROS-AMPK-EP300/β-catenin axis, we used combined azoxymethane and dextran sodium sulfate (AOM/DSS) to induce tumors in C57/Bl6 mice, a
treatment (PAS-D) degrades glycogen and reveals specificity of staining; scale bars: 25μm. (B) Differential induction of the rate-limiting enzyme for glycogen synthesis GYS2 in Hep G2 and HCT 116. Representative western blots and statistical analysis with GAPDH as loading control. (C) Induction of pAMPK (T172) by glucose in Hep G2 cells upon depletion of GYS2 by transfection with GYS2-specific siRNA (+) or the SC (−). (D) Bioinformatic analysis of the TCGA human liver cancer (HCC) cohort. Individual samples were ranked by expression of the GSEA “HALLMARKβ-catenin signaling” gene set (black line). Grey bars indicate levels of expression in each individual tumor sample of GYS2. Pink line represents the moving average GYS2 across each 20 liver cancer samples.P value and correlation coefficient (rho) are
indicated. (E) ROS production in gastrointestinal STC-1 and HCT 116 and in hepatoblastoma Hep G2 cancer cells, measured by flow cytometry using DCF-DA 0.5μM as a label in response to glucose 25 mM or H2O2100μM as positive control. (F) and (G) Western blotting analysis as in (B) with GAPDH or TBP as loading controls. (F) Effect of CoQ10 blockade of ROS on induction of pAMPK (T172) by glucose. (G) Effect of CoQ10 on induction of pEP300 (S89) by glucose. (H) Bioinformatic analysis of TCGA human colon cancer cohort, gene expression data. Individuals are ranked by the GSEA “HALLMARKβ-catenin signaling” gene set (black line). Grey bars indicate levels of expression in each individual tumor sample of the GSEA “Regulation of the response to oxidative stress” gene set. Red line represents the moving average of the oxidative stress signature across each 20 colorectal cancer samples.P value and correlation coefficient (rho) are indicated. Statistical analysis by Student t
test (B–C) or one-way ANOVA (E–G) ofn � 3 independent experiments. Values represent mean ± SEM;�P < 0.05;��P < 0.01;���P < 0.001. Underlying data can be
found asS1 Dataand raw images atS1 Raw Images. AMPK, AMP-activated protein kinase; CoQ10, Coenzyme Q10; DCF-DA, 2’7’-dichlorodihydrofluorescein diacetate; GAPDH, Glyceraldehyde 3-phosphate dehydrogenase; GSEA, gene set enrichment analysis; GYS2, Glycogen Synthase 2; PAS, Periodic Acid-Schiff; PAS-D, Periodic Acid-Schiff with alpha amylase; ROS, reactive oxygen species; SC, scramble control; TBP, TATA-box-Binding Protein; TCGA, The Cancer Genome Atlas.
Fig 5. Glucose-induced proliferation of gastrointestinal cancer cells relies on ROS/AMPK/EP300/β-catenin signaling. See related results inS5 Fig. (A) Scheme of the axis evaluated with indicated blockade at each level: ROS were blocked by CoQ10; AMPK by Compound C or CRISPR/Cas9 deletion ofα1 and
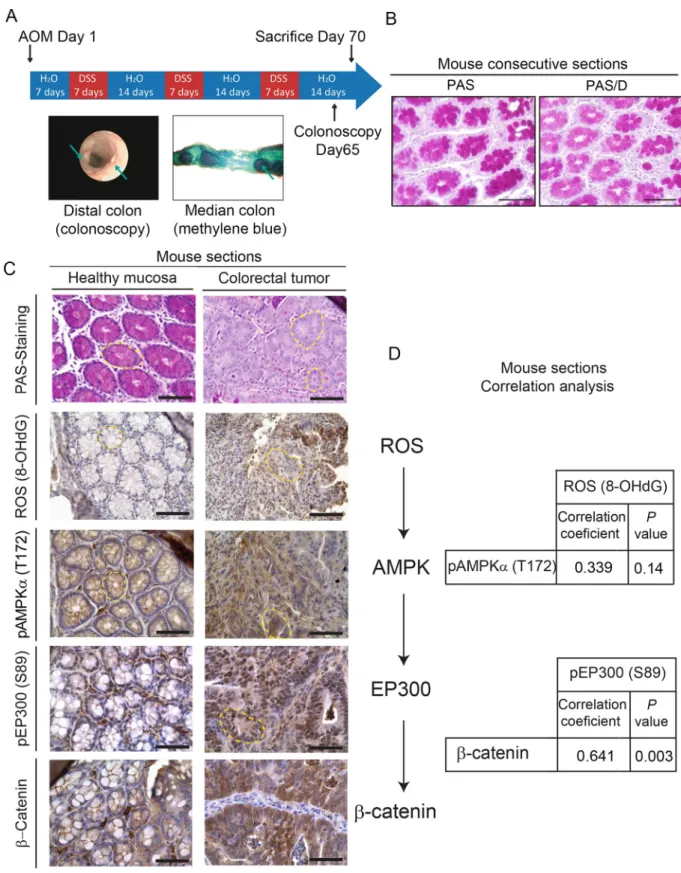
well-established model of colorectal cancer [41].Fig 6Adepicts the protocol to induce tumors with representative colonoscopy taken after tumor induction and methylene blue staining of the median intestinal section. PAS staining and pre-digestion with diastase (PAS-D) of conse-cutive sections revealed abundant glycogen content in healthy colon tissue (Fig 6B). In clear contrast with healthy tissue, tumor sections were PAS negative and thus depleted of any glyco-gen content (Fig 6C). In healthy tissue, glycogen stores anti-correlated with pAMPK (T172), pEP300 (S89), and nuclearβ-catenin (Fig 6C). By contrast, tumor sections were depleted of glycogen and exhibited high levels of ROS, pAMPK (T172), pEP300 (S89), and nuclear and cytoplasmicβ-catenin. Thus, tissue data are consistent with our results in cell lines. Immuno-histochemistry from tumor and healthy sections from 19 mice were semi-quantitatively evalu-ated with an H-score, combining intensity of the staining and percentage of positive cells. The relationship between ROS (8-OHdG), pAMPK (T172), pEP300 (S89), andβ-catenin was assessed by linear correlation (Fig 6D). pEP300 (S89) andβ-catenin, factors located down-stream of the axis, were positively correlated (R = 0.641;P = 0.003). Although linear correlation
between the other factors did not achieve statistical significance, a high trend towards signifi-cance and a moderate positive correlation was found between ROS and pAMPK (T172) (R = 0.339;P = 0.144) and between pAMPK (T172) and β-catenin (R = 0.410; P = 0.072).
Bear-ing in mind that the analysis was done in 19 isogenic mice, the results suggested that the ROS/ AMPK/EP300/β-catenin axis might be “ON” in tumor tissue and “OFF” in adjacent healthy sections and encouraged us to study its relevance in human samples.
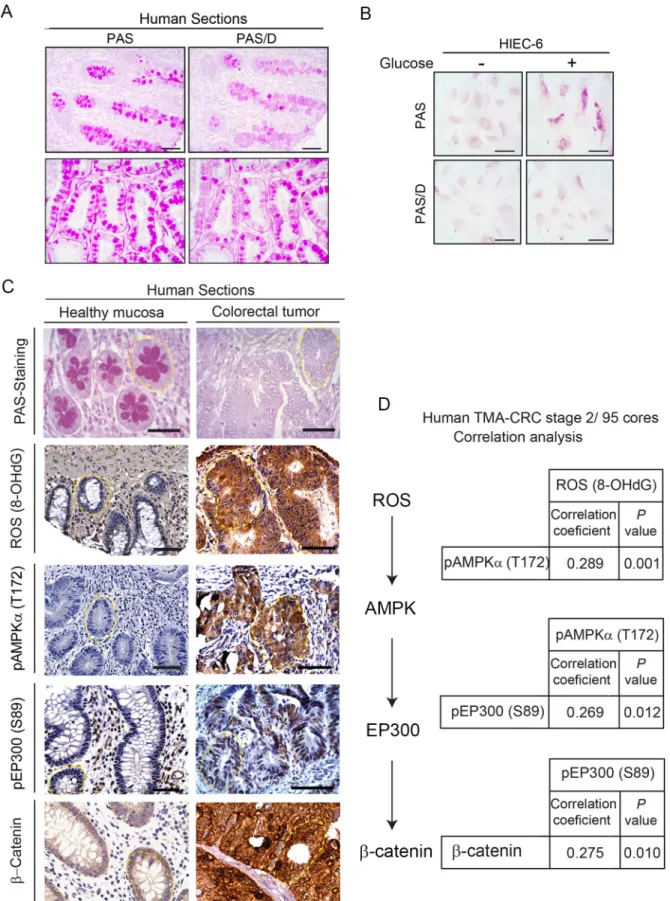
Consistent with the mouse results, PAS staining of healthy human tissue sections revealed the presence of abundant glycogen and neutral mucins, and pre-digestion of consecutive sec-tions with diastase (PAS-D) confirmed the important contribution of glycogen (Fig 7A). The surprising capacity to store glycogen in healthy colon was confirmed inin vitro–cultured
healthy colon HIEC 6 cells exposed to glucose 25 mM (Fig 7B).
The clinical relevance of the ROS/AMPK/EP300/β-catenin axis was examined in human samples (Fig 7C and 7D). Representative pictures of human large bowel sections (Fig 7C) illus-trate that healthy sections were PAS positive in contrast with the PAS-negative tumor sections, as described for mouse. Moreover, the ROS/AMPK/EP300/β-catenin axis was active in human cancers and inactive in adjacent nontumor tissue, consistent with the in vivo data from mice. Core sections from 95 stage II colorectal cancer patients with the clinical features of tumors summarized inS1 Tablewere probed in tissue microarrays (TMAs) with the relevant antibod-ies. The immunohistochemistry from the TMA was semi-quantitatively evaluated with an H-score, combining intensity of the staining and percentage of positive cells. A linear correlation was assessed to study the relationship between ROS (8-OHdG), pAMPK (T172), pEP300 (S89), andβ-catenin, (Fig 7D). A positive and significant linear correlation was revealed between each two nodes of the axis. First, ROS and pAMPK (T172) levels exhibited a positive and significant correlation (r = 0.289,P = 0.001). Second, a positive significant correlation
(r = 0.269,P = 0.012) between pAMPK (T172) and pEP300 (S89) was found. Third, pEP300
(S89) andβ-catenin were also directly correlated (r = 0.275, P = 0.010).
α2 subunits; EP300 by C646 and β-catenin was depleted with a specific siRNA. (B–D), (F), and (H), proliferation curves; (E) and (G) flow cytometry analysis of cell cycle in indicated cancer cells cultured with 25 mM glucose under indicated conditions. (B) Effect on proliferation of ROS blockade by 10μM CoQ10. (C) Effect on proliferation of AMPK inhibition with 20μM Compound C. (D) Effect of CRISPR/Cas9-mediated deletion of AMPKα1 and α2. (E–F) Effect of the EP300 inhibitor C646 (5μM) on the cell cycle (E) and on proliferation (F). (G–H) Effect of siRNA-mediated β-catenin depletion on cell cycle (G) and proliferation (H); western blots at the right of panel G are representative of theβ-catenin depletion. Statistical analysis by Student t test; values represent mean ± SEM ofn � 3 experiments;�P < 0.05;��P < 0.01;���P < 0.001. Individual data can be found asS1 Dataand underlying raw images atS1 Raw Images. AMPK,
AMP-activated protein kinase; AMPKα1/α2 KO, AMPK α1/α2 knock out; CC, Compound C; CoQ10, Coenzyme Q10; EP300, Histone acetyltransferase p300; ROS, reactive oxygen species; siRNA, small interfering RNA; WT, wild-type parental Caco-2 cells.
Fig 6. In vivo relevance of the ROS/AMPK/EP300/β-catenin axis in mouse colorectal cancer. (A) Scheme of the protocol to induce intestinal
tumors in C57/Bl6 mice using AOM/DSS [42] with representative images of colonoscopy after the procedure and methylene blue staining of the medial portion of mouse intestine to show the tumors. (B) Representative pictures of histochemical analysis of glycogen content in healthy mouse intestinal mucosa by PAS staining preceded or not by diastase digestion (PAS/D) in consecutive sections to show glycogen specificity of PAS staining. Scale bars: 50μm. (C) Analysis of glycogen content in relation with ROS (8-OHdG), pAMPK (T172), pEP300 (S89), and
Taken together, the results suggest that the presence of glycogen in healthy colon epithelia at tumor initiation may inhibit AMPK, whereas upon tumor evolution, combined loss of capacity to store glycogen and increased glucose uptake and metabolism induce a ROS/ AMPK/EP300/β-catenin axis that sustains proliferation of colon cancer cells.
Discussion
The ability of cells to coordinate energy supply with gene expression is crucial to control migration, proliferation, and homeostasis [43]. It is widely assumed that the response to key nutrients such as glucose is likely to be similar between different cell types. In this respect, glu-cose limitation or starvation is known to activate AMPK in cells of diverse origins, including liver cancer Hep G2 cells [44,45]. However, most of these studies were done in tissues such as liver, muscle, and adipose that facilitate maintenance of whole-body energy homeostasis by releasing energy from glycogen or fat store. Remarkably, we reveal here that in gastrointestinal, but not in several other cancer cell types, AMPK is in fact activated by glucose. The apparently paradoxical activation of AMPK in gastrointestinal cancer cells arises as a consequence of ROS production generated by glucose metabolism and is suppressed in other cell types with an abil-ity to synthesize and store glycogen. Thus, the fate of glucose within cells—increased metabo-lism and ROS accumulation versus storage as glycogen—is a key determinant for the response of AMPK, which in turn controls cellular metabolism and downstream transcription programs through effectors such as EP300.
Our results indicate that, in gastrointestinal cancer cells, the activation of AMPK in response to glucose leads to EP300 stabilization and increased interaction withβ-catenin that can promote pro-proliferativeMYC and CCND1 expression. By contrast, AMPK-driven
phos-phorylation of EP300 interferes with EP300/VDR and PPARγ interactions, which are crucial for differentiation and homeostasis of gastrointestinal mucosa [46]. This is in line with previ-ous observations that in BHK cells, phosphorylation of EP300 at S89 also decreases EP300 interactions with the nuclear receptors for thyroid hormones (TR) for All-trans Retinoic Acid (RAR) and for 9-cis Retinoic Acid (RXR) [15]. Our data are consistent with exposure to high glucose of gastrointestinal cancer cells, but not healthy or other cancer types, promoting a switch of a limited EP300 pool from nuclear receptors towardsβ-catenin leading to a pro-pro-liferative outcome. Since S89 is not conserved between EP300 and CBP, this may explain the specificity of EP300 regulation by glucose. It could be argued that phosphorylation of pEP300 at S89 is mediated by PKC as previously reported in in vitro assays or HeLa cells [47,48]. Although PKC and AMPK target similar consensus sequences, PKC exhibits additional requirements at position−3 that make EP300 a poor PKC substrate. Moreover, we have been unable to detect induction of PKC by high glucose in gastrointestinal cancer cells. Since the siRNA-mediated depletion or CRISPR/Cas9-mediated deletion of AMPK abolishes, and the constitutively active AMPK mutant mimics the induction of EP300 by glucose, we believe the major phosphorylation event on S89 is mediated by AMPK. Nevertheless, in some cell types, PKC may induce pEP300 (S89) indirectly through AMPK activation as shown in monocytes [49].
catenin. Representative photographs of mouse colorectal tumor or healthy intestinal mucosa stained with PAS or indicated antibodies (brown). Crypts are highlighted with yellow dashed line. Scale bars: 50μm. (D) Correlation analysis of tumor and healthy sections from 19 mice with Pearson coefficient andP values shown. 8-OHdG, 8-hydroxy-2’-deoxyguanosine; AOM/DSS, azoxymethane/dextran sodium sulfate; pAMPKα
(T172) phospho-AMP-activated protein kinase alpha (Threonine 172); pEP300 (S89), phospho-Histone acetyltransferase p300 (Serine 89); PAS, Periodic Acid-Schiff; PAS/D (or PAS-D), Periodic Acid-Schiff with diastase or alpha-amylase; ROS, reactive oxygen species.
Fig 7. Clinical relevance of the ROS/AMPK/EP300/β-catenin axis in human colorectal cancer. (A) Histochemical staining with PAS
preceded or not by digestion of consecutive sections with diastase (PAS/D) to reveal glycogen content (purple). Representative pictures with
Unlike in gastrointestinal cancer cells, glucose triggers increased EP300 mRNA expression in endothelial HUVEC cells [3] and cardiomyocytes [50]. In the absence of EP300 phosphory-lation at S89 to redirect EP300 towardsβ-catenin, increased EP300 levels may lead to a tran-scriptional outcome different from that observed in gastrointestinal cancer cells. Thus, our results illustrate how nutrients signal through AMPK to select EP300 binding partners and substrates that define the transcriptional outcome in a cell-type–specific fashion.
Since AMPK activation by high glucose in colon cancer cells drives proliferation, a question arises as to whether AMPK acts as a tumor promoter or as tumor suppressor. AMPK increases cellular glucose uptake [51–53], a cancer cell hallmark that would require AMPK activity. However, AMPK also inhibits mTORC1, the master controller of protein synthesis for growth, and as such AMPK would be expected to be inhibited in cancer cells. The importance of the question is reflected by the significant interest in targeting AMPK in cancer (https:// clinicaltrials.gov). In fact, examples can be found where AMPK inhibition reduces growth in prostate cancer cells, whereas AMPK activation with metformin or phenformin reduces or delays formation of certain tumors [54,55], although it can be argued that the effects of metfor-min on cancer cells might be AMPK dependent or independent [56,57]. A recent in-depth review of genetic and animal evidence proposes that AMPK acts as a tumor suppressor at ini-tial stages and as a tumor promoter in later stages of tumor evolution, when AMPK may become critical for metabolic adaptation and survival [58]. However, what in each cell or at a given time drives AMPK to act as tumor suppressor or promoter remains unclear. One possi-bility would be that exhausting the capacity to store glycogen, which can bind and negatively regulate AMPK [59–62], allows glucose-mediated generation of the AMPK activator ROS, switching AMPK from suppressor to promoter of cancer growth. This hypothesis is supported by our results showing the contrasting capacity to store glycogen in healthy and tumor cells of the colon. It is tempting to propose that at tumor initiation increased glucose uptake might still be diverted into glycogen storage to inhibit AMPK, enabling mTORC1 to allow growth and proliferation. During tumor evolution, the capacity to store glycogen is diminished, rewir-ing AMPK signalrewir-ing to coordinate metabolism that allows survival. At this stage, glucose metabolism will increase ROS to induce AMPK and redirect EP300 towards pro-proliferative β-catenin interactions. Importantly, metformin reduces glycogen content in several cell types [63,64]. Following this reasoning, the role of AMPK targeting drugs may depend on tumor stage [65]. Thus, the metabolic context (i.e., capacity to store glycogen) may define whether glucose inhibits AMPK, acting as tumor suppressor at initial tumor stages, or induces AMPK acting as tumor promoter at advanced stages to drive EP300/β-catenin interactions. In this sce-nario, the potential for AMPK to act as tumor promoter or suppressor may depend on the capacity to store glycogen.
Thus, activation of AMPK by glucose in gastrointestinal cancer cells leads to a cascade of downstream events, including increased levels and selective acetyl transferase activity of EP300 on specific substrates such as histone H3K9 (a hallmark of chromatin opening) [66] and the WNT effectorβ-catenin, which increases its transcriptional activity [67], leading to increased
longitudinal (top) and transversal (bottom) sections. Scale bars: 50μm. (B) Glycogen stores in human healthy colon cells HIEC 6 cultured for 24 h with low (1.5 mM) or high (25 mM) glucose revealed by PAS and PAS/D staining; scale bars: 25μm. (C) Representative photographs of glycogen content stained with PAS in relation with ROS (8-OHdG), pAMPK (T172), pEP300 (S89), andβ-catenin by immunohistochemical analysis in tumor versus healthy human bowel sections. Crypts are highlighted with yellow dashed line. Scale bars: 50μm. (D) TMA analysis with 95 cores (0.6 mm diameter) of preselected regions of untreated CRC, stage 2. SeeMaterials and Methods
section andS1 Tablefor clinicopathological characteristics. Positive correlations were found between the nodes of the ROS/AMPK/EP300/ β-catenin axis with correlation coefficients and P values shown. 8-OHdG, 8-hydroxy-2’-deoxyguanosine; CRC, colorectal cancer; pAMPKα (T172) phospho-AMP-activated protein kinase alpha (Threonine 172); PAS, Periodic Acid-Schiff; PAS/D, Periodic Acid-Schiff with alpha amylase; pEP300 (S89), phospho-Histone acetyltransferase p300 (Serine 89); ROS, reactive oxygen species; TMA, tissue microarray.
proliferation. The surprising cell-type–restricted activation of EP300 and its re-direction towardsβ-catenin in response to glucose and AMPK signaling revealed here highlights a key molecular switch that integrates nutrient availability with regulation ofβ-catenin, a key driver of gastrointestinal tumorigenesis. Since hyperglycemia can trigger increased ROS and is a major cause of clinical complications associated with diabetes and obesity [68], the results pre-sented have implications for those cancers associated with diabetes [69,70] and for the non– insulin-dependent response of cells to high glucose. The results may also have significant implications for understanding the response to drugs targeting AMPK, increasingly used in the treatment of both diabetes and cancer.
Future work looking closely at initial versus final stages of colorectal cancer will unveil the potential of strategies targeting glycogen [71] or the convenience of inducing or inhibiting AMPK in stratified populations.
Materials and methods
Ethics statement
Animal studies were approved by the ethics committee C2EA number 005 Charles Darwin, (number of approval: APAFIS#21551–2019071915156299 v4). All experiments complied with the EU guidelines for the protection of vertebra animals used for scientific purposes, under French authorization and approval number 75–886.
Human samples
This TMA was part of a comprehensive study in which many prognostic factors were included and was reviewed and approved by the Institutional Review Board (IRB) of the Fundacio´n Jimenez Diaz Hospital, which evaluated the study, granting approval on December 9, 2014, by the act number 17/14. Clinical samples were kindly supplied by the BioBank of Fundacio´n Jime´nez Dı´az-Universidad Auto´noma de Madrid (PT13/0010/0012). All patients gave written informed consent for the use of their biological samples for research purposes. Fundamental ethical principles and rights promoted by Spain (LOPD 15/1999) and the European Union EU (2000/C364/01) were followed. In addition, all patients’ data were processed according to the Declaration of Helsinki (last revision 2013) and Spanish National Biomedical Research Law (14/2007, of July 3).
Materials are listed inS2 Table.
Cell culture
Mouse tumor enteroendocrine STC-1, colorectal adenocarcinoma (HT-29, HCT 116, LS 174T, Caco-2), and hepatocellular adenocarcinoma (Hep G2) were cultured in DMEM. Healthy colon cells (HIEC 6) were cultured in Opti-MEM. Pancreatic carcinoma (AsPC-1), melanoma (IGR 37), and Burkitt’s lymphoma (Raji) were cultured in RPMI. All media were supplemented with 10% fetal bovine serum, and cells grew at 37˚C under 5% CO2. Cells
starved of glucose for 24–36 h were stimulated as indicated. Caco-2 were deleted by CRISP/ Cas9 of AMPKα1 and α2 using two different sgRNA guides that generated 2 clones or the scramble control (SC). These clones were generated as previously described [30,31] from parental Caco-2.
Transient transfections. For plasmid transfection, cells were seeded in plates at 50%
con-fluence using JetPei PolyPlus reagent, following the manufacturer’s instructions. After 24 h, cells were cultured in absence of glucose and treated as indicated.
For AMPKα or GYS2 siRNA, cells plated in 6-well plates at 50% confluence were trans-fected using JetPRIME reagent following the manufacturer’s instructions. After 2 d, cells were cultured in the absence of glucose for 24 h, treated again with glucose for another 24 h, and collected to analyze by western blot.
Forβ-catenin siRNA, cells were plated in 24-well plates at 15% confluence and transfected using JetPRIME reagent following the manufacturer’s instructions. Cells were collected to ana-lyze cell-growth curves, cell cycle or by western blot.
Colorectal cancer induction using AOM/DSS
Eight- to ten-week-old C57BL/6 male mice were injected i.p. with 12.5 mg/kg AOM (A5486, Sigma-Aldrich) on day 1 of the protocol. Mice were exposed to 3 cycles of 1.5% DSS-contain-ing (160110, MP Biomedicals) drinkDSS-contain-ing water for 7 d with a switch to DSS-containDSS-contain-ing water at day 7, day 28, and day 49. Colonoscopy (TRICAM endoscope Karl Storz) was performed on anesthetized mice with inhaled isoflurane 65 d after AOM injection to evaluate tumor develop-ment (representative colonoscopy picture shown inFig 6A). At day 70, tumor-bearing mice were euthanized by cervical dislocation to obtain nontumor and tumor tissues.
Preparation of cell extracts
Whole cell extracts. Cells were washed with iced PBS before extract preparation and
scraped in RIPA buffer (10 mM Tris HCl [pH 7.4], 5 mM EDTA, 5 mM EGTA, 1% Tryton X100, 10 mM Na4P2O7[pH 7.4], 10 mM NaF, 130 mM NaCl, 0.1% SDS, 0.5%
Na-deoxycho-late). After 5 min on ice, cells were pelleted (12,000 rpm for 5 min, 4˚C), and the supernatant was directly used as whole cell extract or frozen at−80˚C.
Fractionated cell extracts. After washing as before, cells were scraped in hypotonic buffer
(20 mM Hepes [pH 8.0], 10 mM KCl, 0.15 mM EDTA, 0.15 mM EGTA, 0.05% NP40 and pro-tease inhibitors) and swollen on ice for 10 min before adding 1:2 volume of sucrose buffer (50 mM Hepes [pH 8.0], 0.25 mM EDTA, 10 mM KCl, 70% sucrose). Lysates were fractionated (5,000 rpm for 5 min at 4˚C) to obtain the cytoplasmic fraction in the supernatant. Nuclear pellets were further washed twice with washing buffer (20 mM Hepes [pH 8.0], 50 mM NaCl, MgCl21.5 mM, 0.25 mM EDTA, 0.15 mM EGTA, 25% glycerol and protease inhibitors),
pel-leted at 5,000 rpm, 5 min at 4˚C, and resuspended in nuclear extraction buffer (20 mM Hepes [pH 8.0], 450 mM NaCl, MgCl21.5 mM, 0.25 mM EDTA, 0.15 mM EGTA, 0.05% NP40, 25%
glycerol and protease inhibitors) before centrifugation at 12,000 rpm for 5 min at 4˚C to pellet and discard cell debris. The supernatants were used as nuclear fractions.
Immunoprecipitation
Whole cell extracts were obtained in the same buffer without 0.1% SDS and 0.5% Na-deoxy-cholate. For immunoprecipitation from fractionated extracts, the hypotonic buffer was modi-fied by adding 100 mM NaCl and 0.1% NP40. For immune complex formation, protein A/G-coated magnetic beads were washed 3 times with the extraction buffer before coating with the primary antibody for 2 h at 4˚C in a rotating wheel, followed by 2 washes with the same buffer to eliminate unbound antibody, and then extracts were added O/N at 4˚C in the rotating wheel. Immunocomplexes were washed twice and used for western blotting.
Western blotting
Proteins from lysed cells or immunoprecipitates were denatured and loaded on sodium dode-cyl sulfate polyacrylamide gels and transferred to polyvinylidene difluoride membranes. After
blocking with 5% (w/v) BSA or milk, the membrane was incubated with the corresponding primary and secondary antibodies. The specific bands were analyzed using Thyphoon or Che-miDoc Imaging Systems.
Immunofluorescence
Cells in cover slips were washed 3 times, fixed with 4% paraformaldehyde in PBS (pH 7.4) for 10 min, and washed again. Cells were permeabilized (PBS [pH 7.4], 0.5% Triton X-100, 0.2% BSA) for 5 min; blocked (PBS [pH 7.4], 0.05% Triton X-100, 5% BSA) for 1 h at room tempera-ture; incubated with primary antibody over night at 4˚C; and washed 3 times for 5 min and incubated with the secondary antibody for 1 h at room temperature. Slides were mounted, and images were acquired using a SP5 confocal microscope (Leica) with a 63× objective. Fluores-cence intensity was quantified using Image J software. For each experiment, 3 different fields were evaluated per slide.
PAS and PAS-D staining
HCT 116, HIEC 6 and Hep G2 cells seeded in coverslips were washed 3 times, fixed with 4% paraformaldehyde in PBS (pH 7.4) for 10 min, and washed again. For PAS-D staining, slides were incubated with 0.2%α-amylase (Diastase, Sigma-Aldrich) in PBS for 30 min at 37˚C and rinsed in tap water and then with distilled water. For PAS staining, this step was performed with PBS. Slides were then oxidized for 5 min with 1% solution of periodic acid (Sigma-Aldrich), washed with tap water for 3 min, washed with distilled water for 1 min, and incu-bated in Schiff’s reagent (Sigma-Aldrich) for 20 min. Slides were washed first with distilled water for 5 s and then with tap water for 10 min. Counterstaining was performed with Hema-toxylin Solution (Sigma-Aldrich) for 2 min and washed 3 times for 5 min with PBS. For tissue sections, slides were deparaffinized and hydrated before diastase digestion (1 h at 37˚C) and/ or PAS staining: 5 min in 1% solution of periodic acid followed by washes and incubation in Schiff’s reagent for 5 min. Slides were counterstained with Hematoxylin for 30 s. Images were acquired using a microscope (Zeiss) with a 40× objective for cultured cells or 20× for tissue sections.
Measurement and imaging of ROS by fluorescence
Intracellular levels of ROS were determined using 2’7’-dichlorodihydrofluorescein diacetate (DCF-DA) in conjunction with cytometer and fluorescent microscopy. For cytometry, cells were harvested, washed with PBS, and loaded with 0.5μM DCF-DA in the dark for 15 min at 37˚C. The excess dye was flushed off, and cells were resuspended in PBS. Fluorescence inten-sity was quantified using FACSCalibur (Becton-Dickinson). For microscopy imaging, cells were treated with 10μM DCF-DA for 30 min at 37˚C, washed twice with PBS, and analyzed in a fluorescence microscope.
Cell-growth curves and cell cycle
Cells were seeded at a density of 20,000 cells per well in a Corning 12-well plate and counted in a Neubauer camera by TB dye exclusion. Cell number was counted every 24 h for 5–7 d, and the medium was replaced every 3 d. For cell cycle analysis, cells were harvested by trypsiniza-tion, washed with PBS, fixed in 70% ethanol, stained with 7-AAD (Santa Cruz Biotechnology) for 10 min at 37˚C, and analyzed by flow cytometry (FACSCalibur, Becton-Dickinson). The percentages of cells in the cell cycle phases were analyzed using CXP software (Becton-Dickinson).
Gene expression analysis
Total RNA was isolated with TRIzol (Invitrogen). cDNA was generated from 1μg of RNA fol-lowing the manufacturer’s protocol. Reagents and detection systems were from Life Technolo-gies. 18S ribosomal RNA primers served as a nonregulated control. Relative expression was calculated using the Ct method, expressed as 2−ΔΔCt[72]. The PCR efficiency was approxi-mately 100%.
Evaluation of protein degradation
Protein degradation was evaluated after protein synthesis inhibition by the administration of 30μg/mL of CHX to HCT 116 cells incubated 24 h before without or with 25 mM glucose. A time course was performed by western blot analysis of whole cell extracts.
Bioinformatics analysis
Gene expression (RNA-seq) data from the TCGA colorectal and liver (HCC) cancer cohort was downloaded from the cBioportal for Cancer Genomics (http://www.cbioportal.org) using CGDS-R [73,74] following TCGA guidelines (http://cancergenome.nih.gov/publications/ publicationguidelines). Individual gene expression values for the genes of interest as normal-ized RNA-Seq by Expectation Maximization (RSEM) read counts pre-processed through the TCGA/cBioportal projects. RSEM values less than 1 were set to 1 to avoid negative expression values upon log2-tranformation if necessary. The “Regulation of Response to Oxidative Stress” and “HALLMARK_WNT_BETA_CATENIN_SIGNALING”β-catenin gene expression signa-tures were obtained from the Molecular Signasigna-tures Database (MSigDB) (http://www.
broadinstitute.org/msigdb) [75]. All colorectal or HCC cancer samples were ordered by increasing expression values of the average expression of the HALLMARK_WNT_BETA_CA-TENIN_SIGNALING gene set. The moving average expression of the “Regulation of Response to Oxidative Stress” gene set or GYS2 expression was calculated using a sample window size of
n = 20, and trendlines were added to the barplots. An R-script for calculating and generating
moving average plots of TCGA cancer cohorts implementing TCGA access via cBioportal has been described previously [76]. An asymptotic Spearman correlation test using original log2 expression values, not the moving average, was used to determine the significance of the Spear-man rank correlation. Analysis of TCGA data by Kaplan Meier plotter available athttp:// kmplot.com/analysis/index.php?p=background[77].
Patient samples
A total of 95 patients diagnosed with stage II colorectal cancer who underwent surgery at Gen-eral and Digestive Tract Surgery Department, Fundacio´n Jimenez Diaz University Hospital, Madrid, Spain, were assessed for eligibility. Clinicopathological characteristics of patients are summarized inS1 Table.
TMA, immunohistochemistry, and quantification
Human samples. A TMA was constructed using the MTA-1 tissue arrayer (Beecher
Instruments, Sun Prairie) for immunohistochemistry analysis and contained 95 cores. Each core (diameter 0.6 mm) was punched from pre-selected tumor regions in paraffin-embedded tissues. We chose central areas from the tumor, avoiding foci of necrosis. Staining was con-ducted in 2-μm sections. Slides were deparaffinized by incubation at 60˚C for 10 min and incubated with PT-Link (Dako, Agilent) for 20 min at 95˚C in low pH to detect p-AMPK (T172) antigen, or high pH buffered solution to detect 8-OHdG and pEP300 (S89) antigens.
To block endogenous peroxidase, holders were incubated with peroxidase blocking reagent (Dako, Agilent) and then with the following dilutions of antibodies: 1:250 of anti-8-OHdG to detect ROS [78,79] 1:100 of anti-phospho-EP300 (S89) for 20 min or overnight incubation with a 1:50 dilution of anti-pAMPK (T172). All previously described antibodies presented high specificity. After that, slides were incubated for 20 min with the appropriate anti-Ig horse-radish peroxidase-conjugated polymer (EnVision, Dako, Agilent) or, in the case of 8-OHdG, with 1:200 anti-goat-HRP (Bethyl Labs) to detect antigen-antibody reaction. Sections were then visualized with 3,3’-diaminobenzidine (Dako, Agilent) as a chromogen for 5 min and counterstained with Harrys’ Hematoxylin (Sigma Aldrich, Merck). Photographs were taken with a stereo microscope (Leica DMi1).
According to the human protein atlas (available athttp://www.proteinatlas.org), a human intestinal tissue was used as a positive control for immunohistochemical staining to determine anti-phospho-EP300 (S89) concentration, a human kidney tissue for anti-pAMPK (T172) and human brain tissue for 8-OHdG.
Immunoreactivity of tumor sample was quantified blind with an Histoscore (H score) that considers both the intensity and percentage of cells stained for each intensity (low, medium, or high) following this algorithm (range 0–300): H score = (low%)× 1 + (medium%) × 2 + (high %)× 3.
Quantification for each patient biopsy was calculated blindly by 2 investigators (MJFA and JMU). pEP300 (S89) showed nuclear staining, pAMPK (T172) and 8-OHdG were mainly cyto-plasmic, andβ-catenin was in the nucleus and cytoplasm.
Mouse samples. Whole intestines were prepared as Swiss-rolls, paraffin embedded, and
sections (5μm) were stained/counterstained with PAS/hematoxylin to detect the presence of glycogen and with the relevant antibodies as for human samples.
Statistical analysis
Results are presented as fold induction, mean± SEM from 3 biological replicates. Tests for sig-nificance between 2 sample groups were performed with Studentt test and ANOVA with
Bon-ferroni’s post-test for multiple comparisons. Differences were considered statistically significant ifP � 0.05.
For immunohistochemical expression, the Kolmogorov-Smirnov test was used to deter-mine whether calculated H scores for each of the antigens were well-modelled by a normal dis-tribution. In our series, only pEP300 (S89) revealed normal disdis-tribution. Linear correlation between parametric variables (pEP300 [S89]) was evaluated by the Pearson test and nonpara-metric variables by Spearman’s test. pEP300 (S89) H_score was categorized as low or high expression levels using the median as the cut-off point since it showed a normal distribution.
Supporting information
S1 Fig. Glucose-induced EP300 correlates with increased Ace-H3K9 and pro-proliferative β-catenin target gene expression in CRC cells. Related toFig 1. Cells were starved of glucose for
36 h (−) before addition of 5 mM or 25 mM glucose for 24 h (A) or glucose 25 mM for 24 h (+) (B–D). C646 (5μM) was added for 24 h where indicated. (A) Representative western blots of EP300 and statistical analysis of cytoplasmic (CE) or nuclear (NE) extracts from indicated cell lines. GAPDH or TBP are loading controls for cytoplasmic and nuclear fractions, respectively. (B) Confocal immunofluorescence images of STC-1 cells using indicated antibodies (scale bars repre-sent 25μm) and quantification of fluorescence intensity using ImageJ software (lower panel); for each experiment, 3 different fields were evaluated per slide. (C) Representative western blot and statistical analysis of the correlation between glucose induction of EP300 and H3K9 acetylation in
gastrointestinal cancer cell lines. The selective EP300 inhibitor C646 abolishes EP300 and H3K9 acetylation. Statistical analysis by one-way ANOVA (A) and (C) or Studentt test (B); n � 3;�P <
0.05,��P < 0.01;���P < 0.001. See individual data atS1 Dataand underlying raw images atS1 Raw Images. CE, cytoplasmic extracts; CRC, colorectal cancer; EP300, Histone acetyltransferase p300; GAPDH, Glyceraldehyde 3-phosphate dehydrogenase; H3K9 Ace, Histone H3 Lysine 9 acetylated; NE, Nuclear extracts; TBP, TATA-box-Binding Protein.
(TIF)
S2 Fig. Glucose selectively induces pAMPK (T172) in gastrointestinal cancer cells. Related toFig 2. (A) Kinase induction was analyzed in STC-1 whole cell extracts; H2O2(100μM),was
used as positive control for induction of pERK, pAKT, pp38, and pAMPK activation. GAPDH, loading control. Kinases previously reported to modify EP300 were studied. AKT, Serine-Threonine Kinase AKT or PKB; AMPK, AMP-activated protein kinase; ERK, ERK, extracellu-lar signal-regulated kinase 1; GAPDH, Glyceraldehyde 3-phosphate dehydrogenase; P38, Mitogen-activated protein kinase P38
(TIF)
S3 Fig. A constitutively active AMPK mutant induces EP300; EP300 is downstream of AMPK. Related toFig 3. (A) Whole cell extracts of STC-1 cells transfected with a Myc-tagged
deletion mutant of AMPK catalytic subunit that is constitutively active (CA) for 48 h and then starved of, or treated with, glucose (25 mM) for 24 h. Note the molecular weight of the myc-AMPKα1-CA is 37 KDa versus 63 KDa of the full length since it contains only amino acids 1–312 [32]. (B) The EP300 inhibitor C646 (5μM) was added to STC-1 or HCT 116 cells cul-tured as previously described for the last 24 h. C646 inhibition did not abolish AMPK induction by glucose. (C) HCT 116 cells transfected with control or pCDNA3-Flag-EP300 expression vec-tor were cultured as previously described to analyze whether EP300 alters glucose induction of AMPK. Statistical analysis (B–C) by one-way ANOVA;n � 3;�P < 0.05,��P < 0.01;���P <
0.001. Individual data can be found asS1 Dataand underlying raw images atS1 Raw Images. AMPK, AMP-activated protein kinase; GAPDH, Glyceraldehyde 3-phosphate dehydrogenase; EP300, Histone acetyltransferase.
(TIF)
S4 Fig. Glucose metabolism increases ROS/AMPK/EP300 activity in gastrointestinal can-cer cells, whereas in liver cancan-cer GYS2 expression prevents ROS accumulation in response to glucose 25 mM and associates with higher patient survival. Related toFig 4. Cells starved
of glucose for 24 h prior to re-feeding for the indicated times with 25 mM glucose or with indi-cated treatments were analyzed by western blotting in (A–B), (E), (H); by immunofluorescence in (D) and (G); or by flow cytometry in (F). (A) Effect of osmotic stress on AMPK/EP300 using 5 mM or 25 mM mannitol. (B) Inhibition of glucose metabolism with 5 mM 2-DG for 24 h, effect on AMPK/EP300. (C) Kaplan Meier analysis of the TCGA liver cancer patient cohort, ranked by GYS2 expression; GYS2 used as readout of glycogen synthesis capacity. Sur-vival of patients with high and low GYS2 expression, red and blue lines, respectively.P =
0.0003872. (D) Accumulation of ROS in response to glucose or H2O2as positive control,
ana-lyzed by DCF-DA (0.5μM) labeling followed by immunofluorescence of indicated cell lines. H2O2(100μM) was added for the last 30 min as positive control of ROS signaling. (E) Time
course to compare pAMPK (T172) induction by glucose in gastrointestinal cancer cells but not in liver cancer cells. Positive control of increased ROS, by exposure to H2O2(100μM) for
the last 30 min, induce pAMPK (T172) in HCT 116 and Hep G2; pERK 1/2: positive control. Representative western blots and statistical analysis. (F) GYS2 depletion in liver cancer cells allows ROS accumulation in response to glucose 25 mM. Cells transfected with control or