/
An Analysis of Air Sparging/Soil Vapor Extraction Systems
Emphasizing Volatilization Kinetics in JP-4 Jet Fuel
by
Karen R. Jones
B.S., Environmental Engineering Tulane University, 1995
Submitted to the
Department of Civil and Environmental Engineering in Partial fulfillment of the Requirements for the Degree of
MASTER OF ENGINEERING in Civil and Environmental Engineering
at the
Massachusetts Institute of Technology May 10, 1996
C 1996 Karen Renae Jones, all rights reserved. The author hereby grants MITpermission to reproduce
and to distribute publicly paper and electronic copies of this thesis document in whole or in part.
Signature of Author
Department of CiWl & Environmental Engineering Massachusetts Institute of Technology
Certified by
Assistant Professor, Civil and Environmental Engineering Thesis Supervisor Accepted by
Joseph M. Sussman Chairman, Departmental Committee on Graduate Studies
, A3SACHUSETTS INST:TUTE
OF TECHNOLOGY
JUN 0
5
1996
gn,
An Analysis of Air Sparging/Soil Vapor Extraction Systems
Emphasizing Volatilization Kinetics
in JP-4 Jet Fuel
by
Karen Renae Jones
Submitted to the Department of Civil and Environmental Engineering on May 10, 1996 in partial fulfillment of the requirements of the degree of
Master of Engineering in Civil and Environmental Engineering
ABSTRACT
Air Sparging is a soil/groundwater remediation techology that injects air into the water saturated zone of the subsurface. The sparged air rises within the aquifer and removes dissolved organic contaminants through air/water volatilization and aerobic biodegradation. This system is most applicable for the removal of petroleum hydrocarbons and volatile organic compounds (VOCs), in soils with high conductivities and homogeneous characteristics.
Despite the abundance of research in this field, air flow behavior in the subsurface is not well understood. Consequently, the designs of sparging systems often involve 'trial and error' decisions and are based primarily on isolated pilot studies.
In the case when there is a 'free-product' source at the top of the water table, volatilization processes become the limiting factor for contaminant removal and, consequently, air-sparging remediation times can be extended. A remedial estimate that deals with this scenario can be calculated by analyzing the vaporization and partial pressure kinetics of a multi-component Non-Aqueous Phase Liquid (NAPL) in the subsurface. This thesis presents such an estimate. The "case site" used for the study was the Fuel Spill 12 (FS-12) contaminant plume at the Massachusetts Military Reservation in Cape Cod.
Using a spreadsheet model to simulate the remediation process, remedial rates and corresponding 'clean-up' times indicated that the sparging process would take more than 10 years of operation to reduce the levels of contamination in the FS-12 plume to the maximum acceptable contaminant levels (MCLs). This is more than five times greater than the existing site esimate, which was based on similar physical principles.
The contribution of biodegradation to the removal process was also investigated, and the options for its enhancement are discussed. Post-sparging subsurface processes, such as dilution and dispersion, command further research and study in order to obtain more accurate contaminant degradation rates within the source vicinity during remedial action at this site.
Thesis Supervisor: Professor Patricia Culligan-Hensley
ACKNOWLEDGEMENTS
There are many people who have been instrumental in helping me achieve this work. Thinking back over the year, a few words come to mind: insightful, instructive, intense,
and... yes, even fun. I'd like to take this page to express my gratitude to the following individuals without whom, this never would have come together.
Trish Culligan-Hensley, for her graciously volunteered time, constructive insight,
incredible flexibility, and genuine interest my work and progress. Her ideas and
revisions have helped mold this paper into something truly worthy of print. Lynn Gelhar, for his constructive advice and questioning thought process. He
repeatedly proved to me the benefits of critically analyzing the underlying assumptions behind published data.
Phillip M. Gschwend for "creating" the time to meet with me as an unofficial advisee. He provided sound support and often guided me to answer my own questions. Most of
all, thanks for helping me to temporarily set aside my 'engineering' mindframe and approach this thesis from a chemist's point of view.
Thanks to Dr. David Marks and Shawn Morrissey for their enthusiam in the M.Eng program and never-ending encouragement.
My fellow M.Eng "FS-12" group: Holly Goo, Christophe Bosch, Mitsos
Triantopoulos, Judy Gagnon, and Vanessa Riva, for creating a positive working
environment, and a true sense of togetherness for the past five months. (And, of couse, for covering for me in my pursuit of a future income). Christ Khachikian, for patiently helping me decipher Phil's advice and keep my sanity with the computers...as well as
other things.
Ed Pesce and his staff from the Air National Guard Installation Restoration Program for all their cooperation and willingness to provide us with data and help us in every way possible.
Finally, my parents, Tom and Sharon Jones, for their long-distance support and encouragement. Without them, I would have never been able to achieve all that I have.
TABLE OF CONTENTS
ABSTRACT ...
...
2
ACKNO W LEDGEM ENTS ...
3
LIST OF FIGURES...
8
LIST OF TABLES...
10
1. INTRODUCTION ...
11
2. STUDY AREA CHARACTERIZATION...
13
2.1 THE MASSACHUSETTS MILITARY RESERVATION SUPERFUND SITE... 14
2.1.1 Physical Characteristics ... ... ... 14
2.1.1.1 L ocation ... ... ... 14
2.1.1.2 Topography and Geology...14
2.1.1.3 Geology and Hydrogeology ... 16
2.1.1.4 C lim ate ... . ... ... ... 16 2.1.1.5 Ecosystem s... ... 18 2.1.2 Socio-Economic Characteristics ... ... ... ... ... 18 2.1.2. 1 D em ographics ... ... ... 18 2.1.2.2 W ater Use... ... ... 19 2.1.2.3 Econom y ... ... ... 19 2.1.3 H istory...20 2.1.3.1 A ctivity H istory... ... ... 20 2.1.3.2 R egulatory H istory ... ... ... 20
2.1.3.3 Contam ination H istory ...21
2.2 THE FUEL SPILL 12 - A CASE STUDY... 23
2.2.1 Physical Site Data ... ... 23
2.2.1.1 G eology of F S-12... ... ... 25
2.2.2 S ite H istory... ... ... ... 2 6
2.2.3 Extent of Contamination ... 27
2.2. 4 C urrent Situation ... 28
3. FINDINGS ...
3
3.1 MODELING OF THE PLUME ... ... 30
3.1.1 Model Description and Development ... ... 30
3.1.2 Assessment Of Model Results... ... 36
3.1.2.1 N atural Groundwater Flow...36
3.1.2.2 C ontam inant Tracking... ... 37
3.1.3 Surface W ater Impacts ... ... 41
3.2
TREATMENT ALTERNATIVES ... ... 433.2.1 No Action Alternative... 43
3.2.1.1 Background Information ... ... 43
3.2.1.2 Process D escription ... ... ... 44
3.2.1.3 Application at FS-12 ... 46
3.2.2 Source Control -Air Sparging... ... 49
3.2.3 P lum e C ontainm ent... 50
3.2.3.1 Pump and Treat - Extraction Well Fence ... ... 50
3.2.3.2 Reactive W all...55
3.3
W ATER SUPPLY ISSUES ...
61
3.3.1 Current Water Situation In The Upper Cape Water Districts... 61
3.3.1.1 Water Uses ... 61
3.3.1.2 W ater R esources... ... ... 62
3.3.1.3 W ater Q uality ... ... ... 63
3.3.1.4 Future Water Demand In The Upper Cape Water Districts...64
3.3.2 Impact Of Do nothing Alternative On Water Supply...64
3.3.2.1 A lternative W ater Supplies ... 64
3.3.2.2 Investments And Costs Required ... 67
3.3.3 Impact On Water Supply After Remediation... .. 68
3.3.3.1 Avoided Investm ents And Costs ... 68
3.3.3.2 Feasibility Of Beneficial Use Of Treated Plume Water ... 68
3.4
COST-BENEFIT ANALYSIS ... ... ... 743.4.1 Cost-Benefit Analysis: General Issues And Methodology ... 76
3.4.2 Cost-Benefit Analysis: The MMR Superfund Site ... 77
3.4.2.1 Baseline Definition And Remedial Actions Considered ... ... ... 77
3.4.2.2 Identification And Estimation Of The Types Of Benefits... ... 78
3.4.2.3 Costs versus Benefits ... 85
3.4.3 Economic Analysis: A Case Study Of The Fuel Spill 12... 86
3.4.3.1 Cost-Effectiveness Analysis...87
3.4.3.2 Cost-Benefit Analysis ... ... ... 88
4. GROUP WORK CONCLUSIONS AND
RECOM M ENDATIONS ...
91
5. DETAILED INDIVIDUAL STUDY...
96
5.1
BACKGROUND TECHNOLOGY DEVELOPMENT AND DESCRIPTION... 965.1.1 Key Mechanisms of the AS Remedial Process ... 99
5.1.1.1 M ass Transfer... ... ... 99
5.1.1.2 Biodegradation/Bioremediation ... ... 100
5.1.1.3 Background Thermodynam ics ... ... ... 101
5.1.2 Optimal conditions for successful sparging... ... 105
5.1.2.1 Process Constraints ... 105
5.1.2.2 Technology Limitations ... ... ... ... 106
5.1.2.3 Existing sparge/vapor extraction site characteristics... 107
5.1.3 Technology Costs and Associated Risks ... 107
5.2 DISCUSSION OF CURRENT THEORIES AND MISCONCEPTIONS OF AIR SPA RGIN G ... 110
5.2.1 Channel vs. Bubble theory ... 110
5.2.2 Areas of Limited Understanding... 116
5.2.2.1 Estimating Remedial Completion ... 116
5.2.2.2 General Representation of JP-4 Jet Fuel ... ... ... 119
5.2.2.3 Performance Assessment Difficulties... ... 120
5.3
DETERMINATION OF REMEDIATION TIME ESTIMATE...121
5.3.1 Introduction ... ... 122
5.3.1.1 Determination/Confirmation of free product spill volume... ... .... 124
5.3.2 Description ofJP-4 Jet fuel ... 128
5.3.2.1 Health Hazard Information... ... 128
5.3.2.2 Breakdown of chemical componets ... 128
5.3.3 Remediation Simulation Model ... 130
5.3.3.1 M echanisms of component volatilization.. ... ... 131
5.3.3.2 Set-up/Design of Sparge M odel ... ... ... 132
5.3.4 Results for Source Control...136
5.3.4.1 Mole Fraction to Groundwater Concentration ... 136
5.3.4.2 Time for contamination to reach below MCL ... 138
5.3.4.3 Amount of contamination left after projected two year sparging... 139
5.3.5 Clarification of Results ... 140
5.4 ROLE OF BIODEGRADATION IN THE AS/SVE PROCESS ... 142
5.4.1 Process D escription ... ... 143
5.4.2 On-Site use, enhancement, and optimization... 144
6. CONCLUSIONS AND FUTURE STUDY PERTAINING
TO INDIVIDUAL OBJECTIVES ...
146
6.1
ANALYSIS OFFS-12
PLUME REMEDIAL PLAN AND PROCEDURES ...146
6.2
INDIVIDUAL STUDY CONCLUSIONS ... 1476.3 FUTURE WORK...
148
REFERENCES ...
149
LIST OF FIGURES
FIGURE 2-1- LOCATION OF THE M M R... 15
FIGURE 2-2 - HYDROGEOLOGY OF THE MMR... 17
FIGURE 2-3 - PLUM E AREA M AP ... ... 22
FIGURE 2-4 - FS-12 A REA M AP ... ... 24
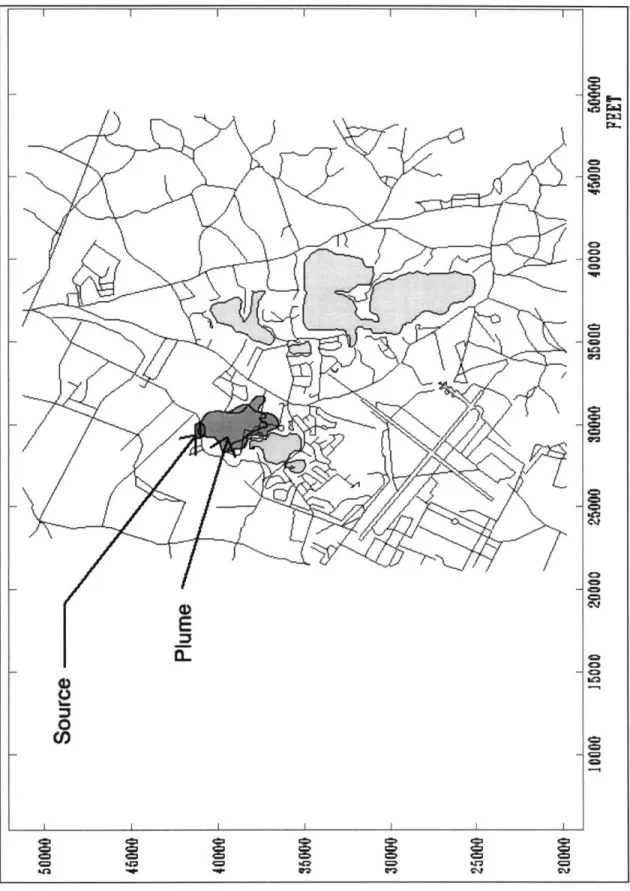
FIGURE 3-1- AREA MAP: PLUME LOCATION AND EXTENT OF CONTAMINATION...32
FIGURE 3-2- G RID A REA ... ... 33
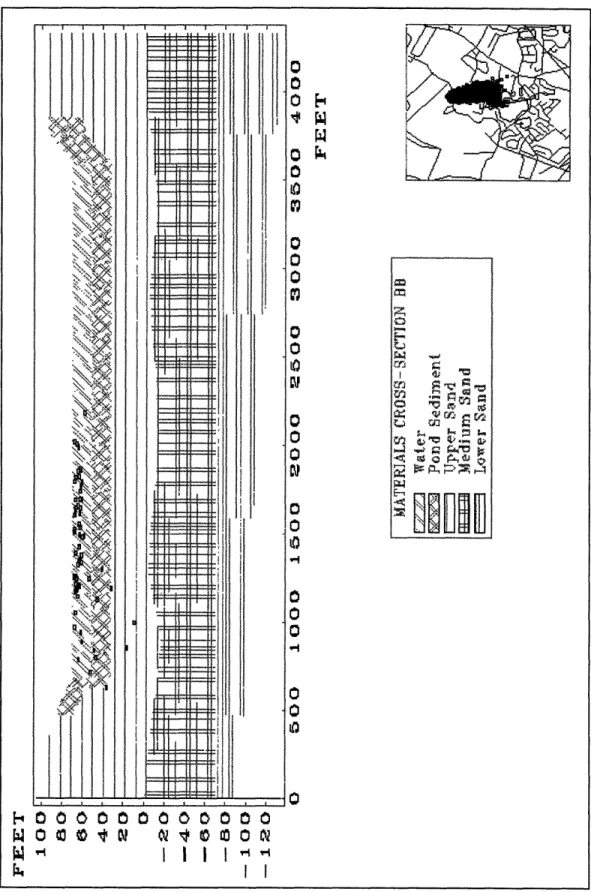
FIGURE 3-3 -CROSS-SECTION SHOWING LAYERS AND MATERIALS... ... 34
FIGURE 3-4 - WATER TABLE ELEVATIONS (FEET)...38
FIGURE 3-5 - SIMULATED BENZENE PARTICLES ... 39
FIGURE 3-6 - CROSS-SECTION ACROSS PLUME ... ... 40
FIGURE 3-7- CROSS-SECTION ACROSS SNAKE POND SHOWING PARTICLES ... ... 42
FIGURE 3-8 -LONG-TERM CONTAMINANT TRANSPORT...47
FIGURE 3-9 -EXTRACTION WELL FENCE AND OBSERVED PLUME LOCATION...54
FIGURE 3-10 -PLAN VIEW OF PARTICLE CAPTURE BY EXTRACTION WELL FENCE ... 54
FIGURE 3-11 -CROSS SECTION OF PARTICLES CAPTURED BY THE EXTRACTION WELL FENCE...55
FIGURE 3-12 -PERMEABLE REACTIVE WALL USED IN CONJUNCTION WITH FUNNELING BARRIERS...56
FIGURE 3-13 -No ACTION ALTERNATIVE- NUMBER OF ADDITIONAL CANCERS DEVELOPED OVER THE NEXT 25 Y EA R S ... ... 79
FIGURE 3-14 -LOSS ON PROPERTY VALUES DUE TO MMR CONTAMINATION ($ MILLION)...81
FIGURE 3-15 -PRIMARY BENEFITS ACCRUING OVER 1995-2020 ($ MILLION, CUMULATIVE) ... 82
FIGURE 3-16 -UPPER CAPE ECONOMIC BASE (TOTAL $610 MILLION, 1992) ... 83
FIGURE 5-1. COMBINED AIR SPARGING/VACUUM EXTRACTION DIAGRAM ... 98
FIGURE 5-2. PHASE FUGACITIES... ... 103
FIGURE 5-4. AIR SPARGING (SPARGE VAC) "BUBBLE FLOW" THEORY ... 113
FIGURE 5-5. IN SITU SPARGING "CHANNEL FLOW". ... 113
FIGURE 5-6. SUBSURFACE CHANNELING PATTERNS... 114
FIGURE 5-7. EXTRACTED VAPOR CONCENTRATION OF AIR SPARGING SYSTEM ... 17
FIGURE 5-8. AREAL VIEW OF FREE PRODUCT SOURCE ... 126
FIGURE 5-9. MOLE FRACTION OF CONTAMINANT IN JP-4 vs. SPARGE TIME ... 135
FIGURE 5-10. CONCENTRATION IN FREE PRODUCT VS. SPARGE TIME... ... 138
LIST OF TABLES
TABLE 2-1- A QUIFER PROPERTIES ... ... 26
TABLE 3-1- CONTAMINANTS OF CONCERNS: COMPARISON OF AVERAGE AND MAXIMUM CONCENTRATIONS IN THE FS-12 PLUME AGAINST ESTABLISHED MCLS ... ... 47
TABLE 3-2 -AN ASSESSMENT OF WATER REINJECTION/EXTRACTION RATIOS AND WATER COSTS ... 69
TABLE 3-3 -IMPACT OF PERCEIVED RISK ON ECONOMIC BASE ... ... 84
TABLE 3-4 -DISCOUNTED COSTS AND BENEFITS FOR THE PERIOD 1995-2020 ... 86
TABLE 3-5 -DISCOUNTED COSTS FOR THE PERIOD 1995-2020 (INTEREST RATE = 5 %) ... 87
TABLE 5-1. CONDITIONS AFFECTING APPLICABILITY OF AIR SPARGING,(AFTER LODEN, 1992)... 106
TABLE 5-2. SUMMARY OF PUBLISHED AIR SPARGING SITES ... 109
TABLE 5-3. JP-4 JET FUEL PHYSICO-CHEMICAL DATA, (AFTER DAVIS, 1996)... 127
TABLE 5-4. DISTRIBUTION OF MAJOR COMPONENTS IN JP-4, (AFTER LI, 1994). ... 129
1. Introduction
The bulk of the Comprehensive Environmental Response, Compensation, and Liability Act (CERCLA) legislation, or the so-called "Superfund", established a 'release response' procedure for hazardous substances and clean-up strategy for uncontrolled waste sites which threaten human health and the environment. Several new dimensions were added to the Act in 1986, one of which provided rules for remedial action selection. It currently covers such parameters as selection review, degree of cleanup, and strongly urges the use of onsite treatment that "...permanently and significantly reduces the volume, toxicity, or mobility of hazardous substances...". Selection requirements of remedial action indicate a choice which is "...protective of human health and the environment, that is cost-effective, and that utilizes permanent solutions and alternative treatment technologies or resource recovery technologies to the maximum extent practicable" (Frank, 1995). One such remediation process is In Situ Aeration, or 'Air Sparging', which can treats soil and groundwater contaminated with volatile organic compounds or petroleum hydrocarbons. Air sparging focuses on the development of an innovative solution that can be efficiently and effectively used to replace traditional pump-and-treat or soil excavation systems (Westinghouse-VOC's, 1995).
The Massachusetts Military Reservation (MMR), located on Cape Cod, Massachusetts, has housed numerous branches of the military since 1911. Military activities on the reservation have been extensive. These activities have left their mark on the MMR. Because of extensive contamination at the site, the MMR was placed on the
National Priorities List (NPL) and has been declared a Superfund site. The cleanup at this site is being handled by the Installation Restoration Program (IRP) with offices on the reservation. The actions currently being taken to remediate the site are deemed "interim"; only the source and leading edge of the identified plumes will be controlled. Remediation of the majority of the plumes are not included within this plan.
The primary focus of this indiviual study is to estimate the total remediation time necessary for the source control of a fuel spill that is contaminating an aquifer at the site. The performance of this estimation includes the formulation of a 'sparge model' spreadsheet simulation that emphasizes the chemically-determined volatilization rates of each component in jet fuel. Previous approaches are typically based on more physical modeling processes which concentrate on mass transfer flux rates, chemical diffusion, and dispersion. On an introductory level, this thesis also discusses air sparging in reference to its advantages, limitations, optimal conditions, common misconceptions, and influence on biodgradation. Finally, it includes an assessment of the existing remedial procedures at FS-12.
Fuel Spill 12 (FS-12) is one of ten identified plumes emanating from the MMR. It is located in the northeast section of the reservation. This plume is the result of a leak in a pipeline which carried JP-4 fuel to the reservation. It is estimated that 70,000 gallons of jet fuel was spilled. Two contaminants within the fuel which pose health hazards are ethylene dibromide (EDB), used as an additive, and benzene, a component of the fuel. These contaminants are known carcinogens. Currently, the FS-12 source is being controlled through air sparging and soil vapor extraction. However, the remainder of the
plume is still moving. The nearby Snake Pond is used for recreational purposes and the plume is moving in that direction; however, predictions say the plume will not affect the pond.
The work presented in this thesis is been formulated around a group research effort on the Fuel Spill Number 12 plume at the Massachusetts Military Reservation. This project uses FS-12 as a case study to assess various remediation techniques and their applicability to a fuel-contaminated groundwater site; the project also deals with water supply issues in a general sense for the entire area. More specifically, the objectives of the project are:
* To determine the movement of FS-12 and its potential effects on Snake Pond; * To compare the "do nothing" alternative to treatment with three types of remediation schemes: pump & treat, air sparging & soil vapor extraction, and reactive wall technologies;
* To indentify the water supply issues surrounding groundwater contamination including: alternatives for water supply replacement (treatment of contaminated water, drilling new wells, etc.), and the public perception surrounding treatment ofgroundwater;
* To evaluate the decision to remediate at the MMR through a cost-benefit analysis.
Thus, the initial chapters presented here are based on group objectives and findings, while the specified 'title study' is detailed in Chapter 5.
2. Study Area Characterization
This section provides background information on the Massachusetts Military Reservation (MMR), as well as details on Fuel Spill 12 (FS-12). It covers physical and
sociological features of the local region.
2.1 The Massachusetts Military Reservation Superfund Site
2.1.1 Physical Characteristics
2.1.1.1 Location
The MMR is located in western Cape Cod, bordering the townships of Bourne, Falmouth, Mashpee, and Sandwich. The expanse of the MMR includes 22,000 acres located in Barnstable County (Figure 2-1).
2.1.1.2 Topography and Geology
The MMR is located on two distinct types of terrain on the Cape Cod Peninsula. The main Cantonment Area lies on a broad, southward-sloping glacial outwash plain. Elevation in the area ranges from 100 to 140 feet above sea level. To the north and west
T•o 3itoa
To
Now
Approximat Scale
(Stone & Webster, 1995)
Figure 2-1- Location of the MMR
of the MMR, the terrain becomes hummocky with irregular hills and greater topographic relief, and lies in the southward extent of Wisconsin Age terminal moraines. The highest elevation is 306 feet (Stone & Webster, 1995). The entire site is dotted with numerous kettle holes and depressions forming ponds and lakes.
2.1.1.3 Geology and Hydrogeology
Geology
The area is categorized as a glacial outwash plain. Typically, the plain consists of highly permeable sand and gravel, as well as distinctly stratified layers of lower permeability silty sands and clays.
Hydrogeology
A single groundwater flow system underlies western Cape Cod, including the MMR. The aquifer system is described as unconfined and is recharged by infiltration from precipitation. Accordingly, the aquifer has been characterized by the US Environmental Protection Agency (EPA) as a sole-source aquifer. The high point of the water table is located beneath the northern portion of the MMR (Figure 2-2). Flow is generally radially outward from this mound. The ocean forms the lateral boundary of the aquifer on three sides.
2.1.1.4 Climate
Cape Cod has a temperate climate with precipitation distributed year round. The annual average precipitation is about 47 inches, and annual groundwater recharge is in the range of 0.67 to 0.91 inches/year (Department of Environmental Management, 1994).
The highly permeable nature of the sands and gravels underlying the area allow for rapid infiltration of rainfall. It 9BI •°. :h •bE
eA
.
.g *... " . *s.. "" "- -* .. - * l i l t -t:*:* 6.5 ... *(Department of Environmental Management, 1994)
Figure 2-2 -Hydrogeology of the MMR
2.1.1.5 Ecosystems
The Massachusetts Division of Fisheries and Wildlife considers coastal plain ponds as unique, sensitive natural communities in the state. These ponds, found primarily in Cape Cod, occur in glacial kettle holes lacking surface water inlets. The specialized and rare ecosystem that develops on the shores of these ponds is highly sensitive to water level changes. (Department of Environmental Management, 1994)
2.1.2 Socio-Economic Characteristics
The Upper Cape area comprises of the townships of Falmouth, Sandwich, Mashpee and Bourne. This section discusses demographics, water use, and local economics pertaining to the MMR.
2.1.2.1 Demographics
The MMR has a year round population of approximately 2,000 people with an additional 800 nonresident employees. Both year round and seasonal residents live in the towns adjacent to the MMR - Falmouth, Mashpee, Sandwich, and Bourne. The population of these towns fluctuate significantly between winter (29,000) and summer (70,000) due to the influx of vacationers. Between 1980 and 1990, the Upper Cape population grew by 35%. However, the township of Mashpee registered a 113% increase. During the same period, population growth throughout Massachusetts
amounted to only 5% (Cape Cod Commission, 1996). Due to the fact that the Upper Cape is sparsely inhabited, the population directly affected by the plumes is relatively small -4,000 (current situation) to 6,500 (no action alternative, see Section 3.4.2.2).
2.1.2.2 Water Use
Public water supply customers are the primary water users on Cape Cod, with a base off-season average demand of 8 million gallons per day (mgd) and 16 mgd in-season. In the Upper Cape, 80% of the population is on a central supply system; the remaining 20% of the population relies entirely on individual private wells. For further information regarding water resources, see section 3.3 (Department of Environmental Management, 1994).
2.1.2.3 Economy
The Upper Cape economy was valued at $600 million in 1992; more than 60% of this figure was derived from tourists, seasonal residents, and retirement-based income (see Section 3.4.2.2). Hence, the economic base is believed to be highly sensitive to environmental contamination and associated perceived risk. The Upper Cape's overall valuation of real and personal property has increased by 3 times in the past 10 years to $8 billion in 1994 (Cape Cod Commission, 1996).
2.1.3 History
2.1.3.1 Activity History
Operational units over the MMR's history include the U.S. Air Force, U.S. Navy, U.S. Army, U.S. Marine Corps, U.S. Air National Guard, U.S. Army National Guard, and U.S. Coast Guard. The MMR has housed and served the U.S. military forces since 1911. Within the reservation, military activities included troop training and development, ordinance development, vehicle operation and maintenance, fire fighting, and fuel storage and transport. The MMR was particularly active during World War II (1940-1946). Between 1955-1970, the MMR operated a number of surveillance missions and aircraft operations through the Air National Guard. Since 1970, the military activities have been scaled down (Advanced Sciences, Inc., 1993).
2.1.3.2 Regulatory History
On November 21, 1989, the MMR was listed on the National Priorities List as a Superfund site. As a direct consequence, the National Guard Bureau (NGB) and the U.S. Coast Guard entered into an Interagency Agreement (IAG) with the EPA in July 1991. As a result, the site investigations and remedial actions are subject to the requirements and regulations of the Comprehensive Environmental Response and Emergency and Liability Act (CERCLA). The Department of Defense (DOD) formulated and organized the Installation Restoration Program (IRP) to address investigations and remediation
efforts as a result of hazardous waste sites at DOD facilities (Air National Guard, 1994). Through the Air Force Engineering Services Center, the NGB entered into an IAG with the U.S. Department of Energy (DOE). The NGB, with the support of DOE, analyzed the extent of contamination and potential site contamination at the MMR facility (Air National Guard, 1994).
2.1.3.3 Contamination History
Past releases of hazardous materials at the MMR have resulted in groundwater contamination in a number of areas. Documented sources of contamination include former motor pools, landfills, fire training areas and drainage structures such as dry wells. Nine major plumes of groundwater contamination (Figure 3) have been found to be migrating from these sources areas and have been defined during extensive groundwater investigations. Seven of the nine plumes have migrated beyond the MMR facility boundary. Extraction and treatment of groundwater have already been initiated for the purpose of containing one plume, the CS-4 plume, to manage the migration of contaminants and prevent further pollution of downgradient areas. The interim action planned by the IRP proposes to extend plume containment schemes to six other plumes.
i;;1-1-7 sum-it "\X <:~.x UII i I I , i. '" ~jp 1)(( r; r~u~m ~;~~CIJ ILF 9 I'
r,, 'i
f~,jz ii /171 4,) 1 P 1 3 ~4-c~'] ii, , S;it · tii
:li ~jsl 7 :I-i_ L- I Io t t 4~i: " ,, ~2: .I ~S~e~-1) i 'I-II
. F 5 OF QAL GROUNDATER m u w a unN
- -RIVER/POND/STRAM 'ELEVATION (FEET MSL) a rusm mmaW
lUb in- mU gnau Fe on
COMPOSITE MCL EXCEEDANCE I" UM w n"nmm
or = a mm 0 qNV 5700
SOLVENT GROUNDWATER CONTAMINATION "U
mKm am R ano mon a ,
COMPOSITE MCL EXCEEDANCE 14QSCALE
IN FEET
FUEL GROUNDWATER CONTAMINATION
-COMPOSITE MCL EXCEEDANCE -Plume Area Map
EDB CONTAMINATION 0 P
WATER Massachusetts Military Reservation 0""IP
MUi
souc. u E. yom CEoenC Cape Cod, Massachusetts
Ma•. ,ees
2.2 The Fuel Spill 12 - A Case Study
2.2.1 Physical Site Data
The FS-12 area is located within the Mashpee pitted plain, with a substrata consisting of outwash sands and gravels. The subsurface contains discontinuous lenses of low and high permeability that extend down to 130 feet below the water table. On average, the unconfined Cape Cod aquifer lies 90 feet below ground level. It surfaces at Snake Pond which is located south-southwest of the source. Horizontal groundwater velocities in the area average 0.15 feet/day. This velocity is less than characteristic rates for other plumes on the MMR because the FS-12 area is located near the crest of the water table mound where the hydraulic gradient is small. Horizontal hydraulic conductivities range from 150 to 400 feet/day.
The topography consists of low relief and rolling hills. Elevations range from approximately 200 feet mean sea level (MSL) to 50 feet MSL. Generally, the north-northwestern portion is characterized by higher relief. Topographical elevation decreases in a southeastern direction. Several water bodies are present in the area surrounding the zone of contamination.
The case study site area, FS-12, is sparsely populated, although a summer camp is located off-base directly south of the source. Most of the contamination flows beneath Camp Good News, as can be seen on Figure 2-4.
Scale 1:25 000
'L@MNIMM- A
(Stone & Webster, 1995) Figure 2-4 -FS-12 Area Map
kmc -medm -me --mi 0 I
2.2.1.1 Geology of FS-12
FS-12 is located within the Mashpee pitted plain. The Mashpee pitted plain is characterized by coarse grained materials, mostly sands and gravels. The sand and gravel grains become finer with depth. Throughout the entire depth of the outwash there exists discontinuous lenses of fine sands, clays and silts left from ice and glacial sediments. The sand and gravel materials are underlain by the bedrock. In the FS-12 area, the bedrock elevation ranges between 82 to 328 feet below MSL. Observations suggest the existence of fine sands and clay deposits at depths of 130 to 215 feet below MSL (Advanced Sciences, Inc., 1993). It is possible that these sediments are part of a continuous layer of finer materials within the sandy aquifer. However, there is not enough data to verify the existence of a continuous layer of finer sediments (HydroGeoLogic, Inc., 1994).
2.2.1.2 Hydrology
FS-12 is located above the Cape Cod aquifer. The aquifer is unconfined and its water table is located on average 80 feet below ground surface. The water table intersects the ground surface creating the following ponds in the area: Snake Pond, Peter's Pond, Mashpee Pond, and Wakeby pond. The groundwater flows in the south-southeastern direction. From the Feasibility Study (Advanced Sciences, Inc., 1993), it was determined that the horizontal hydraulic gradient varies between 0.0003 and 0.00067. An aquifer test indicated that the horizontal conductivity varies between 236.75 and 368.21 feet/day
(HydroGeoLogic, Inc., 1994). From the aquifer test, other properties were found, as shown by Table 2-1:
Table 2-1- Aquifer properties
Kr Kz / Kr Ss Sy
horizontal conductivity vertical/horizontal Specific Storage Specific Yield (ft/day) conductivity ratio
236.75 -368.21 0.05 - 0.55 0.000001 -0.00058 0.008 -0.184 (HydroGeoLogic, Inc., 1994)
The runoff from the site can be assumed to be insignificant due to the high permeability of the soils. The only significant form of recharge to the aquifer is rainfall, which averages approximately 23 inches/year (Masterson and Barlow, 1994).
2.2.2 Site History
The current FS-12 contamination area is the result of an extended leak in a fuel line discovered in 1972. The location of the leak is at the intersection of Greenway Road and the western entrance to the L-firing range. The pipeline was constructed in the early 1960's. Its main purpose was to transport aviation fuel from Cape Cod Canal to the Air National Guard flight line area. Both aviation gasoline and JP-4 jet fuel were carried in
the pipeline. In order to stop the leak, it underwent repairs in 1972. Part of the repairs included the use of contaminated soil as backfill for the excavation. Thus, even after the 1972 repairs, JP-4 fuel entered the subsurface soil and groundwater. The line was later closed in 1973. The IRP has estimated a spill volume of approximately 70,000 gallons, which currently contaminates 11 acres of soil. The plume originating from the FS-12 source area extends 5400 feet in length south-southeast from the spill, is 1,100 feet wide, 50 feet thick, and moves 0.75 to 1.35 feet/day.
2.2.3 Extent of Contamination
As estimated from evaluations of organic soil vapor concentrations, benzene and ethylene dibromide (EDB) are the primary contaminants of concern at FS-12. (Figure 2-4) maps out the extent of soil contamination from an areal view. EDB, a significant organic contaminant at this site, is not a component of jet fuel but was added to the aviation gas as a lead gas scavenger. It is present throughout the dissolved plume, though the free product does not constitute a continual source, as with benzene. When contaminants are not absorbed by soil particles or dissolved into the groundwater, they remain in the free phase form, also known as free product. Being less dense than water, the free product tends to float on top of the groundwater. The free product 'source' of the plume covers five acres ranging in thickness up to 0.7 feet. Near the spill, higher concentrations of benzene and EDB were measured at 1600 ppb and 600 ppb,
respectively. The plume extends in an elliptical shape, approximately 5000 feet downgradient (Advanced Sciences, Inc., 1993).
During the remedial investigation of FS-12, it was determined that EDB and benzene posed the greatest threat to human health. Their distributions are similar, with the EDB plume located at a slightly deeper depth in the aquifer than the benzene plume (HAZWRAP, 1994). Risk values were determined for the contaminants of concern based on groundwater exposure and future land use. Most probable carcinogenic risks far exceeded the EPA's upper limit for cleanup guidelines. Therefore, cleanup processes were promptly initiated. (Advanced Sciences, Inc., 1993)
2.2.4 Current Situation
After surveying applicable treatment schemes, the IRP selected a combined Air Sparging/Soil Vapor Extraction system to control the source and a well fence to contain the plume movement. The air sparging pilot study was deemed a success for two reasons: (1) the pressure differentials were conclusive enough to predict an adequate extraction well radius of influence and (2) field measurements were indicative of productive vapor extraction in the outwash sands and gravel (HAZWRAP, 1994). A
more detailed description can be found in source control, section 3.2.2.
Consequently, an air sparging/soil vapor extraction system was designed and quickly implemented to control the source area at FS-12. The air stripping action of the
sparging will transfer contamination from the aqueous phase into the vapor phase and carry it to the unsaturated zone. There it can be captured by the soil vapor extraction wells, and treated with catalytic oxidation and activated carbon in a vapor control unit. The combined system has been running since November 1995, though the first 100 days utilized only the vapor extraction wells. At the March 1996 FS-12 Sandwich Subcommittee Meeting, Mr. Edward Pesce of the IRP reported that clean-up of the source area is expected to take two years (HAZWRAP, 1994).
The Plume Containment committee meets regularly, and is involved in design analysis for site remediation. Preliminary designs indicate proposed locations for the five pump and treat wells that will capture and theoretically extract a total of 300-330 gallons/minute of contaminated groundwater. This will be treated and reinjected nearby. With an estimated start-up in September 1996, this process is not a final solution, but meets the immediate goals of the MMR in "source control and plume containment." The MMR is not currently planning to reuse any of the treated water, which means that 100% of it will be reinjected. Public perception of water reuse issues indicate a current unwillingness to drink any treated water. (Installation Restoration Program, July 1995). More details pertaining to ongoing FS-12 issues will be presented later in this thesis.
3. Findings
The results from the study of the FS-12 plume are presented in the sections below. First, the model of the plume is completed and analyzed for its effects on local surface water bodies. Second, four treatment alternatives are assessed for potential applications. Finally, water supply issues, including future water supply and public acceptance of drinking treated groundwater, are discussed. See the appendices for further details on the analyses.
3.1 Modeling of the Plume
A finite element model was used to simulate the natural flow of the groundwater. The primary application of the model was to track the contaminants from their source. The potential contamination of Snake Pond, a surface water body southwest of the pipe leak, was assessed using this model.
3.1.1 Model Description and Development
First developed in 1982 by Camp, Dresser & McKee, the DYN system programs were used to model the FS-12 plume. DYNFLOW solves the governing groundwater flow equation by finite element analysis. DYNFLOW is capable of simulating flow
under natural equilibrium conditions, as well as transient conditions induced by pumping. DYNFLOW bases its solution on an elemental grid. The nodes of the model form a three dimensional, trapezoidal element. The head and velocity vectors are calculated for each element in a time step process. Using the results from DYNFLOW, the plume migration was determined using DYNTRACK. DYNTRACK can simulate tracking for a simple single particle. In addition, it can simulate particle tracking for three dimensional, conservative, first order decay contaminants. DYNTRACK can also account for the absorption and dispersion of contaminants. (Camp, Dresser & McKee, 1992)
The first step in the model building process is to create a conceptual model. In order to determine the appropriate location and extent of the elemental grid, the following were analyzed: (1) topographical and geological maps (U.S.G.S., 1974; LeBlanc et al., 1986; Savoie, 1995), and (2) data from the FS-12 Remedial Investigation and Feasibility Study Reports (Advanced Science, Inc., 1993). The grid used for the model covered a much larger area than the actual contamination (Figure 3-2 and Figure 3-2) to appropriately represent and model the local stratigraphy and hydrogeology. The grid was
approximately triangular in shape and was defined by three sides. The elements of the grid were made smaller and denser in locations of greatest interest. These regions correspond to the plume, Snake Pond, and the proposed pumping fence location.
The left and upper right borders of the grid area were modeled as no-flow boundaries. The lower part of the right border, which included Peter's, Wakeby, and
Mashpee Ponds, was set at a fixed-head value equal to the water elevations of the ponds. For the bottom perimeter, fixed-head values between 40 ft and 45 ft MSL were specified
I Ir I I I I
Figure 3-1- Area Map: Plume Location and Extent of Contamination
*-i c
I
I
I
I I I I ia
iC7 = I c'-4= L. iI I I I I I I
uiL
= = = = .9Figure 3-2- Grid Area
I II
a a a 4 a 4
~111
for each of the nodes.
For the grid area, the bottom of the aquifer was bounded by bedrock from an elevation of approximately 82 to 330 feet below MSL (Oldale, 1969). The ground surface, whose highest point was about 200 feet MSL and the lowest 50 feet MSL, was defined by the topography of the local area (USGS, 1974). In the vertical direction, the model was subdivided into layers, defined between two levels, to represent the different
ILAY~ ER N1JuT_ n~ifl~F~e
r~-~----~
~ ~--
ii
Ii 0 1000 2000 8000 4000 1000 6000 MATERIALS CROSS-SECTION GG Z Water 1 Pond Sediment I lClayE-__ Upper Sand l Medium Sand l-- - Lower Sand 7000 8000 FEET CROSS SECTION CC
Figure 3-3 -Cross-Section Showing Layers and Materials
types of soil materials and characteristics. According to the geology, the aquifer was).divided into three major layers: upper sand, medium sand, and lower finer sand (Figure 3-3). FEET 140 120 100 so so80 40 20 0 -20 -40 -80 -sO -100 - 120 ... . ... ... ... ... .... .... ... ... ... ... ... ... ... . .... ... IFU-I-TrTrTrlrTt-,Tlr, !!H11, fill 1 11 I u 11 1 11 1 lill lilt 111 11 11 111' 11 7:r i
...
...
...
To account for minor clay/silty lenses, several sub-layers were included in the top and medium layers. An additional level was built directly below the ground surface to model the ponds' location and hydrologic characteristics at an average depth of 35 feet (Advanced Science, Inc., 1993). Layers generally follow the ground surface topography with the exception of the lower fine sand. This sand layer is bounded between 70 feet below MSL and bedrock at the top and bottom, respectively.
The hydraulic conductivity of the aquifer decreases with depth, and the clay/silty lenses exhibit significantly lower conductivities. Because of the coarse grained quality of the upper sand, the major layer was assigned a horizontal conductivity of 355 feet/day. The medium layer, being slightly less conductive, was assigned a horizontal hydraulic conductivity of 275 feet/day. Since the bottom layer was composed mostly of fine sand with some silty deposits, it was modeled as only one homogenous material with a conductivity of 50 feet/day. The clay/silty lenses were included as one small area in the major medium layer on the east side of Snake Pond where several observations detected clay/silty soil. The horizontal conductivity of the clay/silty soil was set to 19 feet/day. The vertical conductivity was defined in each layer by using the appropriate anisotropy ratio for the Cape Cod aquifer (Advanced Science, Inc., 1993; Masterson and Barlow, 1994) which is 3:1, horizontal:vertical. The elemental model was also set to have a recharge of 23 inches/year (Masterson and Barlow, 1994). The ponds were modeled by attributing a "water" material to the elements that contained the ponds in the sub-layer directly below the ground surface. To represent the action of the ponds correctly, the "water" material was defined to be ideally 100% conductive by setting the horizontal
hydraulic conductivity equal to 100,000 feet/day. An additional layer was included beneath the "water" layer to describe the sediments of the ponds. Initially, the conductivity of the sediments was specified to be lower than that of the sand materials. However, in the final model it was set equal to the hydraulic conductivity of the upper sand. This change was made because the sediment layer with lower conductivities does not have a significant effect on the flow field. The elemental grid and layers were then simulated and calibrated for natural flow.
3.1.2 Assessment Of Model Results
3.1.2.1 Natural Groundwater Flow
The natural flow of the system was reproduced with the DYNFLOW model. In order to assess the validity of the results, the computed hydraulic head values were compared to the observed head values of Savoie (1995). The two sets of hydraulic head values demonstrated satisfactory matches. The mean difference in hydraulic head values was 0.348 feet with a standard deviation of 1.687 feet. Furthermore, the equipotential lines resulting from the model (Figure 3-4 - Water Table Elevations (feet)) were close to the equipotentials of the same study. (Savoie, 1995) The flow pattern has a general north-south direction with a slight tilt to the east.
3.1.2.2 Contaminant Tracking
Since the fuel released from the pipe contains many compounds, the tracking was limited to one contaminant. Benzene was selected because it is highly toxic and soluble in water, exhibiting lower retardation and higher transport velocities than the other contaminants.
The source of the contamination is a pancake-shaped volume of free product which was modeled as a fixed concentration source. The concentration was set equal to the solubility of benzene. The particle path was modeled with the DYNTRACK model and the resulting plume is shown inFigure 3-5. A cross-section parallel to the plume is also shown (Figure 3-6).
The position of the modeled plume is approximately 20 feet higher than the measured concentrations of benzene. The discrepancy is attributed to the uncertainty regarding the location of the groundwater divide. It is suspected that the actual position of the divide is closer to the source than the distance input into the model; due to the sparseness in the head observations in the divide area, this cannot be confirmed at this time. Closer proximity to the divide would result in more pronounced vertical movement of the plume. Since the modeled plume is closer to the ground surface, it is also closer to the pond. Therefore, the results of this simulation will represent a highly conservative model. If the resulting benzene concentration in the pond is insignificant, despite the proximity of the modeled plume to the pond, Snake Pond will be safe in reality.
I I I I I I I
P
t-4
N N I
N O SID a C
Figure 3-4 - Water Table Elevations (feet) Figure 3-4 - Water Table Elevations (feet)
comfr.1 o a a cz Es.. O 8 C: C= --
~~~-~--~-~--4M 4:2o o m C-, E oo g4=o cco Ckj g4= •a 4C3 g4= e4 g4 Cqg •g r•so
Figure 3-5 - Simulated Benzene Particles
42b 4MCM C
E~~
E
E
C5a
H 0000000000
W " W I I
Figure 3-6 -Cross-Section Across Plume
JCO aa t•** r• 00 ON wI-qY ý, I I
3.1.3 Surface Water Impacts
Despite the inconsistencies of the plume position, valid predictions can be made concerning the safety of Snake Pond. Since the placement of the modeled plume is higher than actual measurements show, it can be considered a 'worst-case scenario.' A cross-section of Snake Pond (Figure 3-7) shows very few particles being released in the pond even with this conservative model. The resulting concentration was less than 0.5
mg/L, well below EPA standards. Therefore, it is safe to say that the pond is not in danger of contamination from FS-12.
"kI;
U 00000 OQ••~L
- -4-0 -4-0 -4-0 -4-0 -4-0 -4-0 -4-0 CO p o ~a z P ort-J c'I 0 HrN III IrFigure 3-7- Cross-Section Across Snake Pond Showing Particles
S i
r*rr~**rr*rr**·rrrrrJrr~lrJ·r~·
I I I- I
3.2 Treatment Alternatives
Two primary goals of the IRP are to control the source of contamination and contain the plume's movement. The first treatment alternative presented in this section is the "do nothing" alternative. It is used as a comparative analysis for remedial action extraction. The study also includes an air sparging system to control the source, a well fence and a reactive wall technology for plume containment.
3.2.1 No Action Alternative
The no-action alternative relies solely on natural attenuation to degrade contamination in the groundwater. This section describes the many natural processes that are involved with natural attenuation: biodegradation, volatilization, and adhesion. Calculations of expected costs are also included. Given this background, the application of the no action alternative to the FS-12 plume is discussed.
3.2.1.1 Background Information
The National Contingency Plan states that it is appropriate to evaluate a limited number of alternatives for interim remedial actions rather than the full range of alternatives typically assessed for final remedial actions. Accordingly, two remedial
alternatives were developed and evaluated in the Plume Response Plan: No-Action and Plume Containment. The no-action alternative provides a baseline for comparison for other alternatives. This alternative relies on natural attenuation to treat contaminated groundwater. The Record of Decision states that this alternative is not acceptable because it does not reduce risk and would not meet the following response objectives:
* reduce risks to human health associated with the potential future consumption and direct contact with groundwater and surface waters
* protect uncontaminated groundwater and surface waters for future use by minimizing migration of contaminants
* reduce potential ecological risks to surface waters and sensitive coastal waters through the implementation of the containment system
* reduce time required for aquifer restoration
3.2.1.2 Process Description
Natural attenuation is not in itself a groundwater containment or a treatment technology. This approach relies on natural subsurface processes such as dilution, volatilization, biodegradation, abiotic oxidation, and adsorption to reduce contaminant
concentrations to acceptable levels. Application of natural attenuation involves evaluation of site characterization data, modeling of fate and transport processes based on that data, continual field monitoring to provide evidence showing that degradation of contaminants is occurring naturally at an acceptable rate. (USEPA, 1993) Processes involved with natural attenuation are described below.
Dispersion and Dilution
The mechanical mixing of flowing water with contaminants is called dispersion. The most important effect of dispersion is to spread the contaminant mass beyond the region it would otherwise occupy. Dilution is the result of the mechanical dispersion spreading the mass of contaminants over a larger volume and mixing with clear water. This results in a reduction in contaminant concentration.
Volatilization
Volatilization is the conversion of volatile chemical constituents in groundwater to vapor, which is ultimately transferred to the atmosphere. Natural volatilization is likely to occur in shallow unconfined aquifers. Volatilization rates in surface waters is expected to be much higher. Field studies have shown half-lives ranging from 5 hours for benzene to 6 hours for EDB for evaporation from a river of 1 meter depth with wind speed of 3 meter/second and water current of 1 meter/second (MacKay et al., 1992). These values are of particular interest to determine the impacts of potential plume discharge into streams and ponds.
Sorption
Retardation processes consist of sorption of organic substances. Sorption can contribute to the attenuation of the concentration of contaminants. It reduces the rate of movement of contaminants as compared to the average flow rate of groundwater.
Biodegradation
BTEX compounds are known to biodegrade easily in groundwater. Biodegradation processes are studied in detail in a later section.
3.2.1.3 Application at FS-12
The IRP gave little consideration for the no-action alternative for natural restoration and impacts on environment and human health. The long range model depicts key facts about the FS-12 plume (Figure 3-8):
* the plume will not discharge into Snake Pond
* the plume will discharge into Mashpee Pond in approximately 35 years assuming a groundwater flowrate of 0.5 feet/day
Based on the simulations described above, two exposure pathways have been identified: * plume discharge in Mashpee Pond
Scale 1 mi
Figure 3-8 -Long-Term Contaminant Transport
The following will examine the natural attenuation processes and exposure risks of plume migration. Potential impacts of plume discharge in Mashpee Pond are also discussed.
The contaminants of concern in the FS-12 plume are benzene and EDB (Figure 3-8). Benzene is expected to undergo aerobic biodegradation. This conclusion is supported
Table 3-1- Contaminants of Concerns: Comparison of Average and Maximum Concentrations in the FS-12 Plume Against Established MCLs
Contaminant of Concern Average Concentration Maximum Concentration MCL
(jiglL) (ig/L) (tglL)
Benzene 65.1 1550 5
EDB 21.4 578 0.05
(Operational Technologies Corp., 1995)
by both the presence of shorter chain hydrocarbons and low levels of dissolved oxygen within the plume. However, low dissolved oxygen concentration in the areas of highest benzene concentrations suggest contaminant levels have overcome the capacity of the biological system. Studies have shown that benzene will migrate by advective transport until areas with sufficient dissolved oxygen levels are encountered. At that location, biological activity can reach equilibrium with the rate and concentrations at which benzene migrates further in the aquifer (Cambareri et al., 1992). EDB has been shown to undergo both aerobic and anaerobic degradation processes in laboratory and field studies. However, relatively low concentrations of EDB overcome the capacity of the biological system. Degradation rates are not expected to match the rate of groundwater flow. Therefore, the EDB plume will continue to migrate. Table 3-1 compares the average and maximum concentration levels with the MCLs (Operational Technologies Corp., 1996).
Assuming first order decay, the time required for complete dissolution of contaminants to MCLs was calculated as 4.5 years for EDB and 8.3 years for benzene.
According to these biodegradation rates, the maximum additional extension of the plume exceeding MCL limits is 1000 feet downstream of the current plume toe.
However, studies have shown that the rate and extent of biodegradation are strongly influenced by the type and quantity of electron acceptors present in the aquifer. Once the available oxygen, nitrate, and sulfate are consumed, biodegradation is limited and is controlled by mixing aerobic biodegradation at the plume fringes (Borden et al., 1995). Therefore, a combination of natural attenuation with source control; such as free product recovery or air sparging, would significantly enhance biodegradation and the biodegradation rates could be met with greater confidence.
These results suggest that risks posed to the environment due to plume discharge in surface waters may be much less than those stated by the MMR Installation Restoration Program. Their risk assessment study assumes potential concentration levels in the environment would equal the current ones found in the plume, thereby neglecting attenuation processes such as biodegradation. This leads to overly conservative results. However, current concentrations of contaminants do pose a threat to private wells, at least until attenuation processes have decreased contaminants levels below the MCLs.
3.2.2 Source Control -Air Sparging
The purpose for this study is to evaluate air sparging as an appropriate choice for source control at FS-12. The main focus is to determine a new time estimate for source
remediation. A detailed descripiton of this study can be found in Chapter 4.
3.2.3 Plume Containment
3.2.3.1 Pump and Treat -Extraction Well Fence
The following provides the necessary background, design, and application of a pump and treat system for the containment of the FS-12 plume. The design provides a extraction well fence that controls additional migration and spreading of the current contamination. The well fence is not intended to remediate or eliminate the entire plume, but it ensures that the dissolved contaminants do not spread further. In addition, the water contained by the extraction fence will be removed and treated by activated carbon filtration.
Background Information
Pump and Treat is one of the oldest techniques for the remediation and containment of groundwater contamination. Although it has been replaced and surpassed in certain instances by other more efficient remedial technologies, it is still widely used for remediation of contaminated groundwater. Pump and treat consists of pumping contaminated water from the aquifer and treating the water to remove the contaminants. The "clean" water can then be either re-injected into the aquifer by injection wells, or retained for other uses. Optimal field conditions for the application of pump and treat at a
contaminated site are highly conductive aquifer material and coarse grained and sandy soil in the saturated zone. It is possible to use pump and treat in less conductive materials; however, the required increase in pumping rates would necessarily increase costs of operation. (Domenico and Schwartz, 1990; Member Agencies of the Federal Remediation Technologies Roundtable, 1995).
Process Description
The location and pumping rate of the wells depends on the position, depth and extent of the plume. Usually wells are drilled surrounding the contaminated area, down-gradient of the direction of flow. The screening interval is typically positioned at a depth equal to that of the plume. The length of the actual screen is proportional to both the vertical extent of the contamination and to the applied pumping rate. There is a trade off
between the number of wells and the pumping rate required to successfully contain the plume. To determine the most efficient design, capture curves are used. These define the volume of water of the aquifer that is being captured by a particular system of pumping wells. Therefore, the total area of influence of the extraction fence will be proportional to the total number of wells and their respective flowrate. The treatment of contaminated water by granular activated carbon is a very common process of water purification. The water extracted by the well fence is passed through tanks containing granular activated carbon on which the contaminants are sorbed (Domenico and Schwartz, 1990; Member Agencies of the Federal Remediation Technologies Roundtable, 1995).
Implementation and Design
The first step in the design of a well extraction system is to determine the location and extent of the plume. The well fence should be approximately located at the toe of the plume just down-gradient in the direction of flow. Various layouts for the well fence can be produced. For each layout, several systems can be designed with different numbers of wells and different pumping rates. To actually test and analyze the results of the various designs, the groundwater finite element model was utilized (see Section 3.1). To determine its position in space and time, the volume of contaminated groundwater was represented by visible particles. The particles represent the groundwater as it flows through the aquifer. They can be positioned and started at a particular cross section of the contaminated plume. Their flow path can be analyzed in time by selecting the desired time step for the model's simulation. When the model containing the extraction well fence is simulated it is possible to determine whether the flow volume of the plume, as represented by the particles, is captured by the wells. The particles can be analyzed in three dimensions to ensure that the entire plume is captured. In addition, particles surrounding the actual contamination were also included to ensure that clean water was not being unnecessarily captured by the well fence. Each pumping well was defined in the model by a nodal point with the same coordinates to which the proper outflow was assigned. The model was then simulated under transient conditions to analyze the flow and determine if the extraction well fence actually captures the plume. The capture curves were then determined by analyzing which and how many of the flow particles are being captured by the wells in the simulated model. The analysis of different systems of
wells was based on an optimization method. Several solutions were tested with different numbers of wells and different flow rates. The various solutions were then plotted on graphs displaying the interdependence of number of wells, required pumping rate, and depth of the screening intervals.
Application at FS-12
The most efficient system for the well extraction fence consisted of 11 wells pumping at a total rate of 800 gpm. The well fence layout and location is shown in Figure 3-9. Figure 3-10 and Figure 3-11 summarize the results of the simulations of contained particles in plan view and vertical cross section, respectively. As shown, the capture intervals was between 40 feet mean sea level (MSL) and 70 feet below MSL, corresponding roughly to the lowest portion of the contaminated water volume. The wells needed to be water. In the vertical direction, the well fence influence is approximately limited to the curve extent is just enough to completely contain the plume without pumping clean
capture of the contaminated water. The optimal vertical placement of the well screening placed at this lower position because the higher soil layers are more conductive than the lower soil layers. The pumping rate of nine of the wells was assigned a flow rate of 70.5
24000 250 26000 27000 28000 29000 30000 31000 32000 33000 34000 35000 38000 37000 FEET
Figure 3-9 -Extraction Well Fence and Observed Plume Location
24000 25 2 000 2 00 29000 3W000 31000 32000 33000 34000 35000 36000 37000, FEET
Figure 3-10 -Plan View of Particle Capture by Extraction Well Fence 43000 42000 41000 40000 39000 38000 37000 36000 36000 34000 42000 41000 40000 39000 38000 37000 36000 365000 34000 33000 .. .
...
.
...
...
...
.
....
.
. ..
...
.
...
...
..
...
Observed Plume
Figure 3-11 - Cross Section of Particles Captured by the Extraction Well Fence
gpm per well. The two wells next to Snake Pond were assigned higher flow rates of 83 gpm per well in order to capture the plume.
3.2.3.2 Reactive Wall
This section will provide a brief summary of the technical workings of the reactive wall as it applies to the degradation of halogenated organic compounds. Discussion of the advantages and disadvantages of implementing this system over more conventional methods will follow. Finally, this section will conclude with a short evaluation of the potential for application of the technology to the FS-12 site.
140 120 100 80 - 600 1000 100 12000 600 8000 600 -4000 - Fu0 FEET
I
- Flow Particle Being Captured by Extraction Well FenceI
- Flow Particle Not Captured by Extraction Well Fencei i iI i i I i --- i -i