HAL Id: hal-02979866
https://hal.sorbonne-universite.fr/hal-02979866
Submitted on 27 Oct 2020HAL is a multi-disciplinary open access
archive for the deposit and dissemination of sci-entific research documents, whether they are pub-lished or not. The documents may come from teaching and research institutions in France or abroad, or from public or private research centers.
L’archive ouverte pluridisciplinaire HAL, est destinée au dépôt et à la diffusion de documents scientifiques de niveau recherche, publiés ou non, émanant des établissements d’enseignement et de recherche français ou étrangers, des laboratoires publics ou privés.
Investigating CaOx Crystal Formation in Absence and
Presence of Polyphenols under Microfluidic Conditions
in Relation with Nephrolithiasis
Karol Rakotozandriny, Samantha Bourg, Paszkál Papp, Ágota Tóth, Dezsö
Horváth, Ivan T. Lucas, Florence Babonneau, Christian Bonhomme, Ali
Abou-Hassan
To cite this version:
Karol Rakotozandriny, Samantha Bourg, Paszkál Papp, Ágota Tóth, Dezsö Horváth, et al.. Investi-gating CaOx Crystal Formation in Absence and Presence of Polyphenols under Microfluidic Condi-tions in Relation with Nephrolithiasis. Crystal Growth & Design, American Chemical Society, 2020, pp.7683-7693. �10.1021/acs.cgd.0c00929�. �hal-02979866�
Investigating CaOx crystal formation in absence and
presence of polyphenols under microfluidic conditions in relation
with nephrolithiasis
Karol Rakotozandriny,1,2 Samantha Bourg,1,2 Paszkál Papp,3 Ágota Tóth,3 Dezső
Horváth,4 Ivan T. Lucas,5 Florence Babonneau,2 Christian Bonhomme2* and Ali
Abou-Hassan1*
1 Sorbonne Université, CNRS UMR 8234, Laboratoire de PHysico-chimie des Électrolytes et Nanosystèmes InterfaciauX, PHENIX, F-75252 Paris Cedex 05, France
2 Sorbonne Université, CNRS UMR 7574, Laboratoire de Chimie de la Matière Condensée de Paris, LCMCP, F-75005 Paris, France
3 Department of Physical Chemistry and Materials Science, University of Szeged, Rerrich Bela ter 1. Szeged H-6720 Hungary
4 Department of Applied and Environmental Chemistry, University of Szeged, Rerrich Bela ter 1. Szeged H-6720 Hungary
5 Sorbonne Université, CNRS UMR 8235, Laboratoire Interfaces et Systèmes Electrochimiques, LISE, F-75005, Paris, France.
ABSTRACT
Nephrolithiasis is a major health concern in western countries. Herein we propose a microfluidic based approach to mimic the physical and physico-chemical conditions encountered in the collecting duct in a nephron where calcium oxalate (CaOx) precipitation occurs. Our objective is to understand the parameters involved in the formation of such crystals. The microfluidic platform is reversible allowing interfacial characterizations using scanning electron microscopy (SEM) imaging and Raman spectroscopy. CaOx crystalline phases and morphologies were studied with respect to hydrodynamics and physicochemical conditions within the channel and at the outlet. While calcium oxalate monohydrate (COM) crystals were dominant within the channel, at the outlet the crystals were calcium oxalate dihydrate (COD) crystals which agree with medical observations. Decreasing the flow rate lowered down the induction time for CaOx formation and enhanced the occurrence of COD crystals. The kinetics of COM crystals growth studied in-situ showed two regimes, an initial surface-limited reaction followed by a transport-limited growth with a dependency of the kinetics on the position of the crystal in the channel. Numerical modelling of CaOx formation in a microchannel using an in-house model considering the chemical reactions involved allowed to confirm the experimental observations on the location of precipitate formation but also to quantitatively match the scaling law related to the early growth of precipitate particles. Finally, the effect of polyphenols naturally found in green tea (GT) on modulating CaOx crystallization was studied in the microfluidic device in different scenarios where GT was initially mixed in solution with the Ca and/or the Ox precursors. The formation of COD crystals rather than COM ones was always predominant, however depending on the conditions, CaOx crystals of different morphologies could be observed including COD crystals with elongated (100) crystalline face and COM crystals with a round-shaped morphology with concave crystalline face.
INTRODUCTION
Last decades have seen nephrolithiasis, especially an increasing prevalence of calcium oxalate (CaOx) stones becoming a rising societal problem among the industrialized populations.1, 2 Investigating the physicochemical conditions underlying
CaOx crystals formation is of prime importance for understanding the mechanisms of kidney stones (KS) biomineralization. So far, CaOx crystallization has mainly been studied in batch,3, 4 along with the influence of small molecules and/or proteins – e.g.
citrate5-7 or osteopontin (OPN)8-10 – on CaOx growth. Although useful in a first
approach, these experiments do not duly reflect the reality of CaOx crystal formation due to unrealistic physicochemical conditions compared to physiological ones encountered in the human body. Upon mixing of an aqueous solution of calcium (Ca2+)
and oxalate (Ox2-) ions, fast and instantaneous precipitation of CaOx crystals may
occur if the supersaturation (SS) defined as SS=Q/Ksp(CaOx), where Q is the ionic
product, i.e. Q=[Ca2+][Ox2-], and Ksp(CaOx) = 2.32 x 10⁻⁹ is the solubility product constant,
is higher than one (SS>1). 11 Access to crystal growth at observable timescale by
considering the confinement induced by the renal environment and the urinary flow would provide valuable information to the biomedical community on lithiasis mechanisms. Despite clinical investigations involving symptomatic and healthy persons to understand the pathology,1, 2, 12 it still seems to be a lack of correlation
between the medical observations and the different models which have been developed in vitro to reproduce CaOx crystallization. Physicians11 can indirectly access
information about the lithiasis through analyses of the urine of the patients. By measuring the concentration of the ions in equilibrium (eq) with the kidney stones, i.e. [Ca2+]eq and [Ox2-]eq, they correlate the ratio of the ionic concentrations rCaOx =
[Ca2+]
value, different CaOx crystalline phases can be observed. Monohydrated whewellite (CaC2O4.H2O, COM) is predominant when rCaOx < 5 while dihydrated weddellite
(CaC2O4.2H2O, COD) is mostly observed when rCaOx > 14. A mixture of COM and COD
is generally observed at intermediate rCaOx range (5 < rCaOx < 14). Nonetheless, a few
contributions on CaOX crystallization have previously considered the influence of
confinement,13 and coupling between diffusion, convection and reaction14 which result
in local physicochemical variations, affect the direct crystallization of CaOx.15
Crystallization processes leading to kidney stone formation tend to take place at the end of the most distal part of the kidney tubular structure, known as the collecting duct.16 In the kidney, the dimension of one collecting duct is of ≈ 100 µm diameter with
a characteristic flow rate of ≈ 0.02 µL.min-1 resulting in a laminar urine flow.17
Microfluidic systems in which different solutions containing the appropriate precursors can be separately injected, adequately mimic the physical and physicochemical environments favorable to KS formation. Indeed, small dimensions induce laminar flows and possible mixing of the precursor by molecular diffusion at the dynamical interfaces between the miscible liquids. The establishment of a laminar flow regime enabled to develop kidney-on-a-chip platform of great interest as already demonstrated by Jang et al.18 who developed a multi-layer microfluidic device for
culturing and analyzing renal tubule cells. In the context of renal substitution therapy, Ng et al.19 engineered a bioartificial renal proximal tubule. To study phosphate-based
stone formation, Wei et al.20 grew renal epithelial cells in a microfluidic device. In order
to mimic renal disease as nephrolithiasis, Sakolish et al.21 developed a reusable
human proximal tubule-glomerus microfluidic system. Last but not least, our group also reported on the effect of diffusive mixing of Ox2- and Ca2+ ions on CaOx crystal
collecting duct dimensions.13 Consequently, it appears clear that microfluidics by
partially recreating the renal environment and the conditions promoting KS formation can contribute to the understanding of the underlying mechanisms.22, 23, 24
Green tea (GT) is one of the most common beverages consumed around the world and has been reported to have potential anti-oxidative effects as well as preventive effects on diseases such as atherosclerosis or Parkinson’s disease thanks to its rich content in polyphenols.19, 25, 26 Recently, on the basis of clinical observations,
the consumption of GT was considered for the treatment of KS, which led to a patent application for the use of its active ingredient, catechins (polyphenolic compounds from GT).27 However, a recent study from Rodgers et al.28 stated that GT consumption does
not reduce the risk factors for CaOx stone formation highlighting the existing questions on the role played by GT on CaOx formation in human beings. Yet, the ability of catechins from GT to affect CaOx stones was investigated through different studies: in
vivo compared to in vitro studies pointed out that GT – especially epigallocatechin
gallate (EGCG) – had an inhibitory effect on stone formation.29 EGCG was also found
to decrease the binding of COM crystals onto renal tubular cells30. Chen et al.31
concluded that catechins from GT were effective in preferentially promoting the formation of COD over COM. The latter result has a strong potential given that COD has less adhesion to renal epithelial cells32 and is generally found in the urine of healthy
subjects unlike CO, which behaves like a stone-forming agent.31
Herein, we aimed at investigating the relevancy of using a microfluidic platform as a collecting duct biomimetic model to assess CaOx crystallization dynamics under conditions similar to the one promoting lithiasis pathologies. The confinement effect and the precursors flow conditions enabled to follow at observable timescale CaOx crystals growth kinetics. Thus, from the flow conditions of Ca2+
precursors – and their associated impact on the local concentration gradients – we investigated the relative yield, habits and nature of the resulting CaOx crystals that this microfluidic device enabled to qualitatively and semi-quantitatively characterize at various scales. Additionally, we elaborated a numerical model to simulate and help understanding the different observations including the formation of crystals and their growth kinetics. Finally, the platform was used to investigate the effect of small molecules on CaOx crystallization such as catechins from GT as presented herein.
MATERIALS AND METHODS
A 100 x 100 µm “Y-shaped” microchannel of 2.5 cm of length – similar to collecting duct dimensions – was casted in an assembly of polydimethylsiloxane (PDMS, Sylgard 184) and iron-carbonyl PDMS for a facile glass coverslip sealing/unsealing with good tightness by using magnets.33 The two inlets were infused
at the same flow rate (1.00, 0.10 and 0.01 µL.min-1) using a syringe-pump (kd Scientific
or Cetoni) with two different aqueous solutions of calcium chloride (CaCl2,
Sigma-Aldrich, 12.0 mmol.L-1) and of sodium oxalate (Na
2C2O4,Sigma-Aldrich, 0.4 mmol.L-1),
leading to CaOx crystal precipitation at room temperature.13 The total flow rates (Q tot)
studied in the microchannel, 2.00, 0.20 and 0.02 µL.min-1, were tested with an infusing
time equal to 2h, 2h 50min and 24h, respectively. At the end of the experiment, (i) CaOx crystals at the outlet were collected and (ii) the PDMS part of the assembly was separated from the glass coverslip onto which CaOx precipitated. In both cases, crystals were delicately rinsed with deionized water and ethanol and when not analyzed, stored at 4°C to limit the transformation of the unstable COD phase into the stable COM phase. GT solution was prepared by filtering green tea leaves boiled in milliQ water (1.0 g/100 mL of milliQ) at 100°C for 5 min and content in catechins was
determined to be ≈ 1.7 mmol.L-1 using UV-visible spectrometer as reported in ref.34
Afterwards, Ca2+ and Ox2- precursors were separately dissolved in GT solution to
prepare GT containing Ca2+
(GT) and Ox2-(GT) solutions at [Ca2+](GT) = 12.0 mmol.L-1 and
[Ox2-]
(GT) = 0.4 mmol.L-1, respectively. CaOx crystal characterization was conducted at
various scale by using Scanning Electron Microscopy (Hitachi S-3400), Raman spectroscopy (LabRAM HR Evolution, Horiba) and real-time crystal growth monitoring under a light microscope (Leica).
RESULTS AND DISCUSSION
Manipulating CaOx crystallization by hydrodynamics
100 µm
calcium-rich side oxalate-rich side
CaOx
(a) (b)
Continuous flow rate Diffusion cone CaOx crystal
(010) (c) (101) (f) (h) (e) (1 00) (d) (101) (100) (g)
Figure 1. CaOx crystal precipitation under co-laminar mixing of aqueous solutions of
oxalate ions (0.4 mM) and calcium ions (12.0 mM). (a) Simplified summary scheme. (b) Light micrograph of the collecting duct-like microchannel. (c-h) SEM micrographs and their associated Raman spectra (exc = 532 nm): (c) “twinned” monohydrated CaOx
(CaC2O4.H2O, COM), (d) “boat-like” COM, (e) standard COM crystal Raman spectrum,
(f) “flatted-bipyramid” dihydrated CaOx (CaC2O4.2H2O, COD), (g) “dodecahedral”
COD, (h) standard COD crystal Raman spectrum.
Figure 1a shows a scheme of the reversible collecting duct-like microchannel13
used in this study. CaOx crystallization under co-laminar mixing of Ca2+
(aq) and Ox2-(aq)
ions was conducted at concentrations matching pathological hypercalciuria ([Ca2+] (aq)
= 12.0 mmol.L-1) and moderate hyperoxaluria ([Ox2-]
(aq) = 0.4 mmol.L-1).[10] To
understand the effect of flow conditions, the precursor flow rates QCa2+ and QOx2- were
adjusted to the same value, either 1.00, 0.10 or 0.01 µL.min-1, giving a Qtot of 2.00,
0.20 or 0.02 µL.min-1 with 0.02 µL.min-1 the characteristic physiological flow rate of one
human collecting duct.17 The formation of crystals in the collecting duct-like
microchannel was studied in situ thanks to the possibility to adapt the microfluidic setup under an optical microscope to allow visualization of the inside of the transparent microchannel.Due to the reversible assembly of the microfluidic device, ex-situ and multiscale characterizations of the crystals formed onto the glass coverslip were conducted by SEM and by Raman spectroscopy in order to identify the different CaOx crystal phases.First, we studied CaOx crystal formation at the most convenient total flow rate of 2.00 µL.min-1. The solubility product being above K
sp(CaOx) upon perfusion
of the precursor solutions in the channel, CaOx crystals precipitated in a progressive “conical-shape” spreading along the dynamical interface (Figure 1b). This phenomenon was induced by the concentration gradients of Ca2+
(aq) and Ox2-(aq) ions
in the interdiffusion zone (respective self-diffusion coefficients DCa2+ = 7.92 x 10⁻¹⁰ m².s -1 and D
the crystals produced at Qtot=2.00 µL.min-1, suggests the formation of whewellite
(COM, CaC2O4.H2O) (Figures 1c & d) and weddellite (COD, CaC2O4.2H2O) (Figures
1f & g). Usual crystal morphologies were found like “twinned” and “boat-like” prismatic crystals for COM (Figures 1c & d, respectively) or flattened tetragonal bipyramids for COD. Such morphologies were also obtained with the two other studied total flow rates, 0.20 and 0.02 µL.min-1. Similar crystal habits are often obtained from batch
crystallization under specific experimental conditions – e.g. twinned COM crystals4 and
tetragonal COD bipyramids .31 However it is interesting to note that twinned COM
crystals were never reported in CaOx-based KS.16 Using this collecting duct-like
microchannel, it is thus possible to yield a whole variety of CaOx crystal morphologies. As the low amount of produced crystalline material did not allow standard X-ray diffraction (XRD) analysis, chemical phase identification was achieved thanks to micro-Raman spectroscopy (Figure 1e & h). Coupled to microscopic imaging, the micro-Raman analysis allowed to confirm the phase attribution initially based on CaOx crystal habits.36 Indeed, the Raman spectrum of COM crystals exhibits two characteristic
bands at around 1461 and 1487 cm-1 whereas the spectrum of COD crystals only
shows a single band at around 1475 cm-1.36 The Raman analysis performed on the two
types of crystals (Figures 1e and 1h) fully confirmed their respective attribution to the COM and COD phases.
We also anticipated that the flow rates could play a role in CaOx crystallization and their final organization. In agreement with the flow conditions, the “conical-shape” spreading of the CaOx crystals was asymmetric with respect to the dynamical interface, resulting in the presence of crystals on the oxalate-rich side of the channel for Qtot = 2.00 and 0.20 µL.min-1 (Figures 2a & d). Moreover, for the lower flow rate
“Y-junction”. Therefore, CaOx crystals were observed directly after the Y-junction, and over the entire width of the channel. In a first approximation, the comparable values of the self-diffusion coefficients for Ca2+
(aq) and Ox2-(aq) ions does not permit to explain the
observed asymmetrical conical shape. However, the thirty times higher concentration of Ca2+ ions compared to Ox2- ions leads to a faster diffusion of Ca2+ ions to the
oxalate-rich side. Moreover, when the total flow rate decreased from 2.00 µL.min-1 (Figure 2a)
to 0.20 µL.min-1 (Figure 2d), the associated diffusion cone became wider and with a
starting point closer to the channel junction. In addition, as the flow rate further decreased to 0.020 µL.min-1, crystals appeared even in the oxalate-infused part of the
channel but not in the calcium-infused part (Figure 2g).
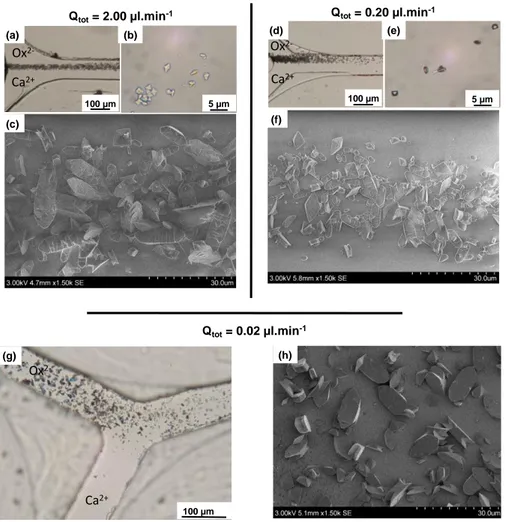
Figure 2. Overview of CaOx crystal precipitation under standard conditions Qtot of (a-c) 2.00 μL.min-1
, (d-f) 0.20 μL.min-1
and (g-h) 0.02 µL.min-1 with (a, d & g) Optical micrographs of CaOx precipitates inside the microchannel; (b & e) Optical micrographs of collected CaOx crystals at
Qtot= 2.00 µl.min-1 (c) 100 µm (a) 5 µm (b) Qtot= 0.20 µl.min-1 100 µm (d) 5 µm (e) (f) Qtot= 0.02 µl.min-1 (h) (g) 100 µm Ox 2-Ca2+ Ca2+ Ca2+ Ox 2-Ox
2-the outlet of 2-the microfluidic platform; (c, f & h) SEM micrographs of resulting CaOx precipitates in the glass coverslip at 300 µm of the Y-junction of the collecting duct microchannel. The solutions of Ox2- and Ca2+ ions were injected respectively in the upper and the lower sides of the channel.
For a total flow rate of 2.00 µL.min-1, 96% of the observed crystals (as
determined from SEM) were attributed to COM (Figure 2c). A decrease to 0.20 µL.min-1
favored species interdiffusion leading to an increase of COD crystals and thus a decrease in the proportion of COM crystals to 73% (Figure 2f). With a further decrease of the total flow rate to 0.02 µL.min-1, i.e. the mimetic conditions in the collecting duct,
only 60% of the observed crystals could be attributed to the COM phase (Figure 2h). Regardless of the flow conditions, COM crystals are overwhelmingly in the channel, but a decrease in the flow rate (and an increase of the diffusion relatively to the convection) leads to a higher proportion of COD crystals. Based on SEM observations (Figures 2c, f & h), COM crystals exhibited preferentially “boat-like” prismatic shapes but also “twinned” shapes at a lesser extent, whereas COD crystals are flattened tetragonal bipyramids. As the flow rate decreased, the overall size of CaOx crystals did not change significantly and was in average around 8.4 ± 1.6 µm for COM crystals (deduced from the (100) crystallographic face) and 5.9 ± 2 µm for COD crystals (measured along the c-axis).
We also analyzed the crystals in the aqueous solution at the outlet of the channel. Such a solution can mimic the urine of patients, which is usually collected and analyzed by physicians for diagnosis. Interestingly for a total flow rate of 2.00 or 0.20 µL.min-1, only flattened bipyramidal COD crystals were observed (Figures 2b & 2e, see
SI Figure S1 for larger size images) in complete agreement with the clinical observations of Daudon et al.11 who showed that for rCaOx >14, which corresponds to
the pathological case of combined hypercalciuria and hyperoxaluria, only COD crystals are found in the patient’s urine. However, for a total flow rate of 0.02 µL.min-1, we were
unable to detect any crystals at the exit of the microchannel (data not shown), which is related to the difficultly of collecting the very low volume (≈30 µL) of the aqueous solution at the exit of the microchannel even after 24h.
An important result of these experiments is that under our experimental conditions, the nature of the CaOx crystals formed in the microchannel (a mixture of COM and COD crystals with a majority of COM crystals) was different from that of the crystals collected at the output (COD crystals only). It is of course difficult to extend this observation to the in vivo case, but it could suggest that the CaOx crystals found in the patient’s urine could be of a different nature from those found in the kidney. Actually, COD crystals predominate in human urine and COM crystals are observed in urine only when oxalate excretion is dramatically increased.37 By contrast,
Fourier-transform infrared spectroscopy (FTIR) analysis of kidney sections identify more frequently COM than COD crystals in kidney tubules.38
Combined findings tended to support the existence of two possible pathways for CaOx nucleation, which can occur together or simultaneously with (i) homogeneous nucleation occurring in the flow as opposed to (ii) heterogeneous nucleation occurring on the hydrophilic surface of the channel’s glass coverslip.39 However, neglecting the
effect of gravity, we can hypothesize, based on our observations, that nucleation and growth of COM crystals are favored on surfaces and are affected by the concentration gradients of the ionic precursors whereas COD crystals seem to grow preferentially in homogeneous solution.
Assessing the kinetic of COM growth in situ and under flow
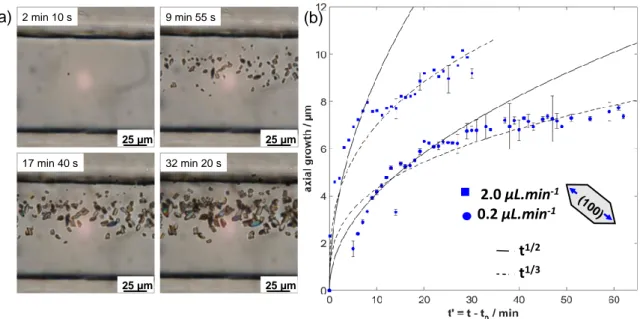
Figure 3. In situ monitoring of CaOx crystal growth as a function of time in the collecting
duct-like microchannel: (a) set of images depicting the growth of CaOx crystals at different times (magnification 400×). In the present example, crystallization is monitored at a distance of 300 µm from the microchannel Y-junction for a total molecular flow rate of Qtot= 2.00 µL.min-1. (b) Time evolution of the axial growth of the (100) crystallographic face for boat-like COM crystals. Blue markers stand for the experimental data points monitored with respect to the flow conditions. Black lines (solid and dashed) corresponds to fitting models to describe the growth kinetics of COM crystals. The time t' = t – t0 stands for a translated time between the induction time t0 and the measurement time t.
Due to the transparency of the microchannel, it was possible to monitor in situ the growth of micrometric CaOx crystals using an optical microscope. The monitoring over time provides quantitative information about the kinetics of crystal growth inside the collecting duct-like microchannel. To study the growth kinetics, boat-like COM crystals on the glass coverslip at 300 µm of the Y-junction of the channel, were selected to serve as a model system due to their main occurrence. In particular, the growth of the (100) crystallographic face was followed with SEM characterization and referred as axial growth hereafter. With respect to the flow conditions, series of images such as in Figure 3a enabled to measure the axial growth of the (100) crystallographic face of the
2.0 µL.min-1 0.2 µL.min-1 (100) t1/3 25 µm 2 min 10 s 25 µm 9 min 55 s 25 µm 17 min 40 s 25 µm 32 min 20 s (a) (b) t1/2
boat-like COM crystals (Figure 3b) versus time t’, where t’ counts for the translated time between the induction time t0 (values in min are given below), corresponding to
the appearance of microscopic crystals,and the measurement time t. After filling the channel with Ca2+
(aq) and Ox2-(aq) ion solutions, the formation of the crystals was
optically spotted on the cover slide, always at the same distance from the Y junction. The first microscopic CaOx crystals appeared in the channel at t0 = 1 min for Qtot= 2.00
µL.min-1, t
0 = 8 min for Qtot= 0.20 µL.min-1 and t0 = 2 h 50 min for Qtot= 0.02 µL.min-1,
showing that lower flow ratevalues caused a delay in CaOx crystal formation due to a slower mixing by diffusion of Ca2+ and Ox2- ions. The kinetic of CaOx growth at a total
flow rate of 0.02 µL.min-1 was not studied because of the difficulty of tracking crystals
under such conditions. An estimate of v0(Q), the initial growth rate extracted from the
linear part of the curve for each total flow rate Q, strengthened the previous assumption: v0 (2.00 μL.min-1) = 1.79 ± 0.04 μm.min-1 and v0 (0.20 μL.min-1) = 0.41 ±
0.06 μm.min-1. Under both flow conditions, the axial growth versus time could be
described with two distinct regimes (Figure 3b). At the beginning, the axial growth curve varied as ∝ t′1/2, which corresponded to a surface-limited kinetics: the small yet
emerging COM micro-crystal was affected solely by the value of local SS in Ca2+ and
Ox2- ion concentrations at its surface. When the crystal reached a critical size (≈ 4 μm),
the axial growth varied in ∝ t′1/3, which corresponded to a transport-limited kinetics: the
transport rate of reagents to the COM surface limited the crystal growth. Therefore, considering these results, we may conclude that a decrease in the flow rate delays the growth of COM crystals and affects their growth rate as well as their final size. Moreover, we may also hypothesize that depending on the position of the crystal in the channel, the growth rate will be different and depending on the concentration gradients resulting from the flow rate.
Modelling CaOx growth under flow conditions
Towards a deeper understanding of the experimental observations, numerical modelling of the CaOx crystal formation in a microchannel has been carried out with an in-house model considering the chemical reactions involved in the early stages of the CaOx precipitation in the presence of continuous flow, i.e. under non-equilibrium conditions.14 Our approach hence incorporates the fluid dynamics of both the liquid
phase of the reacting solutions and the solid particles of the product.
In the modelling study we consider two miscible liquids pumped into the microfluidic device. The laminar flow is governed by the Navier–Stokes equation for incompressible fluids (∇.u = 0) as
∂𝑢⃗ ∂t+ 𝑢⃗ . ∇𝑢⃗ = 𝑣∇ 2𝑢⃗ − ∇𝑝 𝜌0 + 𝜌 𝜌0𝑔 (1)
Where 𝑢 the velocity of the fluid flow, 𝜈 = 10−6 m2.s-1 is the kinematic viscosity
of the liquid, while ρ and ρ0 are the density of the solutions and of the water,
respectively. Dilute solutions were used in the experiments therefore we can apply the Boussinesq approximation according to which the liquid density only appears in the term containing the gravitational acceleration in Eq. (1). The density is a linear function of the composition according to:
𝜌 = 𝜌0+ ∑ 𝜌𝑖 𝑖 𝑐𝑖
(2)
with ρi is the density contribution of species i with concentration 𝑐𝑖 (mmol. L-1).
With respect to the reagents, the following reactions take place: CaCl2(aq) + Na2C2O4(aq) ➔ Ca2C2O4(aq) + 2 NaCl(aq) (3)
provided that [Ca2+] [Ox2-] > Ksp(CaOx) is valid, and CaC2O4(coll) represents the
intermediate colloidal CaOx species when the system is not yet heterogenenous, i.e., prior to the precipitation. Equation (4) stands for the generation of solid particles by nucleation in the supersaturated solution. The component balance equations are added to Eq. (1) to complete the model according to:
𝜕𝑐𝑖
𝜕𝑡 + 𝑢⃗ ∙ 𝛻𝑐𝑖 = 𝐷𝑖𝛻
2𝑐
𝑖 + 𝜈𝑖𝑟 (5)
where the rate of reaction accounts for both nucleation (rn) and growth (rg) acting
simultaneously with respect to crystallization:
r = rn+ rg= (kn+ kg∑ di2
i )([CaCl2][Na2C2O4] − Ksp(CaOx))
(6)
where 𝑘n is the rate coefficient for homogeneous nucleation, kg is the rate coefficient
for growth and di is the diameter of particles present within a cell volume ∆V. In the
area of supersaturated solution, homogenenous nucleation is considered to take place only if the system can become heterogenenous on the macroscopic scale, i.e., a new particle with d > 1 µm can form via homogeneous nucleation, otherwise the colloidal CaOx species accumulate. Equations (1) and (5) are solved by a finite volume method using the Open-FOAM package40 with the microfluidic channel being represented by a
volume with a length of 25 mm, a cross-section of 100 × 100 µm and a Y-shaped head for the two inlets. The in-house code, based on the PIMPLE algorithm,41 incorporates
Lagrangian particle tracking for processing the formation of solid CaOx. Anisotropy in the solid particles at these sizes do not cause significant change in the flow field of the surrounding liquid, hence for general description at each iteration step, a particle assumed isotropic for simplicity, i.e., a sphere with a diameter dp in the volume ∆V
∆mp = kgdp
2
kn+ kg∑ di2 i
Mr[CaC2O4(aq)]∆V (7)
with Mr = molar mass of the crystalline CaOx. From the preceding equation, the size
increase can be calculated as well. Additionally, homogeneous nucleation at a random position within the volume occurs if
∆mn= kn kn+ kg∑ di2 i Mr[CaC2O4(aq)]∆V > ρπ(1 µm)3 6 (8)
in which case, [CaC2O4(aq)] is set to zero. Otherwise, the concentration of colloidal
CaOx remains non-zero.
The numerical simulations have been conducted with two sets of initial reagent concentrations: [CaCl2] = [Na2C2O4] = 12 mmol.L-1 ; [CaCl2] = 12 mmol.L-1 and
[Na2C2O4] = 0.4 mmol.L-1. The first set of parameters is used as a reference case to
clearly identify the effect of non-equal concentrations applied in the experiments. Setting higher concentration for sodium oxalate allows nucleation within the time scale of numerical simulations, and at the same time, we still maintain sufficient calcium excess. Furthermore, two different total flow rates have been applied, i.e. 2.00 and 0.20 µL.min-1.
Using our in-house code, it is possible to visualize the concentration distributions of chemical species within the microchannel (Figures 4a & b) for the experimental studied concentrations [CaCl2] = 12 mmol.L-1 and [Na2C2O4] = 0.4
mmol.L-1. The fluid flow dominates along the channel (x-axis), indicated by the high
Péclet number defined as
𝑃𝑒 = 𝐿𝑥
𝑢𝑥 𝐷
where 𝐿𝑥=2 mm is the characteristic length yielding, 𝑢𝑥 is the average velocity along the flow (0.33 – 3.3 mm/s) and 𝐷 is the diffusion coefficient (2×10⁻⁹ m2/s)
Pe=330-3300 for the experimental conditions.
However, in the transversal direction (y-axis) diffusion remains the main mode of transport, which is much slower than the advective transport along the channel. Supersaturation develops in the widening mixing zone along the central vertical plane of the channel because the reactants have similar diffusion coefficients. The extent of widening is a function of the flow rate evidently; at low flow rate, effective diffusional mixing is achieved already at the junction, while at high flow rate, complete mixing is only seen beyond 1 mm from the Y-junction. This is in accordance with the experimental observations where for slow flow rates, crystals form right at the contact point (Figure 2a). Even though supersaturationhas its maximum along the contact line as shown in Figure 4c, CaOx crystals mainly form on the oxalate injection side. This is the consequence of the non-stoichiometric feed. The diffusion of calcium ions in excess across the contact line triggers the depletion of oxalate ions by precipitation (Figure 4a). The off-centered accumulation of the colloidal CaOx species (Figure 4d) supports the experimental observations (Figure 2a) as it led to the asymmetric formation of CaOx particles in the reactor. The emergence of CaOx particles hence begins on the side where oxalate is injected to later spread across the entire width of the channel away far from the junction.
Figure 4. Concentration profiles of reactants (a) sodium oxalate, (b) calcium chloride; (c)
Supersaturation in the mixing zone; (d) Spatial distribution of the intermediate colloidal CaOx species in the center horizontal layer (z= 50 μm) of the channel at Qtot = 2.00 μL.min-1. Visible channel length is 1 mm.
Simulations gave an estimate of the temporal evolution of the number of particles formed in the microchannel (see SI, Figure S2) Herein, the reaction is triggered through homogeneous nucleation in solution. Consequently, the cascade of events leading to CaOx particles stands for one possible route with respect to crystallization in the micro-reactor. The density of the solid particles is larger than that of the solution, therefore, they begin to sediment as soon as they form. Because of the excess in calcium ions and the slow transverse vortex, most particles appear in the upper layers on the side of the oxalate injection and the majority of them exit the channel with the fluid at high flow rate (2 µL.min-1). When nucleation occurs close to
the bottom of the channel, the sedimenting particle can accumulate on the bottom. In the case of low flow rate, most particles have time to sediment and reach the bottom and no particle leave the channel.
Once sedimented, the particles continue to grow as shown in Figure 5. However, the growth rate of particles does not solely depend on the supersaturation but on the occupancy of a local site as well. For isolated particles, indicated by black
and red symbols in Figure 5a, the corresponding growth rate scales as d ∝ t1/3 (Figure
5b) in accordance with experimental observations presented in the previous section. On the other hand, the growth rate is significantly slower for crowded population of particles. Hence, the growth of one particle is correlated to the growth of its respective neighbors.
Figure 5. (a) Location of a selection of particles formed near the junction at Qtot = 2.00 μL.min -1 that have sedimented at the bottom of the channel (z=0). (b) Growth profile of particles indicated by an arrow with the corresponding color in (a). Also shown with solid lines are the scaling laws for isolated particles. Precipitation occurs on the oxalate injection side (y>0).
Furthermore, the model allowed monitoring of the size distribution of particles exiting the channel (see SI, Figure S3), revealing a good monodispersity with d=1.8-2.2 µm and indicating a uniform residence time for the particles inside the reactor.
Effect of polyphenolic molecules from green tea on CaOx crystallization
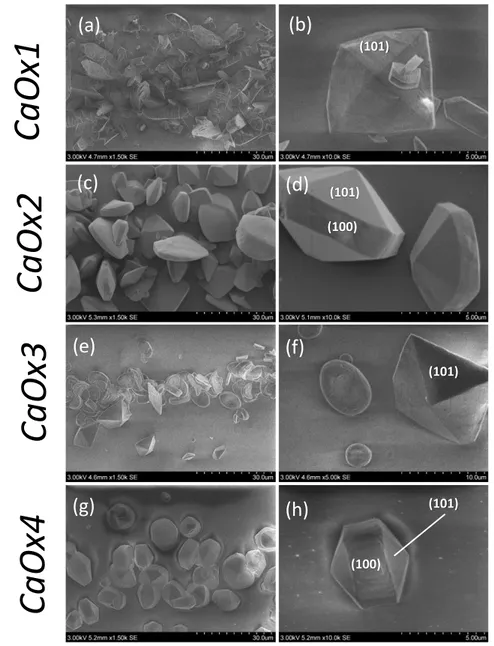
Figure 6. SEM micrographs depicting the effect of GT on CaOx crystallization in the collecting
duct-like microchannel device according to experimental conditions: (a & b) CaOx1 (Ox 2-(aq) +
Ca2+
(aq)); (c & d) CaOx2 (Ox2-(GT) + Ca2+(aq)); (e & f) CaOx3 (Ox2-(aq) + Ca2+(GT)) ; (g & h)
CaOx4 (Ox
2-(GT) + Ca2+(GT)). At all conditions, solutions are continuously injected in the
microfluidic device at Qtot = 2.00 µL.min-1 for two hours.
In the assembled collecting duct-like microchannel, the effect of polyphenolic compounds from green tea (GT) on CaOx crystallization was investigated under
(101) (101) (100) (101) (101) (100)
C
a
O
x1
C
a
O
x2
C
a
O
x3
C
a
O
x4
(b)
(a)
(c)
(d)
(e)
(f)
(g)
(h)
different scenarios as described in Figure S4. The first experimental condition, i.e.
CaOx1 (Figure S4a), was extensively studied previously and served as the standard
condition (without any GT). Under the following three conditions, CaOx crystallization was induced through the co-laminar mixing of Ox
2-(GT) and Ca2+(aq) ions (CaOx2 in
Figure S4b), Ox
2-(aq) and Ca2+(GT) ions (CaOx3 in Figure S4c) and Ox2-(GT) and Ca2+(GT)
ions (CaOx4 Figure S4d). At all conditions, the precursors were continuously injected in the microreactor at Qtot = 2.00 µL.min-1 for two hours. SEM results corresponding to
the four scenarios of interest are presented in Figure 6.
First of all, we observed that CaOx crystal sizes, morphologies and crystalline phases were very different according to the scenarios studied. The series of images confirmed the clear effect of physicochemical conditions (and concentration gradients) on CaOx crystal formation. As already demonstrated CaOx crystallization under
CaOx1 condition (i.e. in total absence of GT) resulted in a mixture of rare flatted
bipyramidal COD crystals and dominant COM crystals of maximum size ≈ 8 µm and ≈ 24 µm, respectively. In presence of GT, we assessed a higher occurrence of COD crystals of a maximum size ≈ 20 µm for all conditions (Figures 6c-h), and also some unusual COM crystalline morphologies (e.g. CaOx2 and CaOx4 conditions) with maximum size ≈ 15 µm. The effect of GT on the morphology and the size of CaOx crystals contrasted drastically whether it was first mixed in solution with Ox
2-(GT) ions or
Ca2+
(GT) ions. Under co-laminar mixing of Ox2-(GT) and Ca2+(aq) (i.e. CaOx2), only COD
crystals as confirmed by Raman analysis (Figure S5a) with size up to ≈ 20 µm, were detected (Figure 6c). They exhibited an elongated bipyramid habit with the over-expression of the (100) crystalline face (Figure 6d). Under the CaOx3 scenario, CaOx crystals precipitated in a mixture of COM and occasional COD crystals of maximum size ≈ 15 µm (Figure 6e). Unlike the CaOx1 condition, COM crystals exhibited a single
round-shaped morphology with concave crystalline face (Figure 6f). Such crystal shape is unusual when precipitation occurs under batch conditions and in absence of additives. Yet, similar morphology was reported using batch syntheses in presence of osteopontin10 as well as in urine of stone formers11. On the other hand, COD crystals,
as revealed by Raman analysis (Figure S5b), were found under flatted bipyramidal shapes. Last, the CaOx4 condition (i.e. co-laminar mixing of Ox2-(GT) and Ca2+(GT))
presented results comparable to the CaOx2 condition (Figures 8c & g). No COM crystals were found and COD crystals (up to ≈ 15 µm) showed solely the (100) elongated bipyramidal morphology (Figure 6h) with highly over-expressed (100) face compared to COD crystals in the CaOx2 scenario. We came to the same conclusion as Chen et al.31 who assessed the effectiveness of GT to shift the crystallization of
CaOx crystals from COM to COD : the chemical composition on either side of the liquid-liquid interface and, consequently, the corresponding concentration gradients within the microchannel directly affected the formation and habits of CaOx crystals. At [Ox
2-](aq) = 0.4 mmol.L-1 and [Ca2+](aq) = 12.0 mmol.L-1, Ca2+(aq) ions are transported faster
through diffusion to the oxalate side rather than to the opposite. In addition, depending on the side of the interface where GT was found, Ca2+ and Ox2- ions did not encounter
the same chemical environment during diffusion. Under the CaOx2 condition (i.e. GT on the oxalate-rich side), (100) elongated COD crystal (Figure 6d) resulted from the mixing of Ox
2-(GT) and Ca2+(aq) ions. This morphology was comparable with the one
found in pathological case of severe hypercalciuria11 and was also obtained after batch
crystallization by Chen et al.31 The authors supported the idea that H-bonds between
the polyphenol groups of GT and the oxalate groups in CaOx crystals played a key role in the inhibition of COM crystal growth. However, it is worth mentioning that they first mixed GT with Ca2+ precursor unlike us. In the context of our work, we think that the
potential interactions of polyphenols and Ox2- ions in solution results in a lesser
reactivity of Ox2- ions. Consequently, the diffusion of Ox
2-(GT) ions is limited as
compared to free Ox
2-(aq) ions, leading to apparent higher hypercalciuria in the overall
system.
When GT is on the calcium-rich side of the liquid-liquid interface (i.e. CaOx3), a mixture of round-shaped COM and flatted bipyramid COD crystals was found (Figure 6f). Compared to the correlative study by Daudon et al., this result is similar to the pathological case of combined hyperoxaluria and hypercalciuria.11 Moreover, COM
crystals interestingly exhibited a crystal habit previously reported in the literature in presence of osteopontin protein.9, 10, 24 Osteopontin appears to preferentially adsorb on
(100)/(121) edges and (100) face due to hydrophilic properties.9 Regarding the
polyphenol molecules from GT, their hydrophilic properties can confer preferential interactions with growing CaOx crystals and therefore explain the final round-shape morphology of COM crystals. The very last experimental condition, i.e. CaOx4, showed that Ox
2-(GT) ion depletion is a limiting factor as in the CaOx2 case (Figure 6g).
Using our light microscopy setup, it was difficult to follow in the channel the kinetic of growth of other crystals with shapes different from the anisotropic boat like COM morphology. Consequently, we measured the induction time for each scenario and compared it to the case without GT as an assessment of the effect of GT on the formation rate. While the first microscopic CaOx crystal appeared in the channel after an induction time t0 = 1 min for CaOx1 scenario (without GT) it increased to 1.9 min for
CaOx2 scenario, 2.4 min for CaOx3 scenario and 2.9 min for CaOx4 scenario. These
results show that the presence of GT in all cases delays CaOx crystal formation which can be attributed to a slower self-diffusion of Ox2- and/or Ca2+ in presence of GT in the
collecting duct-like microchannel together with some changes in the solubility of CaOx in presence of GT affecting consequently the formation of CaOx crystals.
CONCLUSION
In this work, a microfluidic reversible assembly was used as a platform to investigate CaOx crystal formation at the diffusive interface under physical and physico-chemical conditions close to the ones found in the collecting duct of nephrons. First, the effect of hydrodynamics on the crystal habits was studied. CaOx crystals were characterized in terms of their relative yield, crystalline phase, and the results were compared with medical observations. Likewise, in patient’s urine with combined hypercalciuria and hyperoxaluria, COD crystals were observed at the exit of our microchannel. Nevertheless, CaOx crystals found inside the microchannel resulted in a mixture of COM and COD crystals. We showed on the basis of experiments that a decrease in the flow rate, and therefore an increase in diffusion compared to convection, increases the frequency of COD formation. Moreover, the versatility of the microfluidic device allowed us also to study in situ the kinetics of COM crystal formation under co-laminar flow of Ca2+
(aq) and Ox2-(aq) ions. The results showed that the crystals
grow with time by a surface limited reaction followed by a volume limited reaction. An in-house analytical and numerical model was proposed for CaOx precipitation. The numerical simulations using a reaction-diffusion-convection model with particle tracking not only confirmed the experimental observations on the location of precipitate formation but also quantitatively matched the scaling law related to the early growth of precipitate particles where particle distance is large. For less supersaturated cases, the introduction of stochastic description for the nucleation can further improve the model.In a last part, we investigated the influence of green tea (GT) on its ability to modulate CaOx crystallization according to different scenarios. In agreement with
batch crystallization, we positively confirmed the influence of GT to favor the formation of COD crystals rather than COM crystals using the collecting duct-like microchannel. However, we showed that the chemical composition on either side of the liquid-liquid interface (i.e. “where” GT is) is an important factor with respect to the nature of the CaOx crystalline phases and crystal habits. Some conditions resulted in only (100) elongated bipyramidal COD crystals while others rather favored a few flattened bipyramidal COD crystals among round-shaped COM crystals. In all cases, the presence of GT increased the induction time of crystals formation.
In fine, we believe that this platform, as a predictive tool, could help the biomedical community in the diagnosis of pathologies related to KS formation. Actually, the identification of COD crystals in urine and COM crystals predominating in human kidney tubules fits with our observations. In the future we will upgrade this platform to mimic more complex renal conditions like the presence of the Randall’s plaque in the nephron.
ASSOCIATED Content
Supporting Information. Optical micrographs of the crystals collected at the exit of
the channel, size distribution with time of CaOx crystals in and the outlet of the channel, schematic representation of the different scenarios used for the experiments with green tea and Raman mapping of the CaOx crystals obtained with these scenarios.
AUTHOR INFORMATION Corresponding Authors
Ali Abou-Hassan ali.abou_hassan@sorbonne-universite.fr
ACKNOWLEDGEMENTS
We thank Jérémie-Luc Sanchez and Guillaume Laffite for technical support for microfluidic chip conception. Prof. Emmanuel Letavernier (Tenon Hospital, Inserm 1155, Sorbonne Université) is acknowledged for fruitful discussions. This work is funded by the doctoral school 397 “Physique et Chimie des Matériaux” (Sorbonne Université), by French state funds managed by the ANR within the Investissements d’Avenir programme under reference ANR-11-IDEX-0004-02, and more specifically within the framework of LabEx MATISSE (Sorbonne Université) and Fondation de la Recherche Medicale (FRM). We also received technical support of “Institut Pierre-Gilles de Gennes” (programme investissement d’avenir ANR-10-EQPX-34). The authors also acknowledge LabEx MICHEM (Sorbonne Université) for the use of nano/micro Raman facilities. PP. ÁT. and DH thank the financial support of National Research, Development and Innovation Office (NN125746) and GINOP-2.3.2-15-2016-00013 project.
References
1. Daudon, M. Epidemiology of nephrolithiasis in France. Ann. Urol. (Paris) 2005,
39, 209-231.
2. Romero, V.; Akpinar, H.; Assimos, D. G., Kidney Stones: A Global Picture of Prevalence, Incidence, and Associated Risk Factors. Rev. Urol. 2010, 12, e86-e96. 3. Kavanagh, J. P., In vitro calcium oxalate crystallisation methods. Urol. Res.
2006, 34, 139-145.
4. Thongboonkerd, V.; Semangoen, T.; Chutipongtanate, S., Factors determining types and morphologies of calcium oxalate crystals: Molar concentrations, buffering, pH, stirring and temperature. Clin. Chim. Acta 2006, 367, 120-131.
5. Bek-Jensen, H.; Fornander, A.-M.; Nilsson, M.-A.; Tiselius, H.-G., Is citrate an inhibitor of calcium oxalate crystal growth in high concentrations of urine? Urol. Res.
1996, 24, 67-71.
6. Hess, B.; Jordi, S.; Zipperle, L.; Ettinger, E.; Giovanoli, R., Citrate determines calcium oxalate crystallization kinetics and crystal morphology—studies in the presence of Tamm–Horsfall protein of a healthy subject and a severely recurrent calcium stone former. Neph. Dial. Transp. 2000, 15, 366-374.
7. Reid, D. G.; Duer, M. J.; Jackson, G. E.; Murray, R. C.; Rodgers, A. L.; Shanahan, C. M., Citrate Occurs Widely in Healthy and Pathological Apatitic Biomineral: Mineralized Articular Cartilage, and Intimal Atherosclerotic Plaque and Apatitic Kidney Stones. Calcif. Tissue Int. 2013, 93, 253-260.
8. Qiu, S. R.; Wierzbicki, A.; Orme, C. A.; Cody, A. M.; Hoyer, J. R.; Nancollas, G. H.; Zepeda, S.; De Yoreo, J. J., Molecular modulation of calcium oxalate crystallization by osteopontin and citrate. Proc. Natl. Acad. Sci. U.S.A. 2004, 101, 1811-1815.
9. Grohe, B.; Taller, A.; Vincent, P. L.; Tieu, L. D.; Rogers, K. A.; Heiss, A.; So̷rensen, E. S.; Mittler, S.; Goldberg, H. A.; Hunter, G. K., Crystallization of Calcium
Oxalates Is Controlled by Molecular Hydrophilicity and Specific Polyanion-Crystal Interactions. Langmuir 2009, 25, 11635-11646.
10. Langdon, A.; Grohe, B., The osteopontin-controlled switching of calcium oxalate monohydrate morphologies in artificial urine provides insights into the formation of papillary kidney stones. Coll. Surf. B: Biointerf. 2016, 146, 296-306.
11. Daudon, M.; Letavernier, E.; Frochot, V.; Haymann, J.-P.; Bazin, D.; Jungers, P., Respective influence of calcium and oxalate urine concentration on the formation of calcium oxalate monohydrate or dihydrate crystals. C. R. Chimie 2016, 19, 1504-1513.
12. Daudon, M.; Jungers, P., Clinical Value of Crystalluria and Quantitative Morphoconstitutional Analysis of Urinary Calculi. Neph. Phys. 2004, 98, 31-36.
13. Laffite, G.; Leroy, C.; Bonhomme, C.; Bonhomme-Coury, L.; Letavernier, E.; Daudon, M.; Frochot, V.; Haymann, J. P.; Rouziere, S.; Lucas, I. T.; Bazin, D.; Babonneau, F.; Abou-Hassan, A., Calcium oxalate precipitation by diffusion using laminar microfluidics: toward a biomimetic model of pathological microcalcifications.
Lab Chip 2016, 16, 1157-1160.
14. Bohner, B.; Endrődi, B.; Horváth, D.; Tóth, Á., Flow-driven pattern formation in the calcium-oxalate system. J. Chem. Phys. 2016, 144, 164504.
15. Gombedza, F.; Evans, S.; Shin, S.; Awuah Boadi, E.; Zhang, Q.; Nie, Z.; Bandyopadhyay, B. C., Melamine promotes calcium crystal formation in three-dimensional microfluidic device. Sci. Rep. 2019, 9, 875.
16. Daudon, M.; Jungers, P.; Traxer, O., Lithiase urinaire; Lavoisier Médecine Sciences publications: Paris, 2012.
17. Vize, P. D.; Woolf, A. S.; Bard, J. B. L., The Kidney: From Normal Development
to Congenital Disease. Elsevier Science: 2003.
18. Jang, K.-J.; Suh, K.-Y., A multi-layer microfluidic device for efficient culture and analysis of renal tubular cells. Lab Chip 2010, 10, 36-42.
19. Dogliotti, E.; Vezzoli, G.; Nouvenne, A.; Meschi, T.; Terranegra, A.; Mingione, A.; Brasacchio, C.; Raspini, B.; Cusi, D.; Soldati, L., Nutrition in calcium nephrolithiasis. J. Trans. Med. 2013, 11, 109.
20. Wei, Z.; Amponsah, P. K.; Al-Shatti, M.; Nie, Z.; Bandyopadhyay, B. C., Engineering of polarized tubular structures in a microfluidic device to study calcium phosphate stone formation. Lab Chip 2012, 12, 4037-4040.
21. Sakolish, C. M.; Philip, B.; Mahler, G. J., A human proximal tubule-on-a-chip to study renal disease and toxicity. Biomicrofluidics 2019, 13, 014107.
22. Zhang, B.; Korolj, A.; Lai, B. F. L.; Radisic, M., Advances in organ-on-a-chip engineering. Nat. Rev. Mat. 2018, 3, 257-278.
23. Kim, S.; Takayama, S., Organ-on-a-chip and the kidney. Kidney Res. Clin.
Pract. 2015, 34, 165-169.
24. Kuliasha, C. A.; Rodriguez, D.; Lovett, A.; Gower, L. B., In situ flow cell platform for examining calcium oxalate and calcium phosphate crystallization on films of basement membrane extract in the presence of urinary ‘inhibitors’. CrystEngComm
2020, 22, 1448-1458.
25. Frassetto, L.; Kohlstadt, I.; H., M. P., Kidney Stones. In Advancing Medicine
with Food and Nutrients, Second Edition, CRC Press: 2012
26. Engelhardt, U. H., Chemistry of Tea. In Reference Module in Chemistry,
Molecular Sciences and Chemical Engineering, Elsevier: 2013.
27. Benzerara, Y.; Daudon , M.; Bazin , D.; Haymann, J. P.; Rode, J. Catechin for treating renal lithiasis. 2015.
28. Rodgers, A.; Mokoena, M.; Durbach, I.; Lazarus, J.; de Jager, S.; Ackermann, H.; Breytenbach, I.; Okada, A.; Usami, M.; Hirose, Y.; Ando, R.; Yasui, T.; Kohri, K., Do teas rich in antioxidants reduce the physicochemical and peroxidative risk factors for calcium oxalate nephrolithiasis in humans? Pilot studies with Rooibos herbal tea and Japanese green tea. Urolithiasis 2016, 44, 299-310.
29. Jeong, B. C.; Kim, B. S.; Kim, J. I.; Kim, H. H., Effects of green tea on urinary stone formation: an in vivo and in vitro study. J. Endourol. 2006, 20, 356-361.
30. Kanlaya, R.; Singhto, N.; Thongboonkerd, V., EGCG decreases binding of calcium oxalate monohydrate crystals onto renal tubular cells via decreased surface expression of alpha-enolase. J. Biol. Inorg. Chem. 2016, 21, 339-346.
31. Chen, Z.; Wang, C.; Zhou, H.; Sang, L.; Li, X., Modulation of calcium oxalate crystallization by commonly consumed green tea. CrystEngComm 2010, 12, 845-852. 32. Sheng, X.; Ward, M. D.; Wesson, J. A., Crystal surface adhesion explains the pathological activity of calcium oxalate hydrates in kidney stone formation. J. Am. Soc.
Neph. 2005, 16, 1904-1908.
33. Rasponi, M.; Piraino, F.; Sadr, N.; Laganà, M.; Redaelli, A.; Moretti, M., Reliable magnetic reversible assembly of complex microfluidic devices: fabrication, characterization, and biological validation. Microfluidi. Nanofluidics 2011, 10, 1097-1107.
34. Atomssa, T.; Gholap, A., Characterization and determination of catechins in green tea leaves using UV-visible spectrometer. J. Eng. Tech. Res. 2015, 7, 22-31. 35. Buffle, J.; Zhang, Z.; Startchev, K., Metal Flux and Dynamic Speciation at (Bio)interfaces. Part I: Critical Evaluation and Compilation of Physicochemical Parameters for Complexes with Simple Ligands and Fulvic/Humic Substances.
Environ. Sci. Tech. 2007, 41, 7609-7620.
36. Kodati, V. R.; Tomasi, G. E.; Turumin, J. L.; Tu, A. T., Raman Spectroscopic Identification of Calcium-Oxalate-Type Kidney Stone. App. Spectro. 1990, 44, 1408-1411.
37. Daudon, M.; Frochot, V., Crystalluria. Clin. Chem. Lab. Med. 2015, 53, 1479-1487.
38. Huguet, L.; Le Dudal, M.; Livrozet, M.; Bazin, D.; Frochot, V.; Perez, J.; Haymann, J. P.; Brocheriou, I.; Daudon, M.; Letavernier, E., High frequency and wide range of human kidney papillary crystalline plugs. Urolithiasis 2018, 46, 333-341. 39. Yamanaka, S.; Ito, N.; Akiyama, K.; Shimosaka, A.; Shirakawa, Y.; Hidaka, J., Heterogeneous nucleation and growth mechanism on hydrophilic and hydrophobic surface. Adv. Powder Technol. 2012, 23, 268-272.
40. Weller, H. G.; Tabor, G.; Jasak, H.; Fureby, C., A tensorial approach to computational continuum mechanics using object-oriented techniques. Comput. Phys.
1998, 12, 620-631.
41. Issa, R. I., Solution of the implicitly discretised fluid flow equations by operator-splitting. J. Comput. Phys. 1986, 62, 40-65.
Table of contents
SYNOPSIS: In relation with nephrolithiasis a physico-chemical microfluidic approach is used to study the formation of calcium oxalate crystals in a microchannel with similar dimensions of a nephron. The effect of hydrodynamics in absence or presence of green tea on crystals formation is studied and a numerical model accounting for the different parameters is proposed.
CaCl
2NaOX
Green
Tea
Supporting Information
Investigating CaOx crystal formation in absence and
presence of polyphenols under microfluidic conditions in relation
with nephrolithiasis
Karol Rakotozandriny,1,2 Samantha Bourg,1,2 Paszkál Papp,3 Ágota Tóth,3 Dezső
Horváth,4 Ivan T. Lucas,5 Florence Babonneau,2 Christian Bonhomme2* and Ali
Abou-Hassan1*
1 Sorbonne Université, CNRS UMR 8234, Laboratoire de PHysico-chimie des Électrolytes et Nanosystèmes InterfaciauX, PHENIX, F-75252 Paris Cedex 05, France
2 Sorbonne Université, CNRS UMR 7574, Laboratoire de Chimie de la Matière Condensée de Paris, LCMCP, F-75005 Paris, France
3 Department of Physical Chemistry and Materials Science, University of Szeged, Rerrich Bela ter 1. Szeged H-6720 Hungary
4 Department of Applied and Environmental Chemistry, University of Szeged, Rerrich Bela ter 1. Szeged H-6720 Hungary
5 Sorbonne Université, CNRS UMR8235, Laboratoire Interfaces et Systèmes Electrochimiques, LISE, F-75005, Paris, France.
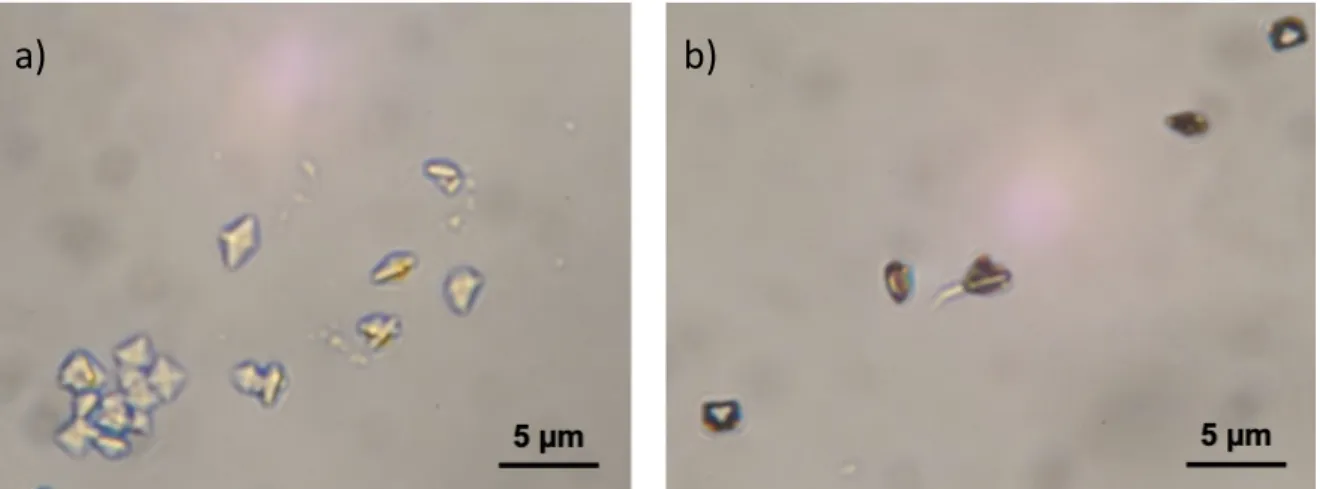
Figure S1. Optical micrographs of collected CaOx crystals at the outlet of the
microfluidic platform for a) 2.00 μL.min-1 (Figure 2a) and b) 0.20 μL.min-1 (Figure 2b).
Figure S3. Size distribution of CaOx crystals at the outlet of the microchannel at
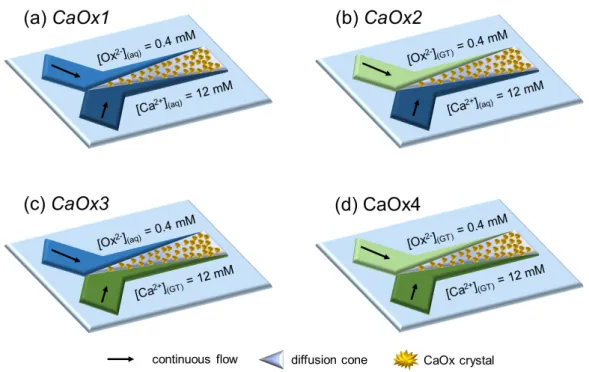
Figure S4. Schematic illustrations of the experimental conditions to study the effect of
polyphenolic catechins from green tea (GT) on CaOx crystallization in the collecting duct-like microchannel. CaOx crystallization is induced through the co-laminar mixing of either (a) Ox
2-(aq) and Ca2+(aq) ions (standard condition named CaOx1), (b) Ox2-(GT)
and Ca2+
(aq) ions (CaOx2), (c) Ox2-(aq) and Ca2+(GT) ions (CaOx3) or (d) Ox2-(GT) and
Ca2+(GT) ions (CaOx4). At all conditions, solutions are continuously injected in the
Figure S5. Raman mapping of CaOx crystals corresponding to a) CaOx2 condition
(mixing of Ox2-(GT) and Ca2+(aq) ions) and b) CaOx3 condition (mixing of Ox2-(aq) and
Ca2+(GT) ions); c-d) Raman spectra of COM crystal in green and COD crystals in red
for CaOx2 (c) and CaOx3 (d), respectively. Similar “false-color” is used to discriminate COM from COD crystals on the micrographs.