HAL Id: hal-02400030
https://hal-univ-rennes1.archives-ouvertes.fr/hal-02400030
Submitted on 7 Jan 2021HAL is a multi-disciplinary open access archive for the deposit and dissemination of sci-entific research documents, whether they are pub-lished or not. The documents may come from teaching and research institutions in France or abroad, or from public or private research centers.
L’archive ouverte pluridisciplinaire HAL, est destinée au dépôt et à la diffusion de documents scientifiques de niveau recherche, publiés ou non, émanant des établissements d’enseignement et de recherche français ou étrangers, des laboratoires publics ou privés.
Mid-IR s-SNOM imaging of photo-induced refractive
index variation in chalcogenide glass
L. Thomas, S. Eliet, J. Carcreff, J.F. Lampin, E. Bychkov, David Le Coq, P.
Masselin
To cite this version:
L. Thomas, S. Eliet, J. Carcreff, J.F. Lampin, E. Bychkov, et al.. Mid-IR s-SNOM imaging of photo-induced refractive index variation in chalcogenide glass. 44th International Conference on In-frared, Millimeter, and Terahertz Waves, IRMMW-THz 2019, Sep 2019, Paris, France. pp.8874029, �10.1109/IRMMW-THz.2019.8874029�. �hal-02400030�
MID-IR S-SNOM IMAGING OF PHOTO-INDUCED REFRACTIVE
INDEX VARIATION IN CHALCOGENIDE GLASS
L. Thomas1, S. Eliet1, J. Carcreff3, J.-F. Lampin1, E. Bychkov2, D. Le Coq3 and P. Masselin2
1Institut d’Electronique, de Microélectronique et de Nanotechnologie, CNRS, Univ. Lille,
Villeneuve d'Ascq, 59652 France
2Laboratoire de Physico-Chimie de l’Atmosphère, Université du Littoral Côte d’Opale,
Dunkerque, F-59140 France
3Institut des Sciences Chimiques de Rennes, Univ. Rennes, CNRS,
Rennes, F-35000 France
Abstract — We report the mid-IR s-SNOM surface characterization of a chalcogenide glass photo-inscribed by ultra-short laser pulses. Imaging allows to access to the morphology and the optical properties of the material at nanoscale, unravelling topographical and optical contrasts resulting from the laser inscription process.
I.INTRODUCTION
The need to process optical signals at mid-infrared (mid-IR) wavelengths (2-25 µm) for chemical and biochemical sensing motivates the search of materials able to receive and transmit efficiently electromagnetic waves in this spectral region. However, considering these two criteria, commonly employed semiconductor waveguides, showing typical losses of 10 dB for coupling and > 1 dB.cm-1 for
propagation, appear to be ill suited in this range. An alternative approach consists of propagating mid-IR waves through lattices inscribed in transparent mediums. Among these materials, chalcogenide glasses demonstrating low propagating losses in the mid-IR appear as good candidates. A strategy employed to realize waveguides is the photo-writing of the material by the ultrafast laser inscription (ULI) technique where trains of femtosecond laser pulses irradiate the material during a controlled time of exposure, leading
to the formation of filaments of higher refractive index [1]. The glass is then sliced and polished to extract the photonic device from the material. In order to better understand and improve the process, we investigated the resulting photo-inscribed refractive index variation by a near-field technique to image the resulting spatial features smaller than λ/2 that conventional far-field microscopy could not resolve.
We report the mid-IR imaging of ULI inscribed chalcogenide glass [0.8GeS2 − 0.2Ga2S3]90 – [CsCl]10 [2, 3]
by scattering scanning near-field optical microscopy (s-SNOM). The s-SNOM combines an atomic force microscope operating in intermittent contact mode with the far-field detection of the light scattered at the apex of the tip, acting as a nano-light source (apex of the tip in the few 10 nm range). This technique therefore records the physical topography of the sample while probing simultaneously its optical properties at sub-wavelength resolution [4].
II. GLASS MODIFICATION PROCEDURE
We performed the ULI process in a quasi-static procedure as follow (Fig. 1): First, the laser beam (800 nm wavelength) is focused in the sample using a lens of focal length equal to 50 mm. Then, the sample is irradiated for a duration τ by a burst of femtosecond pulses (250 fs) at a repetition rate of 200 kHz at fixed power. This results in an increase of the length of the channel. Next, the sample is translated longitudinally,
i.e. parallel to the laser beam, and the irradiation is repeated until the channel length reaches 20 mm.
Finally, the sample is cut perpendicularly to the channel and the surface is polished to optical quality. This procedure is equivalent to the one used in [3] to write waveguides for mid-infrared wavelength.
III. RESULTS
We carried out s-SNOM imaging on a lattice of ULI inscribed spots where we attributed a given time of exposure per spot to each column in order to prospect the influence of τ, ranging from 25 to 400 ms, on the formation of the filaments. In the same location, we realized images at incident wavelength of 8.5 and 10.1 µm (optical power of 3 and 5 mW at λ = 8.5 and λ = 10.1 µm respectively). We performed s-SNOM imaging by self-homodyne detection of the optical signals recorded by a liquid nitrogen cooled HgCdTe
detector and demodulated at the fourth harmonic of the cantilever oscillations (O4).
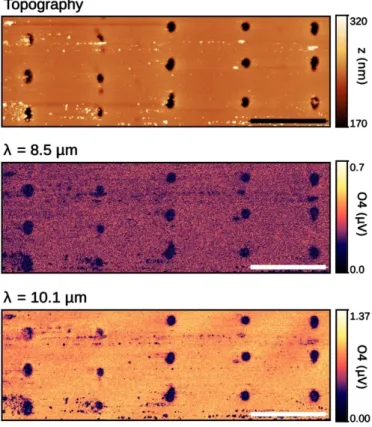
Near-field characterization revealed that the ULI process led to well-defined sub-wavelength regions of optical contrast at both incident wavelengths (Fig. 2, central and bottom panels). In these micrometer-sized spots, the average magnitude of the scattered field decrease of ca. 70 and 60% at λ = 8.5 and λ = 10.1 µm respectively, compared to the pristine glass matrix. We recorded no s-SNOM contrast for τ shorter than 125 ms, setting a time threshold between 100 and 125 ms as the limit to observe the refractive index variation. In addition, we also observed morphological contrast in the photo-inscribed areas where pits decorate the surface (Fig. 2, top panel). Average depth of the pits ranges from 11 nm at τ = 75 ms to ca. 200 nm for τ ≥ 125 ms. Similarly as the mid-IR imaging, morphology of the glass is also left almost unmodified for τ < 125 ms. Presence of the deeper pits only in the successfully processed regions can be linked to the slicing or polishing steps. Since the chalcogenide glass undergoes a structural modification, the mechanical properties of the modified areas may significantly differ from those of the pristine glass. Therefore, slicing may induce stress relaxation or polishing may lead to selective abrasion of the higher index region on the surface.
IV. SUMMARY
In summary, we applied the s-SNOM imaging to understand the surface phenomena resulting from bulk modification of the material occurring during the ULI processing of a mid-IR optical device. Imaging revealed a duration threshold for the successful laser inscription of the chalcogenide glass and exposed the alteration of the surface morphology, associated with the modification of the underneath optical properties.
V. ACKNOWLEDGMENTS
This work was partially supported by: i) the international chair of excellence “ThOTroV” from region “Hauts-de-France”; ii) the French government through the National Research Agency (ANR) under program COMI ANR-17-CE24-0002 and ExCELSiOR ANR 11-EQPX-0015; iii) the French RENATECH network on micro and nanotechnologies; and iv) the Ministry of Higher Education and Research, Hauts de
France council and European Regional Development Fund (ERDF) through the Contrat de Projets Etat-Region (CPER) Photonics for Society P4S.
REFERENCES
[1]. R. Osellame, G. Cerullo, and R. Ramponi, “Femtosecond Laser Micromachining: Photonic and Microfluidic Devices in Transparent Materials,” Topics in Applied Physics. Berlin, Germany: Springer, 2012.
[2]. P. Masselin, E. Bychkov and D. Le Coq, “Direct laser writing of a low-loss waveguide with independent control over the transverse dimension and the refractive index contrast between the core and the cladding,” Optics Letters, vol. 41, pp. 3507-3510, august, 2016.
[3]. P. Masselin, E. Bychkov and D. Le Coq, “Ultrafast Laser Inscription of High-Performance Mid-Infrared Waveguides in Chalcogenide Glass,” IEEE Photonics Technology Letters, vol. 30, pp. 2123-2128, december, 2018.
[4]. R. Hillenbrand, T. Taubner and F. Keilmann, “Phonon-enhanced light–matter interaction at the nanometre scale,” Nature, vol. 418, pp. 159-162, july, 2002.
Fig. 2. s-SNOM imaging of the ULI processed chalcogenide glass. Top panel: Topography of the lattice
inscribed at different τ per spot for each column. z scale range excludes extreme values for clarity. Central panel: s-SNOM signal at λ = 8.5 µm. Bottom panel: s-SNOM signal at λ = 10.1 µm. s-SNOM signals are demodulated at the fourth harmonic of the cantilever oscillations. Scale bar length is 10 µm. Regions successfully inscribed showing optical contrast coincide with deeper pits in the topography.
Fig. 1. Schematic representation (not to scale) of the ULI process: The pristine glass (light green) is irradiated
by a focused laser delivering bursts of fs pulses for a duration τ, leading to the modification of the glass (dark green). The sample is then translated to inscribe a channel in the material. A section of inscribed material (delimited by dashed lines) is finally extracted from the sample and polished.
![Advanced Gate Technologies for State-of-the-art f[subscript T] in AlGaN/GaN HEMTs](data:image/gif;base64,R0lGODlhAQABAIAAAP///wAAACH5BAEAAAAALAAAAAABAAEAAAICRAEAOw==)