HAL Id: hal-01821268
https://hal.umontpellier.fr/hal-01821268
Submitted on 24 Mar 2020
HAL is a multi-disciplinary open access
archive for the deposit and dissemination of
sci-entific research documents, whether they are
pub-lished or not. The documents may come from
teaching and research institutions in France or
abroad, or from public or private research centers.
L’archive ouverte pluridisciplinaire HAL, est
destinée au dépôt et à la diffusion de documents
scientifiques de niveau recherche, publiés ou non,
émanant des établissements d’enseignement et de
recherche français ou étrangers, des laboratoires
publics ou privés.
body surface area model ability to predict delivered dose
and radioembolization outcome
Marilyne Kafrouni, Carole Allimant, Marjolaine Fourcade, Sébastien Vauclin,
Julien Delicque, Alina-Diana Ilonca, Boris Guiu, Federico Manna, Nicolas
Molinari, Denis Mariano-Goulart, et al.
To cite this version:
Marilyne Kafrouni, Carole Allimant, Marjolaine Fourcade, Sébastien Vauclin, Julien Delicque, et al..
Retrospective voxel-based dosimetry for assessing the body surface area model ability to predict
deliv-ered dose and radioembolization outcome. Journal of Nuclear Medicine, Society of Nuclear Medicine,
2018, 59 (8), pp.1289-1295. �10.2967/jnumed.117.202937�. �hal-01821268�
Retrospective Voxel-Based Dosimetry for Assessing the Ability
of the Body-Surface-Area Model to Predict Delivered Dose
and Radioembolization Outcome
Marilyne Kafrouni1–3, Carole Allimant4, Marjolaine Fourcade1, S´ebastien Vauclin2, Julien Delicque4,
Alina-Diana Ilonca1, Boris Guiu3,4, Federico Manna5, Nicolas Molinari3,5, Denis Mariano-Goulart1,3,6,
and Faycxal Ben Bouall`egue1,3,6
1Department of Nuclear Medicine, Montpellier University Hospital, Montpellier, France;2DOSIsoft SA, Cachan, France;3University
of Montpellier, Montpellier, France;4Department of Radiology, Montpellier University Hospital, Montpellier, France;5Department
of Medical Information, Montpellier University Hospital, Montpellier, France; and6PhyMedExp, INSERM-CNRS, Montpellier
University, Montpellier, France
The aim of this study was to quantitatively evaluate the ability of the body-surface-area (BSA) model to predict tumor-absorbed dose and treatment outcome through retrospective voxel-based dosimetry. Methods: Data from 35 hepatocellular carcinoma patients with a total of 4290Y-resin microsphere radioembolization treatments were included.
Injected activity was planned with the BSA model. Voxel dosimetry based on99mTc-labeled macroaggregated albumin SPECT and90
Y-microsphere PET was retrospectively performed using a dedicated treatment planning system. Average dose and dose–volume histograms (DVHs) of the anatomically defined tumors were analyzed. The selected dose metrics extracted from DVHs were minimum dose to 50% and 70% of the tumor volume and percentage of the volume receiving at least 120 Gy. Treatment response was evaluated 6 mo after therapy according to the criteria of the European Association for the Study of the Liver. Results: Six-month response was evaluated in 26 treat-ments: 14 were considered to produce an objective response and 12 a nonresponse. Retrospective evaluation of90Y-microsphere PET–
based dosimetry showed a large interpatient variability with a median average absorbed dose of 60 Gy to the tumor. In 62% (26/42) of the cases, tumor, nontumoral liver, and lung doses would have complied with the recommended thresholds if the injected activity calculated by the BSA method had been increased. Average doses, minimum dose to 50% and 70% of the tumor volume, and percentage of the volume receiving at least 120 Gy were significantly higher in cases of objective response than in nonresponse. Conclusion: In our population, average tumor-absorbed dose and DVH metrics were associated with tumor response. However, the activity calculated by the BSA method could have been increased to reach the recommended tumor dose threshold. Tumor uptake, target and nontarget volumes, and dose distribution heterogeneity should be considered for activity planning. Key Words: dosimetry;90Y-microspheres; radioembolization; BSA;
hepatocellular carcinoma J Nucl Med 2018; 59:1289–1295 DOI: 10.2967/jnumed.117.202937
T
oday, for90Y-resin microspheres (SIR-Spheres; SIRTeXMed-ical), 3 activity-planning methods are recommended by the manu-facturer: the empiric model, the body-surface-area (BSA) model, and the partition model (1,2). The empiric model recommends ex-clusively 3 values of activity based on tumor involvement. The BSA method, which has been historically used for chemotherapy, is based on patient surface area and tumor involvement but neglects the tumor-to-normal liver (T/N) uptake ratio. The partition model, which is based on the MIRD principles and is considered more accu-rate and personalized, accounts for tumor avidity but assumes a uni-form dose distribution in the tumor. Despite its semiempiric nature, the BSA method is the most widely used so far because of its simplicity. Many authors have discussed BSA-model limitations, empha-sizing the lack of correlation with liver volume, tumor avidity, and absorbed dose and recommending more accurate and personalized methods (3–6). However, these limitations have not been quanti-tatively addressed with a voxel-based dosimetry. This study was a retrospective 3-dimensional voxel-based dosimetry analysis of a hepatocellular carcinoma population treated by 90Y-microsphere
radioembolization with injected activity planned using the BSA-method calculation. The aim was to quantitatively evaluate the ability of the BSA method to predict tumor-absorbed dose and treatment outcome.
MATERIALS AND METHODS Patient Characteristics
This study included 35 patients with unresectable hepatocellular carcinoma at our institution who underwent 42 treatments by radio-embolization with90Y-resin microspheres from February 2012 to
De-cember 2015. Of these 35 patients, 23 were included in the ‘‘Sorafenib Versus Radioembolization in Advanced Hepatocellular Carcinoma’’ protocol. Authorization for an ancillary study was obtained from the principal investigator. All patients gave written informed consent to treatment and to retrospective analysis of their clinical and imaging data for research purposes. All procedures were performed in accor-dance with the ethical standards of the institutional and national re-search committee and the Declaration of Helsinki.
The baseline characteristics for the treatments are reported in Table 1. In an individual patient, treatments targeting the right and left lobes separately or sequential treatments at more than a 6-mo interval were considered distinct procedures. There were 1 whole-liver, 35 lobar,
Received Sep. 27, 2017; revision accepted Dec. 30, 2017.
For correspondence or reprints contact: Marilyne Kafrouni, Nuclear Medicine Department, Gui de Chauliac University Hospital, 80 avenue Augustin Fliche, 34295 Montpellier Cedex 5, France.
E-mail: marilyne.kafrouni@gmail.com Published online Mar. 15, 2018.
and 6 segmental treatments. A retrospective dosimetric study was con-ducted on the 42 radioembolization sessions.
99mTc-Labeled Macroaggregated Albumin (99mTc-MAA)
Imaging and Activity Planning
99mTc-MAA was injected into the hepatic artery as a 90
Y-micro-sphere surrogate. Planar and SPECT/CT images were acquired within an hour. This simulation step was used to estimate lung shunt fraction and to verify right targeting and absence of extrahepatic deposition.
SPECT/CT data were acquired using an Infinia Hawkeye IV (GE Healthcare) with the following parameters: spectroscopic window at 140 keV6 10%, 32 projections, 25 s/projection, 128· 128 matrix, 4.4 · 4.42 · 4.42 mm voxels, and low-energy high-resolution collimator.
SPECT data were reconstructed on a Xeleris 3.0562 workstation (GE Healthcare) using ordered-subset expectation maximization with 5 iter-ations and 8 subsets, and attenuation and scatter were corrected using standard commercial solutions (GE Healthcare).
Activity was planned by using the90Y-microsphere manufacturer
recommendations at that time. Following the most recent method pro-posed by Kennedy et al. (7), the BSA model was applied according to the type of treatment. For total liver treatment,
Activity ðGBqÞ 5 BSA 2 0:2 1VVtumor
total liver;
for lobar treatment, Activity ðGBqÞ 5 ! BSA2 0:2 1 !V tumor lobe Vtotal lobe "" ·!Vtotal lobe Vtotal liver " ;
and for segmental treatment, ActivityðGBqÞ5 ! BSA2 0:2 1 !V tumor segment Vtotal segment "" ·!Vtotal segment Vtotal liver " ;
where BSA (m2) 5 0.20247 · height0.725 (m) · weight0.425 (kg),
Vtumor5 tumor volume, Vtumor lobe5 tumor volume in treated lobe,
Vtotal lobe5 lobe volume including tumor, Vtumor segment5 tumor
vol-ume in treated segment, Vtotal segment 5 segment volume including
tumor, and Vtotal liver 5 total liver volume including tumor. These
volumes were previously defined by radiologists on contrast-enhanced CT or MRI.
Lung shunt fraction was evaluated using anterior and posterior planar scans. A dose to the lungs of more than 25 Gy or the presence of significant focal extrahepatic uptake was considered a contraindi-cation to treatment.
90Y-Microsphere Imaging
90Y-microsphere distribution was controlled for each treatment
ses-sion by a PET/CT examination on the next day. Liver-centered PET/ CT acquisitions were performed on a Biograph non–time-of-flight PET/CT device (Siemens Healthcare) for a total scan duration of 40 min. The PET reconstruction parameters for posttreatment dosim-etry were 3-dimensional ordered-subset expectation maximization (1 iteration, 8 subsets) with point-spread-function compensation, attenuation correction, gaussian postfiltering of 4 mm in full width at half maximum, a 128 · 128 matrix, and a voxel size of 5.3 · 5.3· 3.4 mm.
Retrospective Dosimetry
Retrospective99mTc-MAA SPECT– and90Y-microsphere PET–
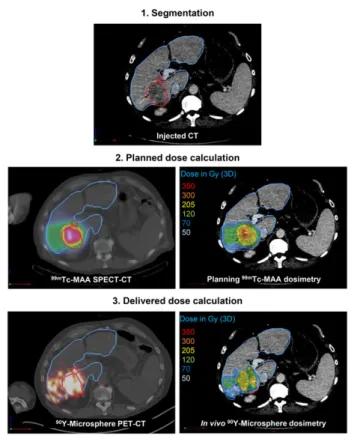
based voxel dosimetry was performed using a treatment-planning sys-tem (PLANET Dose; DOSIsoft SA) following a process similar to the one used in external-beam radiation therapy (Fig. 1).
The first step was the anatomic segmentation of target volumes (considered one global unique volume) and whole-liver volume on contrast-enhanced CT or MR images by a single radiologist using the diagnostic workstation available in the radiology department (AW Workstation; GE Healthcare). When relevant (n5 2), any necrotic (i.e., nonenhancing) area was subtracted from the tumor volume to assess dose in the viable tumor only. Contours were then imported as RT-Struct sets in the treatment-planning system. Lesions smaller than 2 cm were not considered for dose assessment in order to limit bias induced by the partial-volume effect. The nontumoral liver (NTL) volume was defined in the treatment-planning system by subtracting the tumor volume from the total liver volume.
TABLE 1
Baseline Characteristics for 42 Treatments
Clinical variable Data
Mean age± SD (y) 64± 11
Sex (n)
Male 39
Female 3
WHO performance status (n)
0 32 1 10 BCLC classification (n) B 14 C 28 Child classification (n) A5 24 A6 12 B7 6
Prior local therapy* (n)
Yes 27
No 15
Tumor morphology (n)
Infiltrative 21
Nodular 21
Portal vein thrombosis (n)
Yes 21 No 21 Lesions. 2 cm (n) 1 22 2–4 13 $5 7 Tumor burden (%) ,25 33 25–50 7 .50 2
*Chemoembolization or radiofrequency ablation.
WHO5 World Health Organization; BCLC 5 Barcelona Clinic Liver Cancer.
99mTc-MAA SPECT/CT and90Y-microsphere PET/CT images were
coregistered with the reference examination (contrast-enhanced CT or MRI).99mTc-MAA SPECT images were normalized so that total
hepatic uptake matched the actual therapeutic activity corrected for lung shunt fraction and residual activity.
A 3-dimensional dose map was calculated for pre- and posttreat-ment dosimetry using a kernel convolution algorithm at the voxel level based on the formalism detailed in MIRD pamphlet no. 17 (8). The dose to a given target voxel k from N surrounding source voxels h (including the target voxel itself, h5 0) is given by the equation
Dose ðvoxelkÞ 5 + N h5 0
~
AðvoxelhÞ· S ðvoxelk)voxelhÞ;
where ~AðvoxelhÞ is the time-integrated activity within voxel h and
S ðvoxelk)voxelhÞ is the absorbed dose per unit cumulated activity
between each voxel pair (S value). This equation was implemented in the dose calculation algorithm as a discrete convolution between the time-integrated activity map containing each individual ~AðvoxelhÞand
the voxel S-value kernel.
The average dose to the tumor was studied, as well as 3 metrics extracted from dose–volume histograms (DVH): the minimum dose to 50% and 70% of the tumor volume (D50and D70, respectively) and the
percentage of the volume receiving at least 120 Gy (V120).
Therapy Response
Treatment response was evaluated on follow-up contrast-enhanced CT or MRI obtained 6 mo after radioembolization by 2 radiologists. Response was defined according to the recommendations of the European Association for the Study of the Liver (9). Tumor response
was conventionally classified as complete response (absence of any enhancing tissue), partial response ($50% decrease in enhancing tis-sue), progressive disease ($25% increase in size of one or more measurable lesions or appearance of new lesions), or stable disease. Objective response (OR) was defined as either complete or partial response. Stable or progressive disease were considered a nonresponse (NR).
Statistical Analysis
The optimal-to-actual (BSA-planned) activity ratio was calculated for each evaluation based on90Y-microsphere PET dosimetry. Optimal
activity was defined as the injected activity that would enable achieve-ment of the tumor, NTL, and lung dose criteria ($120,,50, and ,30 Gy, respectively), as reported in the literature (7,10). For each case, the ratio lower bound corresponds to an optimal injected activity that would enable deliverance of 120 Gy to the tumor. The ratio upper bound represents the maximal activity complying with the 50-Gy limit to the NTL and the 30-Gy limit to the lungs. When the activity ratio based on the NTL or lung threshold was lower than the ratio based on the tumor threshold, only the NTL or lung tolerance criteria were considered.
Dose metrics based on99mTc-MAA SPECT and 90Y-microsphere
PET were compared using paired Student t tests. 90Y-microsphere–
based dose metrics in OR and NR were compared using the Student t test. Pearson correlation and Bland–Altman analysis were used to evaluate the agreement between optimal activities based on 99m
Tc-MAA and90Y-microsphere dosimetry. A P value of 0.05 or less was
considered significant.
RESULTS
Therapy Response
Six-month response assessment was available in 26 treatments because of early deaths that occurred before 6 mo (n5 16). The 6-mo response rate according to the criteria of the European Asso-ciation for the Study of the Liver for these 26 treatments was 54%. There were 14 ORs, including 4 complete and 10 partial responses, and 12 NRs, including 5 cases of stable disease and 7 of progressive disease. For one patient, response was considered complete because his disease was downstaged and he benefited from a hepatectomy 4 mo after radioembolization.
Dosimetry
Table 2 summarizes the main dosimetric data over the analyzed treatments: injected activity, lung shunt fraction, treated tumor volume, average dose to the tumor and to the NTL, minimum dose to 50% and 70% of tumor volume, and percentage of volume receiving at least 120 Gy. Average dose to the tumor and all DVH indices based on90Y-microsphere PET dosimetry were
sig-nificantly higher in OR than in NR (976 53 Gy vs. 60 6 24 Gy for average dose to tumor; 876 49 Gy vs. 50 6 21 Gy and 61 6 38 Gy vs. 34 6 17 Gy for minimum dose to 50% and 70%, respectively, of tumor volume; and 28%6 28% vs. 9% 6 13% for percentage of volume receiving at least 120 Gy). The differ-ence between 99mTc-MAA SPECT– and 90Y-microsphere PET–
based dosimetry was not significant for any metric except average dose to NTL.
Figure 2 shows the distribution of90Y-microsphere PET–based
average tumor dose and DVH metrics in NR and OR treatments. Number and percentage of responding tumors are specified for stratified ranges of each dose metric, highlighting the dose–effect relationship.
FIGURE 1. Process of retrospective pre- and posttreatment dosime-try. Tumor and NTL are delineated in red and blue, respectively.
Regarding90Y PET–based tumor dosimetry, for an average dose
of 120 Gy or more, all treatments (n5 4) were found to result in an OR. In contrast, for an average dose of 40 Gy or less, all treatments (n5 3) resulted in a progressive disease state. For average doses ranging from 44 to 105 Gy, the treatments resulted in an OR (n5 10), stable disease (n5 5), or progressive disease (n 5 4) state.
Regarding90Y PET–based D
70, for a dose of 80 Gy more, all
treatments (n5 3) were found to result in an OR, with the average tumor dose ranging from 93 to 180 Gy. For doses of 20 Gy or less (which means 30% of the volume was receiving, 20 Gy), all treatments (n5 2) resulted in a progressive disease state, with the average tumor dose being 24–34 Gy. For doses ranging from 23 to 69 Gy, the treatments resulted in an OR (n5 11), stable disease (n5 5), or progressive disease (n 5 5) state.
Optimal Activity
For each of the 42 treatments, the optimal activity to reach a dose of 120 Gy to the tumor was calculated using a proportionality relationship based on90Y-microsphere dosimetry and ranged from 0.43
to 7.8 GBq. When the 50- and 30-Gy limits were added to the NTL and lungs, respectively, the optimal activity ranged from 0.43 to 6.9 GBq. The ratio of the optimal activity to the activity planned by the BSA model was calculated for each of the 26 treatments that were evaluated at 6 mo. Figure 3 shows the ratios according to tumor response. The ratios to reach an average dose of 120 Gy to the tumor while keeping the dose to the NTL and the lungs under the tolerance thresholds were significantly higher in the NR group (2.36 1.1; range, 1.125.1) than in the OR group (1.4 6 0.6; range, 0.622.7; P 5 0.03). In 73% of the treatments (19/26), 120 Gy to the tumor could have been delivered while keeping the dose to the NTL and lungs less than 50 and 30 Gy, respectively. Considering all treatments, this proportion was 62% (26/42). In the remaining treatments, the 120-Gy objective would not have been achievable because of unfavorable tumor targeting.
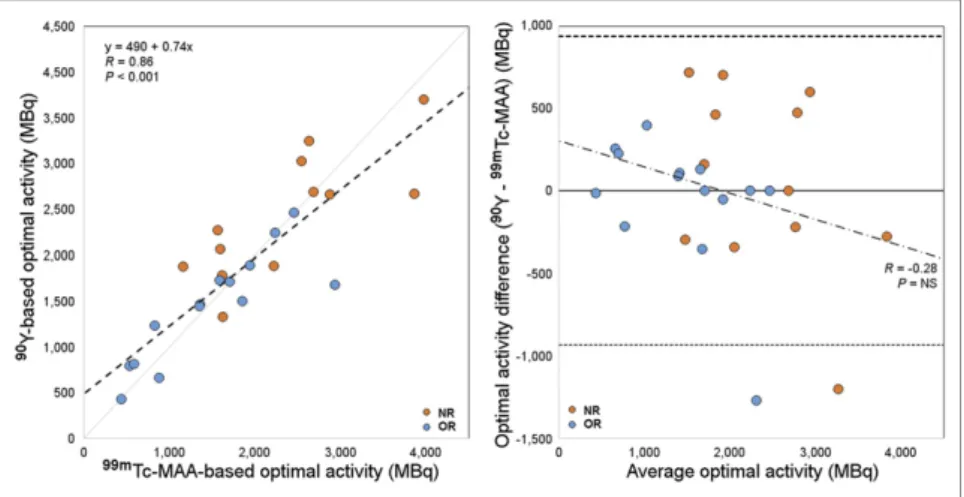
Figure 4 shows the comparison (correlation plot and Bland– Altman diagram) between99mTc-MAA SPECT– and90Y-microsphere
PET–based optimal activities. The 2 dosimetric approaches agreed well overall (R5 0.86, P , 0.001).
TABLE 2
Dose Metrics for All Treatments and for Those with a 6-Month Tumor Response Evaluation* All (n5 42) OR (n5 14) NR (n5 12)
Metric Mean SD Median Range Mean SD Mean SD OR vs. NR (P)
Injected activity (GBq) 1.18 0.43 1.10 0.29–2.60 1.07 0.51 1.18 0.29 NS
Lung shunt (%) 6.8 4.0 5.9 1.73–18.6 6.4 4.0 6.5 3.0 NS
Tumor volume (cm3) 407 462 213 8–2,043 214 175 385 374 NS
Mean dose (Gy) Tumor 99mTc-MAA 77 51 52 19–212 104 58 68 41 0.09 90Y-microspheres 74 47 60 23–197 97 53 60 24 0.04 P NS NS NS NTL 99mTc-MAA 16 9 17 0–38 17 7 16 9 NS 90Y-microspheres 22 9 21 7–44 24 8 21 10 NS P 0.003 0.02 NS DVH indices D50(Gy) 99mTc-MAA 61 49 43 9–219 92 62 50 27 0.04 90Y-microspheres 66 46 48 15–200 87 49 50 21 0.02 P NS NS NS D70(Gy) 99mTc-MAA 34 35 24 1–164 57 48 28 22 0.06 90Y-microspheres 45 36 32 8–165 61 38 34 17 0.04 P NS NS NS V120(%) 99mTc-MAA 19 23 8 0–83 33 27 13 16 0.04 90Y-microspheres 19 25 8 0–87 28 28 9 13 0.05 P NS NS NS
*According to criteria of European Association for Study of Liver.
NS5 not significant; D50and D705 minimum dose to 50% and 70%, respectively, of tumor volume; V1205 percentage of volume
DISCUSSION Therapy Response
Tumor response was assessed according to the criteria of the European Association for the Study of the Liver as recommended in the literature. Keppke et al. showed that the use of combined criteria (size and necrosis) is more accurate for response assessment after radioembolization than the use of criteria based only on size (11). A 6-mo evaluation was chosen because the full
response after radioembolization is supposed to be assessable 4–8 mo after therapy (12).
Retrospective evaluation of the 3-dimensional dose delivered to the tumor showed two main results—one regarding the BSA method and the other regarding the dose–effect relationship. The BSA Method: A Nondosimetry Approach
The first result relates to an overall analysis of delivered dose when activity was planned with the more recent version of the BSA method described by Kennedy et al. (7). In the literature, the recommended dose to be delivered to hepatocellular carcinoma tumors to achieve response with 90Y-resin microsphere
radioem-bolization is 120 Gy (10). In our population, the median value of the average dose was 60 Gy, which is half the recommended dose, and in only 6 cases (14% of the treatments) was the average tumor dose higher than the 120-Gy objective. As for the doses to the NTL, they were all lower than the 50-Gy threshold. Furthermore, in 26 of 42 treatments (62%), 120 Gy to the tumor could have been delivered while keeping the dose to the NTL and to the lungs less than 50 Gy and 30 Gy, respectively. The underdosing retrospec-tively observed in most of the cases could be related to the BSA calculation used, which is not a dosimetry-based method, as men-tioned by Kao et al. (3). This possibility is illustrated by Figure 3, which shows that the optimal injected activity would be higher than the injected activity planned by the BSA model for all treat-ments that resulted in an NR (ratio. 1). In the remaining 38% of treatments, the 120-Gy objective would not have been achievable because of unfavorable tumor targeting.
More recently, Kao et al. discussed the limitations of the BSA method by pointing out, particularly, the missing T/N ratio in the BSA formula (13). T/N ratio referring to the preferential90
Y-mi-crosphere implantation in the tumor is lesion-based and underlies radioembolization efficacy. Low dose-values are precisely due to unfavorable T/N ratios. Neglect of the T/N ratio could partly explain the high interpatient variability in average absorbed doses to tumor (for posttreatment dosimetry, 746 47 Gy; range, 232197 Gy) while the same planning objective was assumed when apply-ing the BSA method. Also, as noted by several authors, the BSA method is not correlated with liver size. This method may be suitable in a healthy population but can lead to over- or under-dosage in cancerous livers, especially in situations of extreme tumor burden (5,14,15) or atrophic liver related to chronic liver disease.
Moreover, Kao et al. interestingly noted that being based only on patient height, weight, and tumor involvement, the range of activities calculated by the BSA method would mainly be included between 1 and 3 GBq when considering extreme cases (3). In our population, to reach the 120-Gy mean absorbed dose to the tumor while keeping the dose to the NTL and the lungs below the re-spective 50- and 30-Gy tolerance thresholds, injected activity should have ranged from 0.43 to 6.5 GBq. This range of activity exceeds the activity vials available today. These theoretic values would need to be adjusted with consideration of other factors, such as patient baseline condition, remaining hepatic function, and tumor uptake (1); hence, multiplying the activity by a simple coefficient would likely not be adequate in most cases. The flaw is in the BSA formula itself, which is not adapted for this therapy because it disregards essential parameters such as T/N ratio, liver volume, and dose distribution heterogeneity. Today, only voxel-based dosimetry integrates all these variables, and its feasibility has already been proven (16,17).
FIGURE 2. 90Y-microsphere PET–based average tumor dose and DVH
metrics in NR and OR treatments. Number and percentage of respond-ing tumors are specified for stratified ranges of dose metrics, highlight-ing dose–effect relationship. D50and D705 minimum dose to 50% and
70%, respectively, of tumor volume; V1205 percentage of volume
re-ceiving at least 120 Gy.
FIGURE 3. Optimal-to-actual (BSA-based) activity ratio for each of 26 treatments with 6-mo European Association for Study of Liver response evaluation. Lower bound corresponds to 120 Gy objective to tumor, upper bound to 50 and 30 Gy limitations to NTL and lungs, respectively. Treatments in which NTL and lung dose limitations would not allow 120 Gy to reach tumor are marked with asterisk.
Dose–Effect Relationship
The second interesting result regards the relationship between dose and treatment response for hepatocellular carcinoma patients. Average dose and all dose metrics extracted from DVHs were significantly higher in OR than in NR (Table 2).
Although the mean value of D70was 45 Gy over the treatments
we analyzed, a D70higher than 80 Gy resulted in an OR for all
treatments (n 5 3). Kao et al., who were among the earliest authors to analyze DVHs for90Y-microsphere radioembolization,
suggested a D70100 Gy objective for a complete response (18).
Putting aside differences in methodology, discrepancies be-tween the two thresholds can be explained by the fact that delivered doses were higher in their population and the selected patients were treated under highly favorable conditions. In both studies, this DVH analysis was performed on a small number of patients. A larger study is required to define dose thresholds from DVH as addi-tional dosimetric indicators to the average dose commonly used. In agreement with the tumor-dose objectives given in the literature, all tumors (n5 4) receiving an average dose higher than 120 Gy were found to respond to treatment (10).
Therefore, combining average dose value and dose metrics extracted from DHVs could help to plan a suitable therapeutic activity and predict treatment response.
As reported by several authors, both the BSA and the partition models assume a homogeneous90Y-microsphere deposition (6,19).
However, as Kao et al. pointed out, many studies have shown90
Y-microsphere deposition heterogeneity at microscopic and macro-scopic levels (3,19–22). For this reason, interest in voxel-based dosimetry for predicting tumor control is growing, as D’Arienzo et al. concluded in their case report (23). In addition to greater accuracy, dose map calculation provides analysis tools (dose pro-files, isodose displays, DVHs) similar to those used in external-beam radiation therapy to help the medical team optimize treatment planning.
Limitations and Perspectives
Caution should be taken with the dose values given here, as they are only an indication of the dose–effect relationship. They can-not be taken for clinically applicable dose thresholds, because of two main limitations. First, a limited number of patients was included to
ensure homogeneity of tumor histology,90
Y-microsphere type, and planning methodology within the cohort. Second,90Y-microsphere
PET–based dosimetry may suffer from variability due to image noise and free-breathing acquisitions, as well as bias related to the partial-volume effect and registra-tion inaccuracies.
In this study, tumor dosimetry based on99mTc-MAA did not significantly
dif-fer from that based on90Y-microspheres.
Although 99mTc-MAA is not a perfect 90Y-microsphere surrogate, as already
dis-cussed in the literature (24,25), it is today the only consensual method to assess dose before treatment and it plays a key role in planning the activity to inject. That is why the agreement between99mTc-MAA SPECT
and90Y-microsphere PET dosimetry needs
to be investigated in more detail.
As is shown in Figure 3, in most cases there was a wide margin of decision between the two classic approaches discussed in the literature, that is, the minimal efficient activity (preserving the NTL as much as possible while delivering sufficient dose to the tumor) (10) and the maximal tolerable activity (26). Individual therapeutic decisions require a patient-based approach taking into account clinical status, hepatic functional reserve, and cumula-tive-dose issues if future therapies are considered.
CONCLUSION
This retrospective study yielded two main results. First, the activity to administer as calculated by the BSA method could have been increased in most cases to comply with the dose thresholds recommended in the literature. Second, in our population, tumor dosimetry (whether in terms of average dose or DVH metrics) was markedly associated with tumor response. The increasing interest in radioembolization is going to require dosimetry tools and reference levels that allow us to better personalize treatments.
DISCLOSURE
Marilyne Kafrouni is an employee of DOSIsoft SA (Cachan, France) as a PhD student. S´ebastien Vauclin is an employee of DOSIsoft SA (Cachan, France). No other potential conflict of in-terest relevant to this article was reported.
REFERENCES
1. Cremonesi M, Chiesa C, Strigari L, et al. Radioembolization of hepatic lesions from a radiobiology and dosimetric perspective. Front Oncol. 2014;4:210. 2. SIR-Spheres [package insert]. New South Wales, Australia: Sirtex Medical
Lim-ited; 2017.
3. Kao YH, Tan EH, Ng CE, Goh SW. Clinical implications of the body surface area method versus partition model dosimetry for yttrium-90 radioembolization using resin microspheres: a technical review. Ann Nucl Med. 2011;25:455–461. 4. Lam MG, Louie JD, Abdelmaksoud MH, Fisher GA, Cho-Phan CD, Sze DY. Limitations of body surface area-based activity calculation for radioembolization of hepatic metastases in colorectal cancer. J Vasc Interv Radiol. 2014;25:1085– 1093.
5. Smits MLJ, Elschot M, Sze DY, et al. Radioembolization dosimetry: the road ahead. Cardiovasc Intervent Radiol. 2015;38:261–269.
6. Claudio Traino A, Boni G, Mariani G. Radiodosimetric estimates for radioembolic therapy of liver tumors: challenges and opportunities. J Nucl Med. 2012;53:509–511.
FIGURE 4. Comparison between optimal-activity calculations based on99mTc-MAA and90
Y-microsphere dosimetry. In scatterplot on left, dashed line stands for linear regression. In Bland– Altman diagram on right, solid line indicates mean difference and dashed lines 95% limits of agreement. NS5 not significant.
7. Kennedy A, Coldwell D, Sangro B, Wasan H, Salem R. Radioembolization for the treatment of liver tumors: general principles. Am J Clin Oncol. 2012;35:91–99. 8. Bolch WE, Bouchet LG, Robertson JS, et al. MIRD pamphlet no. 17: the dosimetry
of nonuniform activity distributions—radionuclide S values at the voxel level. Medical Internal Radiation Dose Committee. J Nucl Med. 1999;40:11S–36S. 9. Forner A, Ayuso C, Varela M, et al. Evaluation of tumor response after
locore-gional therapies in hepatocellular carcinoma: are response evaluation criteria in solid tumors reliable? Cancer. 2009;115:616–623.
10. Lau WY, Kennedy AS, Kim YH, et al. Patient selection and activity planning guide for selective internal radiotherapy with yttrium-90 resin microspheres. Int J Radiat Oncol Biol Phys. 2012;82:401–407.
11. Keppke AL, Salem R, Reddy D, et al. Imaging of hepatocellular carcinoma after treatment with yttrium-90 microspheres. AJR. 2007;188:768–775.
12. Strigari L, Sciuto R, Rea S, et al. Efficacy and toxicity related to treatment of hepatocellular carcinoma with90Y-SIR spheres: radiobiologic considerations.
J Nucl Med. 2010;51:1377–1385.
13. Kao YH, Lichtenstein M. Origin, dosimetric effect and clinical limitations of the semi-empirical body surface area method for radioembolisation using yttrium-90 resin microspheres. J Med Imaging Radiat Oncol. 2016;60:382–385. 14. Grosser OS, Gerhard U, Furth C, et al. Intrahepatic activity distribution in
radio-embolisation with yttrium-90-labeled resin microspheres using the body surface area method: a less than perfect model. J Vasc Interv Radiol. 2015;26:1615–1621. 15. Samim M, van Veenendaal LM, Braat MN, et al. Recommendations for radio-embolisation after liver surgery using yttrium-90 resin microspheres based on a survey of an international expert panel. Eur Radiol. 2017;27:4923–4930. 16. Dieudonn´e A, Garin E, Laffont S, et al. Clinical feasibility of fast 3-dimensional
dosimetry of the liver for treatment planning of hepatocellular carcinoma with
90Y-microspheres. J Nucl Med. 2011;52:1930–1937.
17. Petitguillaume A, Bernardini M, Hadid L, de Labriolle-Vaylet C, Franck D, Desbr´ee A. Three-dimensional personalized Monte Carlo dosimetry in90Y resin
microspheres therapy of hepatic metastases: nontumoral liver and lungs radiation
protection considerations and treatment planning optimization. J Nucl Med. 2014;55:405–413.
18. Kao YH, Steinberg J, Tay Y, et al. Post-radioembolization yttrium-90 PET/CT: part 2—dose-response and tumor predictive dosimetry for resin microspheres. EJNMMI Res. 2013;3:57.
19. Fowler KJ, Maughan NM, Laforest R, et al. PET/MRI of hepatic90Y
micro-sphere deposition determines individual tumor response. Cardiovasc Intervent Radiol. 2016;39:855–864.
20. Fox RA, Klemp PF, Egan G, Mina LL, Burton MA, Gray BN. Dose distribution following selective internal radiation therapy. Int J Radiat Oncol Biol Phys. 1991;21:463–467.
21. Campbell AM, Bailey IH, Burton MA. Analysis of the distribution of intra-arterial microspheres in human liver following hepatic yttrium-90 microsphere therapy. Phys Med Biol. 2000;45:1023–1033.
22. Kennedy AS, Nutting C, Coldwell D, Gaiser J, Drachenberg C. Pathologic response and microdosimetry of90Y microspheres in man: review of four explanted whole
livers. Int J Radiat Oncol Biol Phys. 2004;60:1552–1563.
23. D’Arienzo M, Filippi L, Chiaramida P, et al. Absorbed dose to lesion and clinical outcome after liver radioembolization with90Y microspheres: a case report of
PET-based dosimetry. Ann Nucl Med. 2013;27:676–680.
24. Knesaurek K, Machac J, Muzinic M, DaCosta M, Zhang Z, Heiba S. Quantitative comparison of yttrium-90 (90Y)-microspheres and technetium-99m (99m
Tc)-mac-roaggregated albumin SPECT images for planning90Y therapy of liver cancer.
Technol Cancer Res Treat. 2010;9:253–262.
25. Wondergem M, Smits ML, Elschot M, et al.99mTc macroaggregated albumin
poorly predicts the intrahepatic distribution of90Y resin microspheres in hepatic
radioembolization. J Nucl Med. 2013;54:1294–1301.
26. Chiesa C, Mira M, Maccauro M, et al. Radioembolization of hepatocarcinoma with 90-Y glass microspheres: development of an individualized treatment plan-ning strategy based on dosimetry and radiobiology. Eur J Nucl Med Mol Imag-ing. 2015;42:1718–1738.