Corrosion Fatigue Crack Initiation in 2091-T351 Alclad by
Jean-Marc P. Genkin. Diplome Ing6nieur Civil Ecole des Mines de Paris (1992) M.S. Materials Science and Engineering Massachusetts Institute of Technology (1994)
Submitted to the Department of Materials Science and Engineering in Partial Fulfillment of the Requirements for the Degree of
Doctor in Philosophy. at the
Massachusetts Institute of Technology June 1996
@Massachusetts Institute of Technology All rights reserved
Signature of Author... . ... T...
p enals Science and Engineering May 3, 1996 Certified by..., ... ... ... ... Professor R.G.Ballinger - - Thesis Supervisor Professor R.M.Latanision Thesis Supervisor
...
...
...
Professor F.J.McGarry Thesis Supervisor ,4rofessor R.M.Pelloux '- Thesis Supervisor Accepted by ... ... • ... ~.. .... .. ... Professor M.F.Rubner Chair, Departmental Committee on Graduate StudentsIASSACHUS•.• ýTTS INS• . i OF TECHNOLOGY
JUN 2
41996
Science
CORROSION FATIGUE CRACK INITIATION IN 2091-T351 ALCLAD.
by
JEAN-MARC GENKIN
Submitted to the Department of Materials Science and Engineering on May 3,1996 in partial fulfillment of the
requirements for the Degree of Doctor in Philosophy in Materials Engineering.
ABSTRACT
The mechanisms of corrosion fatigue crack initiation were studied in thin gauge 2091-T351 Alclad aluminum alloy in a NaC1 environment. Fatigue specimens simulated an open rivet hole. The roles of the electrochemical potential and mechanical variables were studied. In deaerated 1M NaC1, fatigue cracks initiated by permanent slip band cracking from free surfaces below the pitting potential of 2091 and from pits above the pitting potential of 2091. In this last case, three regimes of fatigue initiation were identified.
When pitting was relatively mild, crystallographic fatigue cracks initiated from pits. When pitting was more significant, pits were separated from corrosion fatigue by a transition zone. This transition zone was the fractographic signature of competition between pitting and fatigue. In this regime of corrosion, frequency and stress range, fatigue initiated at the surface edges of pits while pitting dissolution was still active at the tip of the pits. For general pitting, fatigue cracks initiated at free surfaces by a net section stress effect and propagated parallel to pits.
A micromechanical model of multi site crack initiation is derived. It is based on competition between pitting and fatigue. Pits are modeled as semi-elliptical cracks. K variations along the crack front are taken into account to model a two-dimensional defect. For each fatigue cycle, propagation is simulated by calculating a local increment both at the surface and at the tip of the defect. Competition between pitting and fatigue is derived locally. Defects interaction and coalescence are modeled using a Fracture Mechanics approach. It is inferred that defect interaction and coalescence will reduce pit size. The model predicts the simultaneity of fatigue and pitting within the same defect and the elliptical shape of the transition zone.
The model is extended to the two cases of limited or general pitting. It gives reasonable lower and upper bounds for fatigue life and pit depth from independently derived fatigue crack growth rates and pitting rates. The role of the cladding is to keep 2091 below its pitting potential and thus to promote fatigue initiation by slip band cracking from free surfaces.
Thesis Advisors:
R.G. Ballinger, Professor of Nuclear Engineering and Materials Engineering R.M.Pelloux, Professor of Materials Science and Engineering
Table of Contents 1.0 Introduction: the aging aircraft issue
2.0 Literature review
2.1 Physical Metallurgy
2.1.1 General Physical Metallurgy of Aluminum Alloys 2.1.2 Physical Metallurgy of Aluminum-Lithium Alloys
2.1.2.1 General Metallurgy 2.1.2.2 2091-T351
2.2 Corrosion of Aluminum Alloys
2.2.1Stability domain in aqueous solution 2.2.2 Kinetics of Corrosion: Evans Diagram 2.2.3 Pitting kinetics
2.2.3.1 Pitting of Aluminum Alloys 2.2.3.2 Pitting kinetics
2.3 Corrosion Fatigue
2.3.1 Initiation of corrosion fatigue cracks
2.3.1.1 Its relation to the electrochemical stability of the metal 2.3.1.2 Fatigue crack initiation from pits
2.3.1.2.1 The effect of precorrosion
2.3.1.2.2 Coupling of precorrosion and corrosion fatigue. 2.3.2 Short cracks
2.3.3 Propagation of corrosion fatigue cracks 2.3.4 Conclusions on Corrosion Fatigue 2.4 Application to aging aircraft
2.4.1 Interacting cracks and crack coalescence 2.4.2 Clad material
2.4.2.1 Anti corrosion protection 2.4.2.2 The cladding role in Fatigue 2.5 Conclusions 3.0 Thesis goals 4.0 Experimental procedures 4.1 Material 4.2 Electrochemistry 4.2.1 Specimens 4.2.2 Corrosion cell 4.2.3 Polarization curves 4.2.4 ASTM G69 4.25 Pitting depth curves
4.2.5.1 Effect of cladding 4.3 Corrosion Fatigue p.12 p.15 p.15 p.15 p.15 p.15 p.17 p.18 p.18 p.22 p.24 p.24 p.25 p.27 p.27 p.27 p.31 p.32 p.34 p.38 p.41 p.45 p.46 p.46 p.49 p.49 p.5 0 p.51 p.52 p.53 p.53 p.54 p.54 p.55 p.56 p.56 p.57 p.57 p.57
4.3.1 Fatigue initiation p.58
4.3.2 Fatigue propagation p.59
4.3.3 Experimental Set-up p.60
4.4 Microscopy p.61
4.4.1 Optical Microscopy p.61
4.4.2 Scanning Electron Microscopy p.62
5.0 Experimental results p.63
5.1 Physical metallurgy of 2091-T351 Alclad p.63
5.2 Corrosion and electrochemical properties of alloy 2091-T351 Alclad p.63
5.2.1 Polarization curves p.63
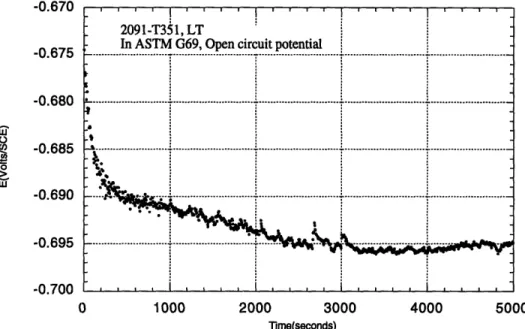
5.2.2 ASTM G69 p.64
5.2.3 Constant potential p.64
5.2.3.1. Current versus time p.64
5.2.3.2. Pitting morphology p.65
5.2.3.3. Pitting curves p.66
5.3 Corrosion fatigue p.67
5.3.1 Fatigue crack growth rates p.67
5.3.2 S-N curves p.68
5.4 Fractography p.69
5.4.1 Initiation of corrosion fatigue cracks p.70
5.4.2 Effect of stress intensity factor p.71
5.4.3 Initiation of corrosion fatigue cracks from pits p.72
5.4.4 Transition between pitting and fatigue p.72
5.4.5 Pit depth as a function of stress range and frequency. p.73
5.5 Conclusions p.76
6.0 Model and discussion p.102
6.1 Corrosion behavior of 2091-T351 Aluminum-Lithium Alloy p. 102
6.1.1 Pitting Corrosion in 2091-T351 p.102
6.1.1.1 Pitting sequence p.102
6.1.1.2 The relationship between pit shape and the
microstructure. p.102
6.1.2 The protective role of the cladding. p.106
6.1.2.1 Potential drop during polarization p.106
6.1.2.2 Polarization of the composite material p. 108
6.1.4 Conclusions for corrosion of 2091-T351 p.115
6.2 A mechanism of initiation of corrosion fatigue cracks p.116
6.2.1 Initiation from a free surface p.116
6.2.2 Initiation from pits and slip bands p.117
6.2.3 Initiation from pits with a transition zone between pit and fatigue.
6.2.3.1 The transition zone p.119
6.2.3.2 The corrosion fatigue flaw. p.125
6.2.4 Initiation due to general pitting p.126
6.2.5 Conclusions on the mode of fatigue initiation p.127
6.3 Prediction model of fatigue life p.128
6.3.2 Propagation of semi-elliptical flaws under fatigue p.132
6.3.3 Flaw interaction and coalescence p.135
6.3.4 Short crack emanating from a circular notch p.142
6.4 Model Validity p.144
6.4.1 Corrosion Fatigue Flaw p.144
6.4.2 The Shape of the transition zone p.146
6.4.3 Fatigue threshold p. 148
6.4.4 Simulations p.152
6.4.4.1 Results p.154
6.5 Model Extensions p.160
6.5.1 The case of Limited Pitting p.160
6.5.2 The case of General Pitting p.161
6.6 Mapping the Mechanisms of Fatigue Initiation in the (Aa,f) plane p.167
6.6.1 Mapping p.167
6.6.2 Applications to Aging Airplanes p.173
6.7 Conclusions of the Discussion p.173
7.0 Conclusions and future work. p.175
Appendix A: Newman-Raju's formula p.178
Appendix B: Fortran Program p.179
Appendix C: Results p.187
List of Figures
2.1: E-pH diagram with AI(OH)3 as the stable species. p.21
2.2: E-pH diagram with A120 3 as the stable species p.21
2.3: Plot of Inlil versus the overpotential. p.23
2.4: Maximum pit depth for aluminum alloys in sea water. p.25
2.5: Pit parameters p.2 6
2.6: Film rupture/dissolution model for passivity p.2 8
2.7: Slip band cracking in 7075-T6 p.30
2.8: Explanation of the relative independence fattigue life with precorrosion time. p.33 2.9: Determination of the critical stress intensity factor p.36 2.10: Fatigue crack growth rates for aluminum-lithium alloys p.39 2.11: Fatigue crack growth rates for aluminum-lithium alloys. AK effective p.40 2.12: Effect of crack length in 2090 aluminum-lithium in corrosion fatigue. p.41 2.13: Effect of frequency on corrosion fatigue crack growth rates p.42 2.14: Effect of environment on corrosion fatigue crack growth rates. p.43 2.15: Effect of potential on corrosion fatigue carck growth rates p.4 4 2.16: Effect of cracking modes in the slope of Paris law. p.45 2.17: Crack interaction and its effect on stress intensity factors p.47
2.18: Crack interaction in steels p.48
2.19: Defintion of parameters for non coplanar interacting cracks p.48
2.20: Evans diagram illustrating galvanic corrosion p.49
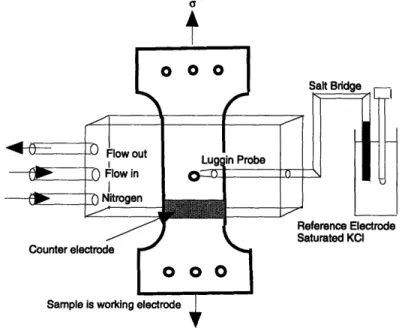
4.1: Definition of the planes with respect to the rolling direction p.54 4.2: Design of specimen for corrosion study of the L-S plane p.54 4.3: Corrosion cell in the three electrode configuration p.55 4.4: Specimen geometry for stusy of fatigue crack initiation p.58
4.5: Experimental set-up for corrosion fatigue p.60
5.1: 2091-T351: Microstructure, etched with NaOH, Fe(CN)6 p.77
5.2: Magnified view of a particle and EDX spectrum p.77
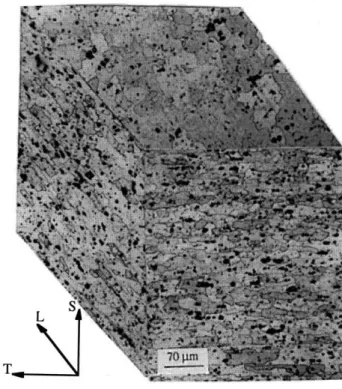
5.3: Variation of grain structure across the sheet thickness p.78 5.4: Enlarged view of the grain structure in the vicinity of the cladding p.78
5.5: Polarization curve for 2091-T351 in IM NaCl at 25 C p.79
5.6: Polarization curve for the cladding in IM NaCl at 25 C p.79
5.8: Current versus time. Polarization of 2091 Alclad at -660 mV(SCE) p.80 5.9: Cross section of 2091-T351Alclad after 5000 seconds p.81 5.10: 2091-T351 Alclad and non clad after 3600 polarization p.81 5.11: Fatigue specimen, 2091-T351 Alclad after 10,000 seconds at -660 mV(SCE) p.82 5.12: Cross-section of 2091-T351 after 1800 seconds at -660 mV(SCE) p.82 5.13: Cross-sections of 2091-T351 after immersion: short and long times p.83 5.14: Corrosion pit on a fracture surface: the role of grain boundaries p.83
5.15: 2091-T351: Evolution of pit density and depth with time p.84
5.16: Statistics distribution of pit depth p.8 5-8 6
5.17: 2091-T351: Maximum pit depth as a function of the immersion time p.87 5.18: 2091-T351 Alclad: Maximum pit depth as a function of the immersion time p.87 5.19: 2091-T351 Alclad: Fatigue crack growth rates in air and NaCl p.88
5.20: 2091-T351 Alclad: S-N curves in air and NaCl p.88
5.21: 2091-T351 Alclad: Effect of potential on fatigue initiation life p.89 5.22: 2091-T351 Alclad: Effect of frequency on fatigue initiation life in ASTM 69 p.8 9
5.23: Stage I fatigue at -660 mV(SCE) and -800 mV(SCE) p.90
5.24: Macro Sequence of fatigue initiation from a pit p.90
5.25: Details of macrocrack formation from two neighboring pits p.91
5.26: Through thickness crack formation p.91
5.27: Magnified view of 5.26. Morphology of the fracture surface p.92
5.28: Micro sequence of initiation from a corrosion pit p.93
5.29: Detail of the transition zone p.94
5.30: Initiation from a pit. Interface transition zone/corrosion fatigue p.95
5.31: Initiation from apit. Transition zone p.96
5.32 Cross-section. Cracks emanating from pits. Transition zone p.97
5.33: Crack emanating from a pit in a rivet hole p.97
5.34: Precorroded specimen. Fatigue crack initiation site p.98 5.35: Effect of test frequency on pit depth. Fractographs p.99
5.36: Effect of stress range on pit depth, f=1 Hz p.100
5.37: Effect of stress range on pit depth, f=10 Hz p.100
5.38: Effect of frequency on pit depth p.101
6.1: Illustration of a bidimensionnal grain structure p. 103
6.2: Equivalent circuit for solution resistance p.107
6.3: Effect of solution resistance on potential drop. p.110
6.5: Schematic of the polarization behavior of 2091-T351 Alclad p.112 6.6: Current versus time in a polarization at constant potential. p.114
6.7: Stage I fatigue p.116
6.8: Typical pit for a specimen tested at 140 MPa and 10 Hz p.118 6.9: Illustration of the transition between corrosion and fatigue p. 119 6.10: Interface transition zone/corrosion fatigue. Cross-section p. 12 0 6.11: Interface transition zone/corrosion fatigue. Stage I P. 121 6.12: Interface transition zone/corrosion fatigue. Tip of a pit p. 122
6.13: Corrosion fatigue flaw p. 125
6.14: Illustration of fatigue initiation in case of general pitting p.126
6.15: Fracture surface in case of general pitting p. 126
6.16: Geometry of a corrosion pit emanating from a rivet hole. p. 128
6.17: Sheet geometry p.129
6.18: Angular variation of the stress intensity factor of a semi-elliptical crack. p. 130 6.19: Variation of the stress intensity factor with depth at constant radius. p.130 6.20: Illustration of the procedure to estimate the propagation of an elliptical defect. p. 131
6.21: Model for propagation of an hybrid flaw. p.132
6.22: Definition of parameters for interaction p. 135
6.23: Interaction factor p.136
6.24: Flaw coalescence: schematic p. 137
6.25: Stress intensity factors due to coalescence. p.138
6.26: Pit interaction, 100 MPa,10 Hz p.139
6.27: Pit interaction, 120 MPa, 1Hz p.14 0
6.28: Pit interaction. tilt 50 degree. Offset height p. 140
6.29: Pit interaction model for the computer simulation p. 141
6.30: Notch effect on stress intensity factors p.143
6.31: Pitting and fatigue crack growth rates as a function of N p.144 6.32: Pitting and fatigue crack growth rates as a function of K p.144
6.33: Contour of the transition zone: p.147
6.34: Schematic of pit history p.149
6.35: Fatigue crack at the threshold p.150
6.36: Angular variation of the stress intensity factor of a semi-elliptical crack p.151 6.37: Fatigue cracking sequence for an isolated pit and a cluster of pit p.152
6.38-6.50: Simulation results (Appendix C) p. 187-193
6.51: Diagram of the analysis used to validate the simulation p.155
6.53: 2091-T351. f=lHz, Upper and lower bounds for pit depth p.157 6.54: 2091-T351. f=10OHz, Upper and lower bounds for pit depth p.157
6.55: S-N curves at f=lHz p.158
6.56: S-N curves at f= 10OHz p. 158
6.57: Typical pit for a specimen tested at 140 MPa and 10 Hz p.160
6.58: Illustration of Fatigue initiation in 1-D (General pitting) p. 162
6.59: Schematic of the onset of general corrosion p. 163 6.60: 65 MPa, 1Hz: illustration of competition between pitting and fatigue p. 164 6.61: 100MPa, 0.1Hz: illustration of competition between pitting and fatigue p.165
6.62: Mechanisms of Fatigue Initiation p. 169
List of Tables
1.1: 2091: Nominal composition in wt% p. 17
1.2: 2091-T351 Alclad: Mechanical properties p. 17
4.1: 2091: Nominal composition in wt% p.53
4.2: 2091-T351 Alclad: Mechanical properties p.53
5.1: 2091-T351 Alclad. S-N data, f=1 Hz, in NaC1, -660 mV(SCE) p.68
5.2: 2091-T351 Alclad. S-N data, f=10 Hz, air p.69
5.3: 2091-T351bare. S-N data, f=10 Hz, in NaC1, -660 mV(SCE) p.69
5.4: Mechanisms of fatigue crack initiation p.70
5.5: Pit depth. 140 MPa, 1Hz p.7 4
5.6: Pit depth. 120 MPa, 1Hz p.7 4
5.7: Pit depth. 100 MPa, 1Hz p.7 4
5.8: Pit depth. 80 MPa, 1Hz p.7 4
5.9: Pit depth. 65 MPa, 1Hz p.7 5
5.10: Pit depth. 140 MPa, 10Hz p.7 5
5.11: Pit depth. 100 MPa, 10Hz p.7 5
5.12: Pit depth. 80 MPa, 10Hz p.7 5
5.13: Pit depth. 65 MPa, 10Hz p.7 5
6.1: Equivalent stress intensity factor p. 148
6.2-6.14: Appendix D: results of simulation p. 194-198
6.15: Results of simulation p.156
Acknowledgements
I would like to aknowledge the support of my thesis advisors, Professors Ballinger and Pelloux. I am grateful for their advice and encouragement that allowed me to complete this thesis.
I would like to express my appreciation to Hiu Au, Bruce Brisson, John Chun and David Grundy who made my stay at M.I.T. almost enjoyable. Special thanks go to Hiu Au who had the patience of showing me the tricks of electrochemistry.
1.0 INTRODUCTION: THE AGING AIRCRAFT ISSUE
In 1988, an Aloha Airlines Boeing 737 suffered a major structural damage when it lost five meters of its fuselage upper half [1] during flight. The aircraft was manufactured in 1969 and at the time of the accident had accumulated 89,090 pressurization/depressurization cycles, which is equivalent to 13 flights a day for 19 years. Investigations showed that debonding at a lap joint resulted in an unfavorable loading of the riveted assembly. Multiple corrosion fatigue cracks initiated at a series of corroded rivet holes along the same row and propagated undetected. Under the pressurization hoop stress, these cracks linked-up suddenly and caused the separation of the linked-upper half of the fuselage. The overall phenomenon was described as Multi-Site-Damage (M.S.D.). This structural failure is not an isolated case in the aircraft world. In fact, military fighter aircraft are more likely to be prone to environmental degradation because of the very high strength aluminum used in their frame and the harsh service conditions they endure daily. For example, Stress Corrosion Cracking (SCC) has been observed in aircraft components subjected to high tensile stress, such as the wing box lower panel of a fighter aircraft [2]. Corrosion accelerated cracking was the source of failure of the trailing edge flap hinge lug of an F/A-18 [3]. In addition to the corrosion problems faced by advanced fighter aircraft, the military is concerned with the aging of its large airframes which are schedule to remain in service until 2020-2040 and whose average age exceeds 25 years. At that time, they will be susceptible to the same potential damage as that which led to the failure of the B-737 of Aloha Airlines.
As a consequence the US Air Force and the Federal Aviation Administration (F.A.A) have initiated numerous research programs aimed at understanding and predicting aging of
Aircraft. M.S.D. was at first the main source of concern because it went undetected in the Aloha Airline aircraft. Crack connection was not understood because of the lack of fracture mechanics data on cracks interaction. M.S.D. appeared also to be highly stochastic. However, when the phenomenon had been separated into an initiation and a propagation stage, it was soon discovered that the initiation stage was at the source of the scatter. Since the structure spends most of its time in the initiation stage, it is very important to explain and quantify it. Fatigue crack initiation is environmentaly assisted in aging airplanes. Stress Corrosion Cracking, Corrosion Fatigue and Fretting Corrosion Fatigue are likely candidates for crack initiation. Each mechanism constitutes one area of research even though obvious connections can be made between them.
In this thesis, we will focus on corrosion fatigue crack initiation and the influence of pitting on the iniation process. Pits often form at high stress concentration sites such as the edges of rivet holes. Pits tend to concentrate the stress further and serve as fatigue crack initiation sites. Once a crack initiates, it propagates by fatigue and the corrosive environment will enhance further crack growth.
A better understanding and quantification of crack initiation life should provide an improvement in life prediction methodology. Presently, we rely on the damage tolerant approach which integrates the long crack growth rates in air, from an arbitrarily defined initial crack depth. The effect of corrosive environments on airplane life is not taken in account, because real service conditions are unknown.
It has been observed in service inspections that fatigue cracks often emanate from an area of pitting corrosion. Some research work has been carried out to understand the transition
between a pit and a fatigue crack. Kondo [4] has successfully demonstrated that in steel this transition occurs at a critical equivalent stress intensity factor.
The Kondo model is based on the assumption that fatigue cracking is observed when the fatigue crack growth rate given by the da/dN-AK curve exceeds the pit growth rate predicted by the pit growth law in a given environment. The model is implemented in three steps. First, the pitting behavior of steels alloys is defined and characterized quantitatively in terms of environment and time dependence. Second, the pit growth law is translated into equivalent fracture mechanics parameters. Third, a comparison between the pit kinetics and the da/dN-AK fatigue curve for short cracks is carried out to determine a critical stress intensity factor. This parameter will allow us to compute the critical pit dimensions leading to fatigue crack initiation. Using again the pit growth law, one can evaluate the time before fatigue crack initiation by comparing the critical dimensions to the actual pit dimensions. Assuming that a formalism developped by Kondo is applicable to aluminum alloys, it should be possible to develop a new approach that would permit the prediction of the residual life of a pitted component before fatigue crack initiation. A reliable estimate of the remaining life would allow for better schedules of maintenance.
In this thesis, we develop and verify the methodology for the prediction of crack initiation time in the presence of a pitting environment. The analytical model developed is verified by detailed experimental data relating the electrochemistry of clad aluminum-lithium alloy 2091, the external environment and the mechanics of fatigue crack initiation. The results of this thesis can be applied to aluminum alloys as a class.
2.0. INITIATION AND PROPAGATION OF CORROSION FATIGUE CRACKS IN ALUMINUM ALLOYS: THE STATE-OF-THE-ART.
2.1 Physical metallurgy.
2.1.1 General physical metallurgy of aluminum alloys [5]
Aluminum alloys are widely used in the aerospace industry due to their high strength to weight ratio. Most of the aluminum alloys used in the fuselage and skin of airplanes are precipitation strengthened. The most common heat treatment starts with a solution treatment, followed by a quench and an aging cycle. At the solution treatment temperature, most of the alloying elements are in solid solution. A rapid cooling from solution treatment temperature results in a homogeneous supersaturated matrix and a surplus of vacancies. When cooling is not fast enough, heterogeneous nucleation of precipitates can occur on grain boundaries and deplete the adjacent zone. This is often the case with aluminum-copper alloys.
The source of strengthening in age hardenable aluminum alloys is the Guinier Preston Zones and derivative equilibrium phases. Some impurities, mostly Fe and Si, form large insoluble constituent particles (inclusions) which precipitate from the melt. They do not take part in the strengthening mechanisms.
2.1.2 Physical metallurgy of aluminum-lithium alloys. 2.1.2.1 General metallurgy
New application and energy costs have pushed for further improvement of the aluminum alloys. Aluminum-Lithium alloys are good candidates for decreasing the density and
increasing the elastic modulus. Each 1% of lithium addition (Up to the 4.2 wt % solubility limit) decreases the alloy density by about 3% and increases the modulus by about 5% [6].
Lithium was first introduced as an alloying element (Al-Zn-Cu-Li alloy) in Germany in the 1920's. In the 1950's, alloy 2020 (Al-Cu-Li-Cd) and in the 1960's alloy 1420 (Al-Mg-Li) were also developed but have not gained widespread acceptance because of their low fracture toughness coupled with a continuous improvement in the properties of existing aluminum alloys.
Binary Al-Li alloys have poor toughness and ductility. This can be traced, in part, to the inhomogeneous nature of their plastic deformation by slip, resulting from coherent-particle hardening due to spherical 8' (Al3Li) precipitates. The presence of equilibrium 8 (Al-Li)
precipitates at grain boundaries can also cause Precipitate Free Zone (P.F.Z) formation, which induce further strain localization and promote intergranular failure. For commercial alloys, slip has been homogeneized by the introduction of dispersoid phases (Mn, Zr) and semi-coherent/incoherent precipitates such as T1(Al2CuLi)
0'(Al
2Cu) or S(Al2LiMg) through copper and magnesium additions. Zirconium forms cubic Al3Zr coherent dispersoids which stabilize the grain structure and suppress recrystallization. The resulting material is highly textured and properties vary with orientation. Copper and magnesium minimize the formation of PFZs near the grain boundaries.In addition to precipitation hardening, controlled grain microstructure generated from hot and cold deformation provides additional strength. Deformation prior to aging is beneficial for strength and toughness partly because precipitates nucleate on dislocations such as TI(Al2CuLi) in 2090 and S'(Al2LiMg) in 8090 alloy.
2.1.2.2 2091-T351
Alloy 2091 is an aluminum-lithium-copper-magnesium alloy whose nominal composition is shown in Table 1. It has 8 % lower density (2.56 g/cm3) and 7% higher modulus (77.5 Gpa) than 2024-T3. Its nominal mechanical properties are displayed in Table 2. Its strength level is slightly inferior to 2024 (Yield: 310 Mpa, UTS: 450 Mpa). It shows, however, good ductility and toughness [6].
.Table 1.1: 2091 composition in wt%
Elements Li Cu Mg Fe Si Mn Cr Zn Zr
2091 (wt%) 1.7-2.3 1.8-2.5 1.1-1.9 0.3 0.2 0.1 0.1 0.25 0.04-0.16
Table 1.2: 2091 Alclad Mechanical Properties
Longitudinal Properties Long-Transverse properties 45*properties
Yield UTS Elongation Yield UTS Elongation Yield UTS Elongation
(MPa) (MPa) (%) (MPa) (MPa) (%) (MPa) (MPa) (%)
265 364 10 265 384 10 236 350 15
Alloy 2091 has been studied by Gomiero et al [7]. During ingot solidification and subsequent processing, some impurities precipitate as insoluble phases referred to "constituent particles". In alloy 2091, the main constituent particles are of composition
A10.49 Li0.28 Cu0.14 Mg0.09. Their size is usually between 5 and 30
gim.
Their volume fraction is of the order of 1 %.The most common heat treatment for alloy 2091 is the T351 temper: The alloy is solutionized, deformed to give 2-3% plastic deformation and then naturally aged to a substantially stable condition. According to Gomiero[7], the concentrations of Li and Mg atoms in solid solution for a room temperature aged alloy are respectively 1.6 at% and 0.87
at%. Guinier-Preston zones occupy a volume fraction of 0.73 %. SAXS (Small Angle X-ray Scattering) measurements show results similar to those of an Al-Cu-Mg alloy and GP zones are expected to be nearly pure (100) planes of Cu atoms surrounded by Mg-rich planes. The radius of GP disk shaped precipitates is about 9 nm. Precipitation of 8' phase (A1lLi) occurs upon aging. After aging for two years, their radius is 1.5 nm. Their volume
fraction is 26 %.
In addition, there is no sub-grain boundary and in each grain a single system of helicoidal dislocations is present.
2.2. Corrosion of Aluminum Alloys
2.2.1 Stability Domain in aqueous solution Electrochemical reactions can be in general represented as:
R <* O + ne- (2.1)
Where O is the reduced species and R the oxidized species. Oxidation takes place at the anode (deficit in electrons) and reduction at the cathode (excess of electrons). In the case of aluminum alloys, the following reactions are typical of those which can take place in aqueous environments:
Al3+(aq) + 3e- -- Al(s)
A13+(aq) + 2 H20 -- AlO2-(aq) + 4H+
Al203 + 6H+ + 6e- -+ Al(s) + 3H20
Al(OH)
3 + 3e- - Al(s) + 30H-(aq)(2.2)
Water chemistry :
2H+(aq) + 2e -- H2(g) or 2H20 + 2e- -- H2(g) + 20H-(aq)
The Gibbs free energy change associated with equation (2.1) can be written as:
AG = AGo + RTln (2.3)
Where
AG : Gibbs free energy change.
AG" : Standard Gibbs free energy change.
R : universal gas constant (8.3144 Joules/deg mole). T : temperature in degree Kelvin.
ao* : activity of species O in the bulk.
aR* : activity of species R in the bulk.
Since electrochemical reactions are based on an electron transfer, a electromotive force (emf) is created between the anode and the cathode. This voltage is related to the change in Gibbs free energy by:
AG=-nFE (2.4)
where
n : number of electrons involved in the electrochemical reaction F : Faraday's number (9.64846 10 4 C/equivalent)
E : emf of the cell
Equation (2.2) can be rewritten in terms of potentials:
E =E o RT I IaR (2.5)
nF [ao*
Equation (2.5) must be written for every couple (O,R) of species that are present in the system. Pourbaix [8] devised a method for showing the stability domain of the different species in a E-pH diagram. The Gibbs free energy change is calculated for every reaction and converted into a potential using equation (2.3). The border between stability domains is defined by an arbitrary value of the activity, usually 10-6 mol/1. Examples are given in Figures 2.1 and 2.2.
ts)
-Al - H20 - System at 25.00 C
0 2 4 6 8 10 12 14
pH
Figure 2.1: E-pH diagram with AI(OH)3 as the stable species.
Its) Al - H20 - System at 25.00 C
AlA+3 A1203*H20
Al
02-10 12 14
pH
Figure 2.2: E-pH diagram with A1203as the stable species.[9]
I I I I I I i -I I 1 Eh (Volt 2.0 1.5 1.0 0.5 0.0 -0.5 -1.0 -1.5 -2.0 -2.5 )3 A102-Al I I I I I I I I I I Al+3 A -3.0 Eh (Vo 2.0 1.5 1.0 0.5 0.0 -0.5 -1.0 -1.5 -2.0 -2.5 -3.0 IIII _ ~--~-I I I 1(OH)
These diagrams give the stability domain in function of E and pH. When an oxide film is present such as in A1203, the metal is potentially passive. If the film is stable as in the case of aluminum, the corrosion rate is low.
It must be pointed out that the Pourbaix or stability diagram is based on thermodynamic data and not kinetic parameters. AI(OH)3 forms first when the metal is placed in the corresponding stability domain as illustrated in Figure 2.1. However, it is unstable and transforms into A1203 +H20 which is illustrated in Figure 2.2.
The two parallel lines define regions of water stability. The lower one is the hydrogen line: water is stable above the line and hydrogen gas is stable below. The upper line is the oxygen line: water is stable below and oxygen gas is stable above.
2.2.2 Kinetics of Corrosion[10]: Evans Diagrams
When the system is at equilibrium, the potential is given by equation (5) and is termed the equilibrium, or rest, or corrosion potential Eeq. When the electrodes (cathode and anode) are polarized beyond this potential, a net current will flow according to equation (6):
. Co (0,
{
t)
CR(0,t)
C(Ot) exp(-cwnfr) -
C(
exp((1 - )nf)} (2.6)Co CR
Where
i : net current density io : exchange current density rl : overpotential, E-Eq
Co(O,t) : surface concentration of species O CR(0,t) : surface concentration of species R a : transfer coefficient
When the reaction is slow or mass transfer is fast, the pre-exponential terms are equal to 1 since concentrations are uniform. Equation (2.6) reduces to a more simple form shown in Equation (2.7), also called the Butler-Volmer equation.
i = io
{exp(-canfi)
- exp((l - a)nfti)} (2.7)When the overpotential is large enough, the system is dominated by a single reaction rate (either forward or reverse) and the other term can be neglected. The overpotential follows a logarithmic law when the back reaction contributes less than 1% to the current (valid for ir
> 0.118/n Volts where n is the number of electrons involved in the electrochemichal
reaction)
Positive overpotential : i = io{exp(-anfir} or In(i) = In(io) - anf77
(2.8)
Negative overpotential : i = io {exp((l - a)nf7} or In(i) = In(io) + (1- a)nfir A plot of In I i I versus overpotential is shown in Figure 2.3. The linear parts are outlined. In the vicinity of the equilibrium potential, Equation (2.5) has to be used because no reaction can be neglected. From this plot, the current exchange density i. can be determined. 0 I.• -o.u -10 -12 -14 -16 -18 -93 -0.2 -0.15 -0.1 -0.05 0 0.05 0.1 0.15 0.2 Overvoltage (Volts)
2.2.3 Pitting corrosion
2.2.3.1 Pitting of aluminum alloys
When an aluminum alloy is anodically polarized [11] in an environment where an oxide is thermodynamically stable , the current first increases steadily according to the equations presented above and suddenly decreases due to the formation of a protective oxide. Kinetics are independent of potential up to a critical potential where current density increases again. At this point, local breakdown of the oxide film occurs. In halide environments (cr, Bf), the local breakdown results in pitting.
Acidification and enrichment of chloride ions are observed within active pits, due to the hydrolisis of aluminum ions on the one hand and chloride migration to maintain charge neutrality on the other hand [12].
Al3+ + 6H20 -4 Al(OH)3 * (H20)3 + 3H+
As a consequence, the pH drops and is controlled by the solubility of the hydroxide. At room temperature, the pH can be as low as 3.5 [13]. According to the Pourbaix diagram of Figure 2.2, the oxide film is no longer stable and pit growth becomes autocatalytic and the process is mass transport limited as explained by Gavele [14].
Pit initiation is not very well understood. Wood [15] observed that surface oxide films contain enough flaws to provide sites for pit initiation. Szlarska-Smilaowska [16] suggested that the oxide film is not efficient against the penetration of chloride ions in the oxide film. She proposed that the rate limiting step for pit formation is not the diffusion of the environment through the oxide film but the development of a stable corrosive environment which sustains continuous dissolution.
In aluminum alloys, constituent particles are preferred sites for pit initiation because they impede oxide growth around them [17]. Moreover, they can form a local galvanic cell with the surrounding matrix. For instance, Bucheit [18] reports that in 2090 aluminum alloy
(Al-Li-Cu), pits initiates around Al-Cu-Fe constituent particles and form an occluded cell that concentrates the environment further. At this point, dissolution of T1 (A12CuLi)
precipitates begins. These precipitates are located on sub-grain boundaries.
2.2.3.2 Pitting kinetics
As will be discussed below, pitting is very detrimental to the fatigue performance of aluminum alloys. Even without an additionnal environmental effect, pits act as stress concentrators and facilitate fatigue crack initiation. Figure 2.4 shows pitting data for several aluminum alloys. The evolution of pit depth with time is the focus of these studies. Scatter is significant. Power laws describe only roughly the pitting behavior. Alclad aluminum is better than unclad aluminum alloys. Most of these results are based on experimental data [19,20] and rarely is an attempt made to correlate pit depth with electrochemical variables [21]. L 1.5 0.5
0
0 2 4 6 8 10 12 Time (years)Early research dealing with pitting kinetics was concerned with the prediction of maximum pit depth [23]. However, pit depth measurement is time consuming. As a result of this, a
statistical approach based on extreme value statistics is often adopted [24].
The early work on extreme value statistics used the Gumbel distribution for the asymptotic frequency distribution, (:
(x) = ae-Y-e-Ywhere y = a(x- u) (2.9)
u and a are the parameters of the distribution, x is the observed maximum pit depth. In practice the data is plotted on a special probability paper and the parameters derived directly. The pit depth is plotted on abscissa and the observed frequency as ordinate. The observed frequency is calculated by ordering the measurement by increasing order, from 1 to n. The nth measurement is the highest maximum observed pit depth. The cumulative relative frequency of the mth measurement is defined as m/n+1. The corresponding values should fall on a straight line.
Pit depth is a function of time and often follows a power law whose exponent is often reported as close to 1/3 [25].
Pits are characterized by their opening radius and their depth. The aspect ratio, a, defined as the radius divided by the depth (a/c), is often used to describe pit shape as illustrated in Figure 2.5.
c: Pit depth a: Pit radius Figure 2.5: Pit parameters
When measuring pit growth, pit aspect ratios are often assumed to remain constant throughout pit life. This assumption allows pit growth laws to be defined by a single parameter, either pit depth or pit radius. Historically, pit depth has been of greatest interest since it is related to the perforation time of tanks and pipes.
To illustrate this review, the maximum pit depth is assumed to follow a cubic root dependence on time, as it is the case for aluminum alloys in NaCl environments [25]. Since a constant aspect ratio is assumed, the power law is also valid for the radius:
c=Cptl/3 (2.10)
where c is the pit depth. The 1/3 exponent may be explained by a constant bulk dissolution rate B: assuming an hemispherical pit of radius c, the 1/3 exponent is equivalent to a linear dependence on time for the dissolved volume:
d2 =3 B = - B.t (2.11)
dt 3 3
2.3.Corrosion Fatigue
2.3.1 Initiation of corrosion fatigue cracks
2.3.1.1. Its relation to the electrochemical stability of the metal
Initiation of corrosion fatigue cracks is controlled by the environment and the loading spectrum. The environment determines the stability of a metal and any surface film.
The loading spectrum determines the amount of mechanical damage per cycle and controls the amount of environmental damage allowed during one fatigue cycle due to the exposure of fresh metal.
The coupling between the chemical and mechanical variables results in a wide range of crack initiation modes. It is common to distinguish between the three regimes of corrosion, namely passivity, local passivity breakdown and active dissolution [26,27,28].
When corrosion is active at the surface [27], emerging slip bands due to fatigue are preferentially attacked by disssolution. This preferential attack leads to the generation of new and larger slip bands. Permanent Slip Bands (P.S.B's) dissolve preferentially because the atoms that surrounds the mobile dislocations are more active. In turn, dissolution relieves back stresses generated by interactions between the dislocations and the surface and thus it enhances slip [29,30]. In some cases, this intense dissolution of slip bands can blunt the cracks which would otherwise propagate [31].
Figure 2.6 illustrates the cracking mechasnism in the passive potential range. The metal is then covered with a protective oxide film. Application of a cyclic stress periodically breaks the film exposing fresh metal that dissolves readily during the time required to repassivate the metal.
I:Film fracture III:
Passivatio
/ III: Passivatior
II: Dissolution . IV: Film fracture
Rolling, Patel and Pyle [32] have observed current transients associated with each cycle of plastic strain under electrochemical potential control.
For passive conditions, the oxyde film impedes dislocation movement at the surface and increases hardening. When P.S.B's. penetrate the film, corrosion rates increase.
If the process is not uniform over the metal surface because of microstructural or machining defects, a notch will be created from which a fatigue crack may initiate. In fact, as suggested earlier, there is no clear difference between initiation and propagation. This is especially true in this case.
If the average metal dissolution corresponds to less than one atomic layer per cycle, crack initiation does not take place [26] . This leads to the notion of a limit current that was observed by Uhlig [33] in steel.
When the metal is in a range of potentials where local breakdown of passivity is likely, a variety of behaviors is observed. The phenomena of intergranular corrosion, pitting corrosion and stress corrosion cracking are potential processes which are dominant depending on the loading spectrum and frequency.
For example, it was reported in an Al-Zn-Mg alloy that at low strain rates crack initiation is intergranular whereas at high strain rates it becomes transgranular[34]. Intergranular initiation was explained by stress corrosion cracking and transgranular initiation by slip band cracking. As an illustration, Figure 2.7 shows stage I fatigue created by slip band cracking in an aluminum-zinc-magnesium alloy.
Figure 2.7: 7075-T6 aluminum alloy. Stage I fracture in slip bands [35].
After one or two grains, the stage I crack turns perpendicular to the tensile stress and propagates in stage II. For an Al-Li-Cu alloy tested in 3.5 % NaC1, Magnin [36] observed that the mode of initiation was a function of the strain rate. A decrease in the strain rate leads in a change in the crack initiation morphology, from slip band cracking to stress corrosion cracking. At intermediate strain rates, fatigue cracks initiate from pits. If pitting is mild, a decrease in fatigue life is observed. If it is severe an increase in fatigue life is observed. In the first case, corrosion pits act as stress concentrators whereas in the second case they blunt the starter crack.
This review outlines the coupling between the mechanical variables and the environment. Thus, the environment must be well known and characterized to yield meaningful data. For instance, Au [37] showed that by choosing properly the electrochemical potential in 7078 and 7075 aluminum alloys, pitting could be favored over intergranular corrosion. He applied this approach to stress corrosion cracking studies and preliminary results showed
that crack initiation was one order of magnitude faster in the intergranular corrosion domain than in the pitting domain. In the first case, stress corrosion cracking could start almost immediately whereas in the second case, a pit has to develop first. For corrosion fatigue, the same approach should be followed to differentiate between the effect of pitting and the effect of other forms of corrosion. This is especially important in aging aircraft where pitting is observed more often than intergranular corrosion. The literature review will now focus on initiation from pits.
2.3.1.2: Fatigue crack initiation from pits.
Pits have been reported by Piasick as the cause of fatigue initiation in 2024 (f=5 Hz) [38], Ishihara [39] in 2017-T4 (f=60 Hz), Duquette in a Al-Li-Zr Alloy (f=30 Hz) [40] and Schmidt in 2024 Alclad [41]. Pit depth was small, of the order of 10 to 30 microns in depth. Test frequency was high. Pitting sharply reduces the fatigue life of a component subjected to cyclic stress. Pits are thought to act as stress concentrators. However, it is difficult to quantify this effect.
The first difficulty is to recognize that there is no analytical solution that is available for stress concentration due to complex notches. Pits are similar in geometry to a surface ellipsoidal void. In the literature, Eshelby [42] was the pioneer of the calculation of stresses due to elliptical voids. Recently, Z.Mei and J.W.Morris [43] presented a numerical solution for a surface hemispherical void. The state of stress was obviously three dimensional. However, the focus in this review will be on the tensile stress concentration. Stress concentrations are of the order of 1.8 both at the intersection between the hemisphere and the free surface and at the bottom of the hemisphere. This has to be compared to the stress concentration factor of 3 due to a cylindrical hole in an infinite plate [44]. When the aspect ratio of the ellipsoid varies from 1 (hemisphere) to infinity (cylinder), the stress
concentration varies from 1.8 to 3. However, no information is available in between. The other difficulty is to make a transition between an uncracked medium (stress concentration factors) to a cracked specimen (stress intensity factor). These two entities are completely different. Use of cyclic plastic strain amplitude as a criterion of crack initiation has been proposed for notches [45]. However, the stress field was supposed known. Pits are thus modeled as semi-elliptical cracks to circumvent the stress-field problem. This assumption will be reviewed during the thesis discussion.
2.3.1.2.1. The effect of precorrosion
There have been several studies which have examined the effect of increased precorrosion time on fatigue lives in air [46,47]. It was observed that fatigue lives are sharply reduced after the first few hours or days of precorrosion, depending upon the severity of the environment. Additional precorrosion times do not further affect fatigue lives. No explaination has been provided. Either corrosion longer corrosion times do not create a lot more damage or the stress concentration effect reaches a saturation level. The first argument is supported by the shape of the curve of the pit depth versus time. It is often approximated by a power law which exhibits decreasing pit depth increment with increasing time. The second argument is supported by the dependence on depth of the stress intensity factor for a crack of the same depth and radius as that of a pit. Figure 2.8 illustrates the variation of the stress intensity factors at the surface and at the tip of a semi-elliptical crack. It is seen that the stress intensity factor increases sharply at the beginning and then levels out for a given crack radius. For an aspect ratio (radius over depth) greater than 2, the validity of the formula has not been formally checked but it is expected that it converges to zero as the stress intensity factor of an edge crack would do. If pits behave as
cracks, a sharp reduction in fatigue lives is expected for the first few hours of precorrosion. Additionnal precorrosion times should not have a great effect.
In addition, extensive pitting may have the effect of blunting a starter crack, thus reducing the stress concentration effect. These arguments combined explain the relative independence of fatigue lives on precorrosion times. The study of precorrosion is important because it is thought that corrosion and fatigue take place in sequence in aging airplanes.
The other approach is to test directly material in a corrosive environment and attempt to correlate corrosion pit geometry with the reduction in fatigue lives.
Semi-elliptical crack: Newman-Raju's formulae Stress intensity factors as a function of crack depth Crack radius = 50 gm, S=100 MPa
A (• L4. S3.5
6
3.0 2.5 0u
2.0
1.5 1.0 ~0.50 00€)0 100
1
10-42
10-43
10-44
10-45
10-4 Crack depth (m)Figure 2.8: Explanation of the relative independence of fatigue lives upon long precorrosion times[48]. Use of Newman-Raju's formulae[49].
2.3.1.2.2. Coupling of pitting corrosion and corrosion fatigue.
In the past, pitting of aluminum alloys was not the focus of significant research in corrosion fatigue. It was considered more as an unpredicted phenomenon accounting for an early failure than the core subject of a scientific study. Publications dealing with fatigue crack initiation in aluminum alloys are, in general, semi-quantitative at best.
Attempts have been made to correlate pit geometry with the applied stress. In 1979, Hoeppner [50] presented a paper where he outlined a method similar to the one pursued in this thesis. From an experimental pitting curve and a da/dN curve, a fatigue life prediction was made for 7075-T6 alloy in 3.5 % NaCl. Transition between pitting and fatigue was assumed to take place when the stress intensity factor due to the pit was equivalent to the fatigue threshold for long cracks. The equivalent stress intensity factor was calculated with the assumption the pit was acting as an edge crack. The threshold was derived by extrapolation and taken as 6Mpa1m. The long crack threshold of most aluminum alloys is around 2 to 4 Mpalm at low R-ratio[51,52]. Results were in agreement with the experimental values. However, Pelloux [53] showed that in the same alloy, in the same environment (3.5% NaC1) and at the same frequency (30Hz), pitting was not the source of crack initiation and instead a multiplication of slip bands was observed.
Since the initiation process in the presence of pitting is not well understood, extreme care must be taken in the interpretation of crack initiation results of corrosion fatigue test investigations in this case. First, the source of crack initiation must be clearly understood ; second, if transition between pitting and fatigue takes place at a given threshold, experimental values must be estimated by using a more realistic geometry than an edge crack.
In 1989, Kondo [4] presented a new approach to the process. According to his theory, corrosion fatigue and corrosion are two competing processes. When fatigue crack growth
is faster, fatigue is observed, when pit growth is faster, pits are observed. In this argument, corrosion processes eliminate any fatigue features that are created. Kondo formalized his theory by evaluating, on the same scale of stress intensity factors, the defect growth either due to corrosion fatigue or pitting corrosion.
Pits are often characterized by their opening radius and their depth. The aspect ratio, a, defined as the depth over the radius, is often used to describe pit shape. As presented earlier, pit growth will be assumed to obey a power law dependence on time:
c=Cpt1/3 (2.12)
Where c is the pit depth. To implement the model, one needs to calculate the equivalent pit growth increment per cycle of fatigue loading. In equation (2.12), t is replaced by N/f, where N is the number of cycles and f the test frequency. N/f represents the elapsed time since fatigue loading has started. After differentiation of equation (2.12) with respect to N, one gets equation (2.13):
d - 1 3 f-1c-2 (2.13)
dc/dN represents the pit advance that takes place during one fatigue cycle. To relate the geometry of pits to corrosion fatigue crack geometry, pits are modeled as sharp semi-elliptical cracks of' constant aspect ratio. This enables an easy computation of an equivalent stress intensity factor.
AKeq = 1.12 Au ca (2.14)
where Aa is the stress range, c is the pit depth, a is the aspect ratio, equal to the ratio of
radius over depth (a/c).
Q is the shape factor equal (in this case) to 1+1.464 a1 .65 [54]. The factor 1.12 is a
and (2.14) one gets (2.15), which gives the pit increment per cycle as a function of the equivalent stress intensity factor:
2.15
de 1 C 3f-1 [a n12 1.12 Ao 4
dN 3
Q
j / A2q1 IEquation (2.15) shows that the pit increment per cycle is a decreasing function of test frequency and stress intensity factor and an increasing function of the stress range. Transition between pitting and fatigue is based on the assumption that corrosion fatigue crack initiation is a competitive process between pitting and cracking. The analysis proceeds by comparing defect increment per cycle for each mode:
dc (pitting) <> dc (fatigue cracking)
dN dN
The higher defect increment per cycle determines the damage mode. .Figure 2.9 illustrates the mechanism. . It is a plot of da/dN versus AK.
A$ AKMPa4m
Figure 2.9: Determination of the critical stress intensity factor for transition from fatigue to pitting.
The key point is to consider short fatigue crack growth rates in the given environment. Quantitatively, the onset of cracking is defined by a critical stress intensity factor given by the intersect between the curve representing Equation (2.15) and the short crack da/dN curve. The slope of the pitting curve is equal to -4 as seen from Equation (2.15).
When Ao increases, the curve is shifted to the right. This does not mean that pit growth rates depend on the stress level. This is an artifact of the formalism. To understand it, let us consider two different fatigue tests. The first one is conducted at 0a and the second one at a2 , with a, greater than a2. If both fatigue tests are tested at the same time, pits should
propagate at the same rates all the time until fatigue crack initiation takes place. In Figure 2.9, the rates daldN(1) and da/dN(2) are the same and should be on a horizontal line. Even though the pits have the same size at the same time until fatigue initiation, their equivalent stress intensity factors are not the same, since the applied stress is different for the two fatigue tests. At any given time, the pitting curve of sample 1 will lie on the right hand side of the pitting curve for sample 2. This is the explanation of the shifting of the pitting curve with increasing applied stress.
According to equation 2.15, the effect of frequency should be the same as the effect of stress range in Figure 2.9. This time, the pitting curve is actually shifted upwards because of the 1/f dependence of the pitting rate per cycle. Both increasing the stress range and decreasing the frequency will have the effect of increasing the apparent transition threshold defined as AKP in Figure 2.9. This does not translate immediately in pit depth because the analysis ignores the time dependence. At higher stress range, the threshold is higher, but it includes the contribution of both the higher stress and a potentially deeper pit. If the AK curve is steep enough, AKP will not vary a lot and the effect will be to reduce the pit size. For a lower frequency, there is no doubt about a deeper pit since the threshold is higher for
the same stress level. However, according to Kondo's formalism, if the AK curve is steep, one should not see a great effect of loading frequency on pit depth since the threshold would not vary. Fatigue initiation will only take place in a fewer number of cycles.
2.3.2 Short Cracks
Fracture Mechanics is based on the principle of Similitude. The principle of similitude states that crack growth rates depend only on the stress intensity factor (A•4(nTa), not on crack size, stress level or load history. Short cracks are cracks which do not obey the principle of similitude contained in AK [55]. The short crack phenomenon presents difficulties for any study of fatigue crack initiation from corrosion pits.
As illustrated in Figure 2.10 [56], short cracks propagate at stress intensity factors less than the fatigue threshold for long cracks. In addition, it is often observed that short cracks propagate faster than long cracks for the same stress intensity factor. Short crack behavior in air can arise because of the following reasons:
1] The crack length is of the same order as a characteristic microstructural feature. The isotropy hypothesis stands no longer. For instance, fatigue cracks may interact with the grain boundaries.
2] A crack is physically short when the plastic wake due to earlier fatigue damage is not enough developed and that plastic closure does not operate. This phenomenon is observed for crack length under one millimeter.
3] A crack is mechanically short when the crack length is of the same order of the plastic zone size. The small-scale-yielding hypothesis is no longer valid.
IV- d, 10-6 o
10-7
r* 10-8 d 10-90
0 10-10 U 10-1110-12
0.5 1 5 10 JuStress intensity factor (MPalm)
Figure 2.10: Fatigue crack growth for different aluminum-lithium alloys, in air, R=0.1. Note the similitude of the slope between long and short crack growth rates.
In aluminum alloys, short crack behavior is not always predictable. For example, it is reported that in air, short cracks propagate faster than long cracks for negative R-ratio, and slower for a R-ratio of 0.5 [57]. In 8090 and 8091 aluminum-lithium alloys [58], short cracks propagate faster than long cracks by one or two order of magnitude at low R-ratio in air. However this effect is reduced at high R-ratio, showing that this crack growth enhancement is closure related.
Figure 2.10 illustrates the short crack effect for aluminum-lithium alloys. These data were derived by Ritchie [56] . Short cracks propagate for values of stress intensity factors below the fatigue threshold for long cracks, which is 2.8 Mpalm in 2091-T351 in the L-T orientation. In Figure 2.11, long crack growth rates are plotted versus the effective
stress-intensity factor (no closure effect). They become similar to short crack growth rates of Figure 2.10, showing that the short crack issue in aluminum-lithium alloys is due primarily to closure. In any case, short crack growth rates in air can be approximated by extending long crack growth data into the sub-threshold regime.
0for " II J i iJ 10" I• 10"' "ZMfor Figure 2.11: 10'7 10'" 1'0" 10~ _; S r . o aouo-rx ' 8 + 8091-TSX S0 x 2091-TOX 0 U o 8090-T351 10" 10" a V 8091-T351
S2091-TS51
130"
0.5
STRESS INTENSITY RANGE5
AKe,,, HN n10
-3/2
30
Aluminum-Lithium: long crack growth rates plotted versus the effective stress intensity factor (From Ritchie [56])
In addition to short crack behavior in air, the chemically short crack effect appears when fatigue test takes place in a corrosive environment. This effect is very pronounced in high strength steel as Gangloff[59] demonstrated for 4130 steel. He observed that short cracks can propagate two order of magnitude faster than long ones. It is thought that the environment is more active at the tip of short cracks because mass transfer of harmful species is easier.
i
I
Cyke aount (x 10•
Figure 2.12: Crack growth rate at constant AK of 2.9 Mpalm. The effect of crack length is negligible.
In aluminum alloys, there is little evidence of the chemically short crack effect. Piasick[60] has shown that in 2024 in 3% NaCi, short cracks propagate below the fatigue threshold, but similitude is still obeyed. Only when the cracking mechanism changes, does the similitude break down. Figure 2.12 illustrates the short crack behavior in aluminum lithium alloy 2090 [61]. As the crack length increases at constant stress intensity factor, the crack growth rates remain almost unchanged. It is concluded that there is no chemically short crack effect in aluminum 2090 immersed in NaC1.
2.3.3. Propagation of corrosion fatigue cracks
Propagation of corrosion fatigue cracks has been studied extensively for numerous metal/environment systems. Key parameters have been identified and a wide range of behaviors have been listed. Figure 2.13 illustrates the potential effect of loading frequency on fatigue crack growth rates in a corrosive environment [53].
Type 1 crack growth is the case of metals whose corrosion fatigue crack growth rates are independnet of test frequency in a wide range. It is rarely observed. Type 2 crack growth is very common. Crack growth rates increase when the frequency is decreased. The
phenomenon is explained in terms of a longer environmental exposure of the crack tip. The lower the frequency, the longer the period at which the crack is opened. This behavior is seen in steel, aluminum and titanium. Type 3 crack growth is caracteristic of materials which have a clear threshold for stress corrosion cracking. Beyond a threshold, crack growth rates increase suddenly. The lower the frequency the higher, the faster the crack. This is clearly explained by the time dependence of stress corrosion cracking. The da/dN-AK diagram is represents purely mechanical parameters and the time is not taken into account. -10 -10 -10 Type '-'0-3 -10-3 ~ -10-4 fl 0 -5 Air fl>f2>f3 0j-6 AK SCC (2) AKSCC (3)
AK th Log AK AK th Log AK AKth Log AK
1: Independent of frequency Type 2: da/dN increases with loading Type 3: The frequency effect can
frequency reverse when stress corrosion
cracking is active.
Figure 2.13: Effect of frequency on fatigue crack growth rates.
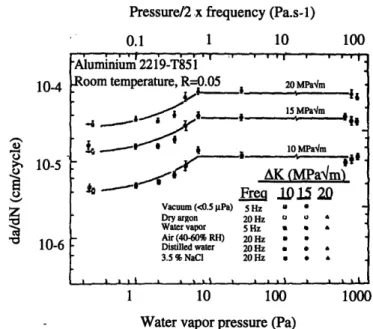
Figure 2.14 illustrates the behavior of aluminum 2219 in a water vapor containing environment. Fatigue crack growth rates are function of the ratio of water vapor pressure to the loading frequency. This ratio was a parameter introduced by Wei [62] as a measure of the environmental exposure. Two plateaus are observed, one at low values of this parameter and one at high value. This behavior was explained by a transport limited hydrogen embrittlement process. At high value of the parameter, transport is no longer the limiting step. At low values of the parameter, the effect of the environment can be neglected. In between, the environmental exposure is steadily increased and so are the growth rates.
-: I-4
It was also shown that any other gaseous hydrogen containing environment is expected to create the same effect.
Pressure/2 .x frequency (Pa.s-1)
0.1 1 10 100
10-4
> 10-5
10-6
1 10 100 1000
Water vapor pressure (Pa)
Figure 2.14: Effect of the environmental exposure on fatigue crack growth rates.
In aqueous environment and especially salt water, the electrochemical potential is a key parameter as it was shown by Piasick [52]. Figure 2.15 illustrates the effect of polarization at a cathodic potential in 2090 Aluminum-Lithium alloy. When the potential is kept anodic, crack growth takes place. However, when a cathodic potential is applied, crack arrest occurs. When cathodic polarization is removed, 76 hours at 20 Hz are necessary to restart crack propagation. This is explained by the formation of a protective oxide film.
"Aluminium 2219-T851
Room temperature, R=0.05 20 MPa'm
i. .' 15 MPaqm i0MParIm AK (MPam'm) 4 Frea .1015 2D Vacuum (<0.5 jPa) 5 Hz a -Dry argon 20 Hz 0 0 a Water vapor 5 Hz a * Air (40-60% RH) 20 Hz * 9 Distilled water 20 Hz a * &
3.5 % NaCl 20 Hz *
2.75 2.00 U 0.50 100,000 200,000 300,000 400,000 Number of cycles
Figure 2.15 Aluminum 2090 L-T, The application of a cathodic potential stops crack growth. Even after application of an anodic potential, 76 hours of fatigue at 20 Hz are
necessary to reinitiate crack growth.
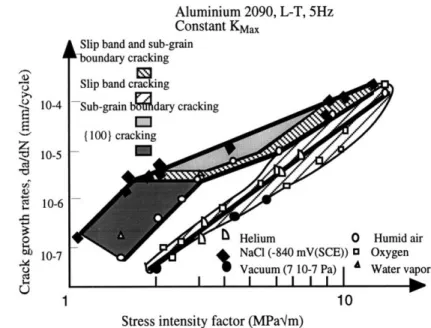
Fatigue crack growth rates in air often follow a power law relationship with the stress-intensity factor [63], the so-called Paris-law. Figure 2.16 shows that in aqueous environments, this is still locally true. Piasick and Gangloff [64] showed that crack growth rates could be approximated by multi-slope Paris laws. Each segment in the da/dN-AK diagram was due to one cracking mechanism. For example, at low AK, corrosion fatigue is due to a type of crystallographic cracking. At higher values of AK , fatigue proceeds by sub-grain boundary cracking and finally by slip band cracking and sub-grain boundary cracking.
A 10-5 g S10-6 10-7 I-Aluminium 2090, L-T, 5Hz Constant KMax
Slip band and sub-grain oundary cracking 1551 aid air gen ar vapor 1 10
Stress intensity factor (MPa'm)
Figure 2.16: Effect of cracking mode on the local Paris law slope. 2090 L-T in 3 % NaC1.
2.3.4 Conclusions on corrosion fatigue
Corrosion fatigue crack propagation has been extensively studied. The phenomenology is well documented and the critical parameters have been identified. Still, no fatigue life prediction can be made from first principles.
Little attention has been given to fatigue initiation from pits. Some researchers have concentrated on the effect of precorrosion and noticed some interesting effects of sharp material degradation in the first times of exposure followed by a plateau. Others have studied the simultaneous effect of chemistry and stress concentration within a pit in subjected to corrosion fatigue. Kondo has suggested a new approach based on a competition model between pitting and fatigue. The model has not been yet applied to aluminum alloys.
![Figure 2.4: Maximum pit depth for aluminum alloys in sea water [22]](https://thumb-eu.123doks.com/thumbv2/123doknet/14500094.527673/25.918.182.646.626.997/figure-maximum-pit-depth-aluminum-alloys-sea-water.webp)
![Figure 2.8: Explanation of the relative independence of fatigue lives upon long precorrosion times[48]](https://thumb-eu.123doks.com/thumbv2/123doknet/14500094.527673/33.918.163.670.512.928/figure-explanation-relative-independence-fatigue-lives-precorrosion-times.webp)