HAL Id: hal-02628254
https://hal.inrae.fr/hal-02628254
Submitted on 26 May 2020
HAL is a multi-disciplinary open access
archive for the deposit and dissemination of
sci-entific research documents, whether they are
pub-lished or not. The documents may come from
teaching and research institutions in France or
abroad, or from public or private research centers.
L’archive ouverte pluridisciplinaire HAL, est
destinée au dépôt et à la diffusion de documents
scientifiques de niveau recherche, publiés ou non,
émanant des établissements d’enseignement et de
recherche français ou étrangers, des laboratoires
publics ou privés.
Distributed under a Creative Commons Attribution| 4.0 International License
Rheological Characterization and Application to the
Apricot
Xavier F. Cadet, Ophélie Lo-Thong, Sylvie Bureau, Reda Dehak, Miloud
Bessafi
To cite this version:
Xavier F. Cadet, Ophélie Lo-Thong, Sylvie Bureau, Reda Dehak, Miloud Bessafi. Use of Machine
Learning and Infrared Spectra for Rheological Characterization and Application to the Apricot.
Sci-entific Reports, Nature Publishing Group, 2019, 9 (1), 12 p. �10.1038/s41598-019-55543-7�.
�hal-02628254�
Use of Machine Learning and
infrared Spectra for Rheological
characterization and Application to
the Apricot
Xavier f. cadet
1,2*, Ophélie Lo-thong
3,4, Sylvie Bureau
5, Reda Dehak
2& Miloud Bessafi
6fast advancement of machine learning methods and constant growth of the areas of application open up new horizons for large data management and processing. Among the various types of data available for analysis, the Fourier Transform InfraRed (FTIR) spectroscopy spectra are very challenging datasets to consider. In this study, machine learning is used to analyze and predict a rheological parameter: firmness. Various statistics have been gathered including both chemistry (such as ethylene, titrable acidity or sugars) and spectra values to visualize and analyze a dataset of 731 biological samples. Two-dimensional (2D) and three-dimensional (3D) principal component analyses (PCA) are used to evaluate their ability to discriminate for one parameter: firmness. Partial least squared regression (PLSR) modeling has been carried out to predict the rheological parameter using either sixteen
physicochemical parameters or only the infrared spectra. We show that (i) the spectra alone allows good discrimination of the samples based on rheology, (ii) 3D-PCA allows comprehensive and informative visualization of the data, and (iii) that the rheological parameters are predicted accurately using a regression method such as PLSR; instead of using chemical parameters which are laborious to obtain, Mid-FTIR spectra gathering all physicochemical information could be used for efficient prediction of firmness. As a conclusion, rheological and chemical parameters allow good discrimination of the samples according to their firmness. However, using only the IR spectra leads to better results. A good predictive model was built for the prediction of the firmness of the fruit, and we reached a coefficient of determination R2 value of 0.90. This method outperforms a model based on physicochemical descriptors
only. Such an approach could be very helpful to technologists and farmers.
Fast advancement of machine learning methods and constant growth of the areas of application open up new horizons for large data management and processing1. Machine learning provides better results in many fields,
where the problem become hard for classical approaches, such as medicine, with the speeding up of drug develop-ment and the design of chronic disease predictive models2,3; green chemistry and renewable energy by providing
optimized materials for CO2 capture4,5 or in the field of agri-food to contribute to smart farming and assess food
quality6–10.
Among the various types of data available for analysis, the Fourier Transform InfraRed spectroscopy (FTIR) spectra are very interesting to consider. In fact, FTIR is a rapid technique to analyze and provide high quality spectra, that presents a wide range of applications11. Some of these applications include the tracking of an
enzy-matic reaction, as well as an enzyenzy-matic assay12, but also molecule quantification13,14, the identification of
differ-ent wheat grain varieties15 and the molecular characterization of archeological wood16. Recently, the method of
Attenuated Total Reflectance (ATR) combined with FTIR was applied to apricots from eight different cultivars, to simultaneously determine sugar and organic acid contents and appraise the quality of these fruits17. Using partial
1PEACCEL, Protein Engineering Accelerator, 6 square Albin Cachot, box 42, 75013, Paris, France. 2LSE laboratory,
EPITA, Paris, 94276, France. 3University of Paris, UMR_S1134, BIGR, Inserm, F-75015, Paris, France. 4DSIMB, UMR_
S1134, BIGR, Inserm, Laboratory of Excellence GR-Ex, Faculty of Sciences and Technology, University of La Reunion, F-97715, Saint-Denis, France. 5UMR408 SQPOV, Sécurité et Qualité des Produits d’Origine Végétale, INRA, Avignon
University, F-84000, Avignon, France. 6LE2P, Laboratory of Energy, Electronics and Processes EA 4079, Faculty of
Sciences and Technology, University of La Reunion, 97444, St Denis Cedex, France. *email: xavier.cadet.fjf@gmail.com
open
least square (PLS) models, this study allowed the prediction of some quality traits including, inter alia, contents of sucrose, glucose, malic acid, ethylene production rate, firmness and other rheological parameters.
In order to extend the analysis, in this study particular attention will be paid to the employment of machine learning approaches to analyze and predict the physicochemical parameters of these fruits, and particularly rheological properties which are tedious to measure. Numerous studies in the literature have demonstrated the usefulness of spectroscopy techniques (Mid-infrared: MIR, Near Infrared: NIR) to predict and/or classify the rhe-ological parameters of cheese (texture, flavor and structure)18, wheat19,20 or sludge (viscosity, elastic and viscous
moduli)21, and a nondestructive approach has been tested using NIR spectroscopy for apples22.
In this work, the objectives are to:
• visualize dataset samples (731 samples) according to the physicochemical data and the spectra; PCA will be used for visualization;
• examine the results through 2D and 3D visualization and evaluate if they could be discriminated; • predict the rheological parameter “Firmness”;
• see to what extent chemical parameters could be replaced by Mid-FTIR spectra to predict the firmness. Collectively, the different analyses carried out show that (i) the spectra alone allow good discrimination of the samples based on their rheology, (ii) 3D-PCA allows comprehensive and informative visualization of the data, and (iii) the rheological parameters are predicted accurately using a regression method such as PLSR. We show that instead of using chemical parameters which are laborious to obtain, Mid-FTIR spectra gathering all physic-ochemical information could be used for efficient prediction.
Materials and Methods
Dataset.
The dataset on which this work relies has been produced by Bureau et al.17. All data includingspec-tra, chemical and rheological properties were acquired in 2005 on a large collection of apricot fruits representative of variability in terms of color, taste, texture and ability to be stored (In total, 731 fruits were individually charac-terized from eight varieties at different maturity stages). Some properties were determined on intact fruits, the day of harvest, such as firmness, color and ethylene production. After these measurements, fruits were cut in pieces and frozen at −20 °C. A few days later, the spectral and biochemical measurements were performed on homoge-neous fruit samples after thawing and grinding. All data were acquired on each apricot at the same time to have the best relationship between spectra and the 23 measured properties. The whole spectral collection included 731 ATR-FTIR spectra, each corresponding to a fruit. The dataset has been randomly split into two sets, the Training set representing 80% (584 spectra) and the Test set representing 20% (147 spectra). A stratified separation was made according to the targeted parameter, as predictions were only made for firmness.
For each spectrum, a total of 23 chemical and rheological properties have been characterized.
Eight apricot cultivars or hybrids, named ‘Moniqui’, ‘Goldrich’, ‘Bergeron’, ‘Iranien’, ‘Badami’, ‘Ravicille’, ‘Ravilong’ and ‘A4034’ were chosen for their contrasted fruit quality traits such as colour, taste, physiological behaviour. Fruits came from two INRA experimental orchards (Amarine (Gard) and Gotheron (Drôme), South of France) for ‘Moniqui’, ‘Goldrich’, ‘Iranien’, ‘Badami’, ‘Bergeron’ and ‘A4034’, and from a traditional private orchard (Donzère, Drôme, South of France) for ‘Ravicille’ and ‘Ravilong’.
preprocessing of the data.
On the chemistry and rheology data no outliers were detected. Spectra process-ing: the ATR-FTIR reflectance data were transformed with Standard Normal Variate (SNV) to correct multiplica-tive interferences, variations in baseline shift and curvilinearity23.performances metrics.
We need to establish various metrics to evaluate the proposed solution. Here, the goal is to predict a physical property, namely firmness, given IR spectra. Since we have labels, and these labels are real continuous values, we opted for a Regression task. The metrics that are more suitable in this case are the coefficient of determination (R2) and the Root Mean Squared Error (RMSE).Statistical measures of correlation.
The correlation coefficient R (Pearson) is used to assess the correla-tion between the rheological and chemical parameters, and to identify the wavenumbers best correlated with the targeted property.Also, the correlation between the measured and predicted values of the firmness is appraised, quantitatively and qualitatively, through the determination of R2 and RMSE in cross-validation (respectively cvR2 and cvRMSE).
These statistical metrics are calculated for all of the training sets we used and help to construct and select the best models. While, R2 measures concordance between the measured and the predicted fitness values and therefore
reveals the predictive strength of the model, RMSE measures the error of the model to predict the fitness. R2 and
RMSE are calculated as follows in Eqs. (1) and (2) respectively:
= − ∑ − ∑ − = = ˆ ˆ R y y y y y y ( , ) 1 ( ) ( ) (1) i n i i i n i 2 1 2 1 2
∑
= − = RMSE y y n ( ) (2) i n i i 1 2where, yi is the measured activity of the ith sequence, ŷi is the predicted firmness of the ith sequence, ȳ is the average of the measured activities and n the number of sequences in the test set.
Also, cvRMSE makes it possible to identify the best predictive models among all the models designed and represents the extent to which the predictions vary when different training sets are used.
Modeling and prediction schema.
Physicochemical traits can be considered as fitness traits including firmness, skin colour, ethylene production, soluble solids content and titratable acidity…We use the FTIR spectra and the fitness (23 traits are used in this work) as inputs for the learning process of our model. Then, the aim of this learning is to set up a statistical model that links the fitness to the FITR spectra. In fact, the model uses the initial dataset (training set: spectra and fitness traits) to model the fitness of FTIR spec-tra. Using the training set, a PLS regression is performed.
To perform the PLS regression, linear combinations of the original variables (i.e. input datasets) are calculated to constitute the latent components, which explain the maximum variance observed in the spectra. Also, the
Figure 1. Chemical and rheological properties distributions. 23 properties are displayed. From the top down
and from left to right the parameters are the following: weight (kg), diameter (m), deformation (m), force (N), firmness (N/m), work (J), diameter loss (%), pressure (kPa), L*blush, a*blush, b*blush, L*un-blush, a*un-blush, b*un-blush, ethylene (nmole/h.kg), ethylene (Log(nmole/h.kg)), SSC (Brix), titrable acidity (meq/100gFW), glucose (g/100gFW), fructose (g/100gFW), sucrose (g/100gFW), citric acid (meq/100gFW) and malic acid (meq/100gFW). SSC: soluble solids content, FW: fresh weight.
number of latent components to be considered for the PLS regression is based on the number of components that yield the least cvRMSE and thus present the best predictive power.
Then, the statistical model, obtained by the PLS regression method on the training dataset, is used to predict the firmness of the test dataset. Two methods of cross-validation are performed on the dataset: Leave-One-Out Cross-Validation (LOOCV) and 80–20 partitioning (80% training set and 20% validation set). And the efficiency of the predictions (test set) is evaluated using the previously discussed statistical parameters R2 and RMSE.
For proper model validation we withheld a test set. This test set has never been used during the model train-ing. In other words, the test set was put an inner sanctum and nobody knew what was the spectra inside and/or the values of the parameter associated with the spectra and/or with the chemical properties. After model training, the final model was used to predict the latent variables of this test set. This approach is the best machine learning practice to evaluate the capacity of generalization of the trained model.
Figure 2. Chemical and rheological Correlations (Absolute values). The 23 properties shown in Fig. 1 are numbered 1 to 23. Fitness Firmness (N/m) Firmness (N/m) 1.00 Force (N) 0.99 Pressure (kPa) 0.99 Work (J) 0.96
Citric acid (meq/100gFW) 0.60
Titratable acidity (meq/100gFW) 0.50
L* blush 0.16
L* un-blush 0.13
b* blush 0.06
Weight (kg) −0.03
Malic acid (meq/100gFW) −0.10
b* un-blush −0.11 Deformation (m) −0.16 Diameter (m) −0.16 Fructose (g/100gFW) −0.19 Ethylene (nmole/h.kg) −0.21 Glucose (g/100gFW) −0.26 a* blush −0.43 a* un-blush −0.46 Ethylene (Log(nmole/h.kg)) −0.46 SSC (Brix) −0.54 Sucrose (g/100gFW) −0.69 Diameter loss (%) −0.77
Performances metrics, Statistical measures of correlation and Modeling and prediction schema have been fully described in our preceding paper24.
All the scripts have been written in Python.
Results and Discussion
Our working hypothesis was the following: the firmness is the sum of different parameters depending on the level of chemical compounds in the fruit: fibers, sugars, acids, water… The quantification of these parameters would be very helpful, but their chemical or physical determination could be laborious, costly and sometimes difficult to perform. Such measurements usually require an experienced chemist, a lot of time and chemical consumables. On the other hand, Infra-Red techniques such as ATR will provide a spectrum which takes into account all the physicochemical information. This is very simple to handle: a scan can be performed in a few seconds.
Our hypothesis is that a spectrum is sufficient for the determination of a rheological parameter such as firmness.
Data exploration.
Distribution analysis. Chemical and rheological properties distributions of the 584 ATR-FTIR spectra are presented in Fig. 1.Different types of probability distribution appear. As an example: normal distribution (weight), beta distri-bution (b* un-blush) or gamma distridistri-bution (sucrose). It should be pointed out that the property “Firmness” follows a log-normal which takes on values whose logarithm is normally distributed. The exponentiation of a normally-distributed value is log-normally distributed. Since PLS performs well on normal distribution, preproc-essing using logarithm function can be applied on the firmness data and regression methods such a PLSR will be explored for the modeling.
The distribution gives an idea of distribution parameters but does not provide any information about the cor-relation between parameters. Thus, various statistics have been gathered over both chemistry and spectra values and are exhibited in the following sections.
Correlations between the properties. Correlations have been observed (Fig. 2), first over the entire train set. The diagonal related variances do not give any relevant information.
The strong correlations around the 5th component can easily be explained, as some are combinations of the
others. Indeed, the firmness parameter can be expressed as the Force (N) over the Deformation (m). The param-eters of firmness are obtained using a 3% deformation test of equatorial height of the fruit with a multi-purpose texture analyzer (Pénélaup, Serisud, Montpellier, France). Otherwise, interesting correlations are shown. The quantitative values of the correlation coefficient R are presented in Table 1 for firmness. Positive and negative correlations are observed. Some can be easily understood: for example, firmness has a negative correlation with the sucrose content. We can assume that the more mature the fruit, the less firm it will be. Other correlations have to be explored.
Principal Component Analysis (PCA) is useful to observe how the physical quantities are organized in a new space and to observe potential similarities between them. The correlation plot is presented in Fig. 3. It shows that the principal component 1 (PC1) is positively correlated with firmness and negatively to sucrose or ethylene, which are markers for ripeness. Firmness is close to force. The second principal component (PC2) is mainly neg-atively correlated to deformation and positively correlated to fructose, and neutral regarding firmness.
Figure 3. Correlation plots with first principal component (PC1. 46.24%) and second principal component
Figure 4. Firmness top 5 absolute correlation scatter matrix.
Figure 4 presents Firmness: top five correlations (positive or negative) in relation to other fitness.
For a set of data variables of dimensions x1… xk, the scatter matrix exhibits all the pairwise scatter plots of
the variables on a single view with multiple scatterplots in a matrix format. For k variables, the scatterplot matrix contains k rows and k columns. A plot located at the intersection of ith row and jth column is a plot of variables x
i
versus xj. Paired combinations of qualitative and quantitative variables can be examined globally. In our case, the
diagonal has been replaced by the histogram associated with the value instead of displaying a non-informative diagonal. Figure 4 shows linear (pressure, work…), non-linear (exponential pattern with sucrose or diameter
wavenumber
(cm−1) Sign of correlation Molecules wavenumber (cm−1) Molecules Sign of correlation
1550 + acids 1010 sucrose − 1548 + acids 1008 sucrose − 1546 + acids 1006 sucrose − 1544 + acids 1004 sucrose − 1542 + acids 1002 sucrose − 1541 + acids 1001 sucrose − 1539 + acids 999 sucrose − 1020 − glucose 997 sucrose − 1018 − glucose 995 sucrose − 1016 − glucose 993 sucrose − 1014 − sucrose 991 sucrose − 1012 − sucrose 989 sucrose −
Table 2. Wavenumbers correlated to firmness, with a coefficient of correlation superior to the absolute value
0.5. (+) for positive correlation and (−) for negative correlation.
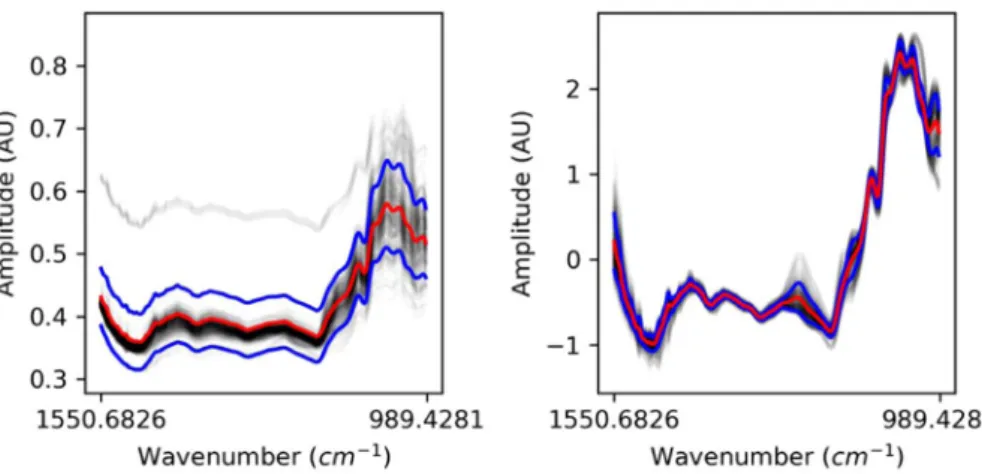
Figure 6. (left) Original train Spectra (right) SNV Spectra.
loss), positive or negative correlations. The shape of the plots gives an idea of the kind of preprocessing or regres-sion model to perform for the next steps. As an example, Figure 4 shows (i) a linear relation between pressure and firmness that could be easily modeled using a linear regression model or (ii) a non-linear relation between sucrose and firmness suggesting, for example, that a preprocessing step applied to sucrose data, such as Logarithm func-tion, in order to linearize the sucrose data before applying a regression model, should improve the results. Such information is interesting in the sense that if we have the measurements for the pressure, then it will be possible to predict firmness, but more interestingly, that the results obtained with spectra and firmness (see sectionModels and Predictions), would probably be similar for the couple spectra and pressure.
Figure 5 is composed of three figures; the red points are wavenumbers associated with positive correlations above a given threshold, and blue dots are associated with negative correlations below the opposite threshold. The number in parentheses is the number of wavenumbers associated with such correlations. From left to right (threshold: 0.7, 0.6 and 0.5). The black line corresponds to the mean of the different spectra.
Table 2 pinpoints wavenumbers that are the most closely correlated to firmness.
Wavenumbers positively correlated to firmness (red points in Fig. 5) which range between 1550 and 1539 cm−1
correspond mainly to organic acids17. Among the ones negatively correlated to firmness (blue points in Fig. 5),
those which range between 1020 to 1016 cm−1 correspond mainly to glucose absorption and between 989 to
1014 cm−1 to sucrose25. These observations are consistent with the results shown in Table 1.
Further analysis of the spectra is described in the Visualization section.
Figure 8. 3D-PCA Chemistry and Rheology (left) and Spectra (right) with respect to Firmness.
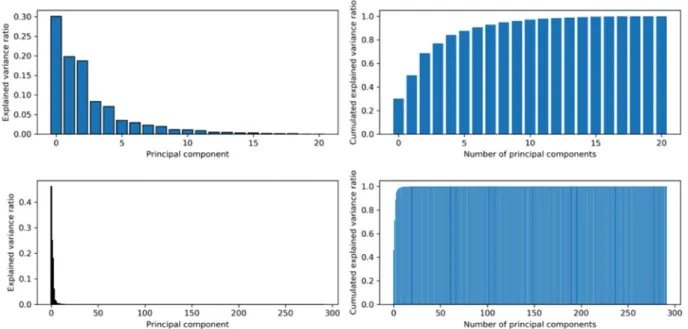
Figure 9. Explained variance per principal component and cumulated explained variance: (upper) using the
Data preprocessing.
As observed in the correlation analysis (Fig. 1), and given further insight on the differ-ent properties gathered, the parameter “Ethylene” was replaced by Log (Ethylene). However, these chemicals are only used for visualization purposes, as the whole point is to be able to obtain proper prediction of such variables given IR spectra collected using any device.In Fig. 6, black transparent lines represent the different spectra, red lines represent the means of the spectra, and the blue lines represent the standard deviation of the spectra. The left-hand side plot represents the spectra from the dataset before any further modification, the right-hand plot represents the spectra after individual SNV. SNV spectra (right) are used for the next steps.
Visualization.
PCA was performed with either the Fitness traits or the spectra. Factorial maps with two or three principal components are exhibited so as to explore how the data are distributed.2D-PCA. A PCA was run on the dataset so as to have a global visualization of the spectra. Figure 7 (left) shows the PCA using the chemical and rheological parameters. The gradient of colour indicates the firmness. We can see a discrimination of the samples according to firmness. The principal component 1 gathers 30.12% of the informa-tion, the second 19.82%. Figure 7 (right) presents an image with more distinct representation but with the spectra. PC1 has a percentage of inertia of 46.16%, PC2 25.08%. In this case, fewer axes gather more of the information embedded in the samples. When the data points are plotted according to firmness, a gradient is revealed. This suggests that spectra could be a good descriptor for predicting firmness.
These 2D plots could hide overlaps and could be misleading. Hence, we decided to plot with three axes. 3D-PCA. 3D visualization in Fig. 8 (left) based on chemistry and rheology uncovers overlaps and makes the distribution of the spectra more comprehensible. It has been shown17 that such distribution is mainly guided by
the origin of the fruit. Similar results are obtained in Fig. 8 (right) where spectra are used, confirming that a good distribution of the Firmness is obtained. Discrimination among firmness values is more distinct. Once again, the gradient spectra observed suggest that spectra could be a good descriptor to predict firmness.
Figure 9 shows a comparison of the percentage of inertia (left) associated with each component from a PCA and the cumulated components (right side) when (i) all the physicochemical parameters are used except firmness and ethylene (as Log (ethylene) is kept), and (ii) when the spectra are used. The spectra appear to be very inform-ative, as a few components provide almost the full information. On the contrary, each physicochemical parameter has to be taken into account to explain all the information contained in the samples.
Figure 10. (a,b) RMSE (upper plot) and R2 (lower plot) given N-Components during PLSR. (a) using spectra:
two upper plots and, (b) two lower plots, using physicochemical parameters (firmness and rheological parametersare excluded).
In order to explore how efficient a prediction of the firmness based on spectra would be, we decided to carry out regression models.
As described earlier, the dataset has been randomly divided into a train set and a test set with 80%/20% split.
Models and predictions.
As suggested in the section “Distribution analysis”, Log(Firmness) has been used for the modeling.Type of learning. As stated before, when defining the metrics, given the fact that we have labels which are con-tinuous, the task is a supervised learning task, and more specifically a Regression task. Performances have to be established based on the metrics discussed in the Metric section, R2 and RMSE.
Cross-validation. In order to calibrate the models, Cross-Validation has been performed with a Leave-One-Out approach. The fine-tuning step has been carried out via comparison of the metrics through Leave-One-Out, to determine the best parameters for the model.
Model selection. A Partial Least Squared Regression (PLSR) is used.
Fine-tuning. Leave-One-Out Cross validation comparison was used to determine the best number of compo-nents, the number of components that minimizes the RMSE. A threshold of 40 components at most was set.
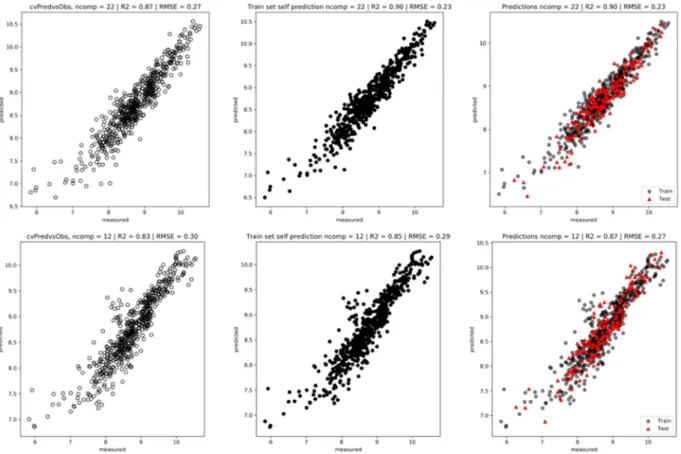
Figure 10 shows that the best number of components to choose for the PLSR model is 22 (among 291) with spectra (upper) and 12 (out of 16) with the physicochemical parameters: this number of components leads to the lowest cvRMSE.
Figure 11 (left) shows the plots obtained after a LOOCV procedure: cvR2: 0.87 and cvRMSE: 0.27 with spectra
(upper) and 0.83/0.30 with physicochemical parameters (lower). The model using spectra gives better predic-tions. Figure 11 (center) shows a prediction of the Train set using the best model obtained with the LOOCV procedure. As expected, the predictions are good. Figure 11 (right) shows the prediction of the Test set (20%) using the Train set (80%): R2: 0.90 and RMSE: 0.23 versus 0.87/0.27 confirm that a model built with the spectra
outperforms the one built with physicochemical parameters for the prediction of firmness. This is not surprising since a FTIR spectrum contains at least the information of the chemical compounds used as descriptors.
conclusion
In this study, we show that:
Figure 11. (a,b) Predictions. LOOCV procedure applied on the train set (left). Prediction of the train set using
the model with 22 components (center). Prediction of the test set (right) in red. (a) With spectra (upper plots) and (b) physicochemical parameters (lower plots) (firmness and rheological parameters are excluded).
1. Rheological and chemical parameters allow good discrimination of the samples of apricots according to their firmness.
2. However, using only the IR spectra leads to better results. Good discrimination is obtained in both cases between the samples according to firmness.
3. A predictive model based on IR spectra demonstrates its ability to efficiently predict firmness. Wavenum-bers positively or negatively correlated to the Firmness were pointed out.
As a conclusion: a good predictive model was built for the prediction of fruit firmness, as we obtained an R2
value of 0.90. This model outperforms a model based on physicochemical descriptors only. This approach could be very helpful to technologists or farmers. It could be extended to other fruits and vegetables. It could open excit-ing perspectives for fast quantitative rheological characterization of other kinds of material in various industries: ceramic, plastic, composites, polymers of small chemical or biological compounds…
Data availability
The datasets used in this study are fully described in the manuscript. Received: 31 July 2019; Accepted: 29 November 2019;
Published: xx xx xxxx
References
1. Redy Edla, D. & Venkatanareshbaku, P. L. Advances in machine learning and data science. (ed. Springer Berlin Heidelberg) (New York, 2018).
2. Murphy, R. F. An active role for machine learning in drug development. Nat. Chem. Biol. 7, 327–330 (2011).
3. Choi, B. G. et al. Machine Learning for the Prediction of New-Onset Diabetes Mellitus during 5-Year Follow-up in Non-Diabetic Patients with Cardiovascular Risks. Yonsei Med. J. 60, 191 (2019).
4. de la Guardia, M. & Garrigues, S. Analytical Research Based on the Use of Low Cost Instrumentation. Pharm. Sci. 25, 82–84 (2019). 5. Gu, G. H., Noh, J., Kim, I. & Jung, Y. Machine learning for renewable energy materials. J. Mater. Chem. A 10.1039.C9TA02356A,
https://doi.org/10.1039/C9TA02356A (2019).
6. Du, C.-J. & Sun, D.-W. Learning techniques used in computer vision for food quality evaluation: a review. J. Food Eng. 72, 39–55 (2006).
7. Kamilaris, A., Kartakoullis, A. & Prenafeta-Boldú, F. X. A review on the practice of big data analysis in agriculture. Comput. Electron.
Agric. 143, 23–37 (2017).
8. Jha, S. N. Rapid detection of food adulterants and contaminants: theory and practice. (Elsevier/Academic Press, 2016). 9. Jha, S. N. et al. Authentication of Mango Varieties Using Near-Infrared Spectroscopy. Agric. Res. 2, 229–235 (2013).
10. Jha, S. N. Detection and Quantification of Urea in Milk Using Attenuated Total Reflectance-Fourier Transform Infrared Spectroscopy. Food Bioprocess Technol. v. 8, 926–933 (2015).
11. Cadet, F. & de la Guardia, M. Quantitative Analysis, Infrared. in Encyclopedia of Analytical Chemistry (ed. Meyers, R. A.) a5610,
https://doi.org/10.1002/9780470027318.a5610 (John Wiley & Sons, Ltd, 2000).
12. Kumar, S. & Barth, A. Following Enzyme Activity with Infrared Spectroscopy. Sensors 10, 2626–2637 (2010).
13. Cadet, F. & Offmann, B. Direct Spectroscopic Sucrose Determination of Raw Sugar Cane Juices. J. Agric. Food Chem. 45, 166–171 (1997).
14. Rondeau, P., Sers, S., Jhurry, D. & Cadet, F. Indirect metal ion (K+, Na+, Mg2+and Ca2+) quantification from infrared spectroscopy.
Appl. Spectrosc. Rev. 37, 119–136 (2002).
15. Amir, R. M. et al. Application of Fourier transform infrared (FTIR) spectroscopy for the identification of wheat varieties. J. Food Sci.
Technol. 50, 1018–1023 (2013).
16. Traoré, M., Kaal, J. & Martínez Cortizas, A. Application of FTIR spectroscopy to the characterization of archeological wood.
Spectrochim. Acta. A. Mol. Biomol. Spectrosc. 153, 63–70 (2016).
17. Bureau, S. et al. Application of ATR-FTIR for a rapid and simultaneous determination of sugars and organic acids in apricot fruit.
Food Chem. 115, 1133–1140 (2009).
18. Woodcock, T., Fagan, C. C., O’Donnell, C. P. & Downey, G. Application of Near and Mid-Infrared Spectroscopy to Determine Cheese Quality and Authenticity. Food Bioprocess Technol. 1, 117–129 (2008).
19. Foca, G. et al. Different feature selection strategies in the wavelet domain applied to NIR-based quality classification models of bread wheat flours. Chemom. Intell. Lab. Syst. 99, 91–100 (2009).
20. Arazuri, S. et al. Rheological parameters determination using Near Infrared technology in whole wheat grain. J. Food Eng. 111, 115–121 (2012).
21. Gibouin, F., Dieudé-Fauvel, E., Baudez, J.-C. & Bendoula, R. Dataset of near infrared spectroscopy measurements to predict rheological parameters of sludge. Data Brief 9, 453–459 (2016).
22. Vittayapadung, S., Jiewen, Z., Quansheng, C. & Chuaviroj, R. Application of FT-NIR spectroscopy to the measurement of fruit firmness of “Fuji” apples. Mj Int J Sci Tech 02, 13–23 (2008).
23. Barnes, R. J., Dhanoa, M. S. & Lister, S. J. Standard Normal Variate Transformation and De-Trending of Near-Infrared Diffuse Reflectance Spectra. Appl. Spectrosc. 43, 772–777 (1989).
24. Cadet, F. et al. Application of fourier transform and proteochemometrics principles to protein engineering. BMC Bioinformatics 19, 382 (2018).
25. Cadet, F. Measurement of sugar content by multidimensional analysis and mid-infrared spectroscopy. Talanta 48, 867–875 (1999).
Acknowledgements
O.L.T. is supported by a PhD grant from the Region Reunion and European Union (FEDER) under European Operational Program FEDER REUNION –2014/2020 File Number 20171389, tiers 216275.Peaccel gratefully acknowledge support froma research program co-funded by the European Union (UE) and Region Reunion (FEDER).The funding agencies had no influence on the conduct of this research.
Author contributions
X.F.C. designed the method. X.F.C., R.D. and M.B. participated in the design of the study and performed the analysis. X.F.C. wrote algorithms. X.F.C., O.L.T., M.B., S.B. and R.D. wrote and corrected the manuscript. All authors read and approved the final version of the manuscript.
competing interests
The authors declare no competing interests.
Additional information
Correspondence and requests for materials should be addressed to X.F.C. Reprints and permissions information is available at www.nature.com/reprints.
Publisher’s note Springer Nature remains neutral with regard to jurisdictional claims in published maps and
institutional affiliations.
Open Access This article is licensed under a Creative Commons Attribution 4.0 International
License, which permits use, sharing, adaptation, distribution and reproduction in any medium or format, as long as you give appropriate credit to the original author(s) and the source, provide a link to the Cre-ative Commons license, and indicate if changes were made. The images or other third party material in this article are included in the article’s Creative Commons license, unless indicated otherwise in a credit line to the material. If material is not included in the article’s Creative Commons license and your intended use is not per-mitted by statutory regulation or exceeds the perper-mitted use, you will need to obtain permission directly from the copyright holder. To view a copy of this license, visit http://creativecommons.org/licenses/by/4.0/.