HAL Id: halshs-01529435
https://halshs.archives-ouvertes.fr/halshs-01529435
Submitted on 15 Apr 2019
HAL is a multi-disciplinary open access
archive for the deposit and dissemination of
sci-entific research documents, whether they are
pub-lished or not. The documents may come from
teaching and research institutions in France or
abroad, or from public or private research centers.
L’archive ouverte pluridisciplinaire HAL, est
destinée au dépôt et à la diffusion de documents
scientifiques de niveau recherche, publiés ou non,
émanant des établissements d’enseignement et de
recherche français ou étrangers, des laboratoires
publics ou privés.
Effects of cognitive impairment on prosodic parameters
of speech production planning in Multiple Sclerosis
Céline Delooze, Noémie Moreau, Laurent Renié, Finnian Kelly, Alain Ghio,
Audrey Rico, Bertrand Audoin, François Viallet, Jean Pelletier, Caterina
Petrone
To cite this version:
Céline Delooze, Noémie Moreau, Laurent Renié, Finnian Kelly, Alain Ghio, et al.. Effects of cognitive
impairment on prosodic parameters of speech production planning in Multiple Sclerosis. Journal of
neuropsychology, Londres : Wiley British Psychological Society, 2017, �10.1111/jnp.12127�.
�halshs-01529435�
Online Proofing System Instructions
The Wiley Online Proofing System allows authors and proof reviewers to review PDF proofs, mark corrections, respond
to queries, upload replacement figures, and submit these changes directly from the PDF proof from the locally saved file
or while viewing it in your web browser.
1.
For the best experience reviewing your proof in the Wiley Online
Proofing System please ensure you are connected to the internet.
This will allow the PDF proof to connect to the central Wiley Online
Proofing System server. If you are connected to the Wiley Online
Proofing System server you should see the icon with a green check
mark above in the yellow banner.
2.
Please review the article proof on the following pages and mark any
corrections, changes, and query responses using the Annotation Tools
outlined on the next 2 pages.
3.
To save your proof corrections, click the “Publish Comments”
button appearing above in the yellow banner. Publishing your
comments saves your corrections to the Wiley Online Proofing
System server. Corrections don’t have to be marked in one sitting,
you can publish corrections and log back in at a later time to add
more before you click the “Complete Proof Review” button below.
4.
If you need to supply additional or replacement files bigger than
5 Megabytes (MB) do not attach them directly to the PDF Proof,
please click the “Upload Files” button to upload files:
5.
When your proof review is complete and you are ready to submit corrections to the publisher, please click
the “Complete Proof Review” button below:
IMPORTANT: Do not click the “Complete Proof Review” button without replying to all author queries found on
the last page of your proof. Incomplete proof reviews will cause a delay in publication.
IMPORTANT: Once you click “Complete Proof Review” you will not be able to publish further corrections.
Online Proofing System Instructions
Connected
Disconnected
Click Here
USING e-ANNOTATION TOOLS FOR ELECTRONIC PROOF CORRECTION TION
Once you have Acrobat Reader open on your computer, click on the Comment tab at the right of the toolbar:
This will open up a panel down the right side of the document. The majority of tools you will use for annotating your proof will be in the Annotations section, pictured opposite. We’ve picked out some of these tools below:
1. Replace (Ins) Tool – for replacing text.
Strikes a line through text and opens up a text box where replacement text can be entered. How to use it
• Highlight a word or sentence.
• Click on the Replace (Ins) icon in the Annotations section.
• Type the replacement text into the blue box that appears.
2. Strikethrough (Del) Tool – for deleting text.
Strikes a red line through text that is to be deleted.
How to use it
• Highlight a word or sentence.
• Click on the Strikethrough (Del) icon in the Annotations section.
3. Add note to text Tool – for highlighting a section to be changed to bold or italic.
Highlights text in yellow and opens up a text box where comments can be entered. How to use it
• Highlight the relevant section of text. • Click on the Add note to text icon in the
Annotations section.
• Type instruction on what should be changed regarding the text into the yellow box that appears.
4. Add sticky note Tool – for making notes at specific points in the text.
Marks a point in the proof where a comment needs to be highlighted.
How to use it
• Click on the Add sticky note icon in the Annotations section.
• Click at the point in the proof where the comment should be inserted.
• Type the comment into the yellow box that appears.
USING e-ANNOTATION TOOLS FOR ELECTRONIC PROOF CORRECTION TION
5. Attach File Tool – for inserting large amounts of text or replacement figures.
Inserts an icon linking to the attached file in the appropriate place in the text.
How to use it
• Click on the Attach File icon in the Annotations section.
• Click on the proof to where you’d like the attached file to be linked.
• Select the file to be attached from your computer or network.
• Select the colour and type of icon that will appear in the proof. Click OK.
6. Drawing Markups Tools – for drawing shapes, lines and freeform annotations on proofs and commenting on these marks. Allows shapes, lines and freeform annotations to be drawn on proofs and for comment to be made on these marks.
How to use it
• Click on one of the shapes in the Drawing Markups section.
• Click on the proof at the relevant point and draw the selected shape with the cursor.
• To add a comment to the drawn shape, move the cursor over the shape until an arrowhead appears. • Double click on the shape and type any text in the
Journal of Neuropsychology (2017) © 2017 The British Psychological Society
www.wileyonlinelibrary.com
Effects of cognitive impairment on prosodic
parameters of speech production planning in
multiple sclerosis
C!eline
De Looze
1,2,
No!emie
Moreau
1,3,
Laurent
Reni!e
3,
Finnian
Kelly
2,
Alain
Ghio
1,
Audrey
Rico
4,
Bertrand
Audoin
4,
Franc
!ois
Viallet
3,
Jean
Pelletier
4and
Caterina
Petrone
1*
11
Laboratoire Parole et Langage, UMR 7309, CNRS & Aix-Marseille Universit!e,
Aix-en-Provence, France
2
Trinity Centre for Bioengineering, TBSI, Trinity College Dublin, Ireland
3
Centre Hospitalier du Pays d’Aix, Service de Neurologie, Aix-en-Provence, France
4
Aix Marseille Univ, APHM, H^
opital de la Timone, P^
ole de Neurosciences Cliniques,
Service de Neurologie, Marseille, France
2 3Cognitive impairment (CI) affects 40–65% of patients with multiple sclerosis (MS). CI can have a negative impact on a patient’s everyday activities, such as engaging in conversations. Speech production planning ability is crucial for successful verbal interactions and thus for preserving social and occupational skills. This study investigates the effect of cognitive-linguistic demand and CI on speech production planning in MS, as reflected in speech prosody. A secondary aim is to explore the clinical potential of prosodic features for the prediction of an individual’s cognitive status in MS. A total of 45 subjects, that is 22 healthy controls (HC) and 23 patients in early stages of relapsing-remitting MS, underwent neuropsychological tests probing specific cognitive processes involved in speech production planning. All subjects also performed a read speech task, in which they had to read isolated sentences manipulated as for phonological length. Results show that the speech of MS patients with CI is mainly affected at the temporal level (articulation and speech rate, pause duration). Regression analyses further indicate that rate measures are correlated with working memory scores. In addition, linear discriminant analysis shows the ROC AUC of identifying MS patients with CI is 0.70 (95% confidence interval: 0.68– 0.73). Our findings indicate that prosodic planning is deficient in patients with MS-CI and that the scope of planning depends on patients’ cognitive abilities. We discuss how speech-based approaches could be used as an ecological method for the assessment and monitoring of CI in MS.
Multiple sclerosis (MS) is the most frequent non-traumatic neurological illness in young adults. This autoimmune disease is characterized by the production of widespread demyelinating lesions in the brain and spinal cord (Chiaravalloti & DeLuca, 2008), whose symptoms include physiological, motor, cognitive, and psychological impairments (Fuso,
Callegaro, Pomp!eia, and Bueno, 2010; Langdon, 2011). Cognitive impairment (CI) affects
*Correspondence should be addressed to Caterina Petrone, 5, Avenue Pasteur, Aix-en-Provence, PACA 13100, France
(email: [email protected]). 4 1 2 3 4 5 6 7 8 9 10 11 12 13 14 15 16 17 18 19 20 21 22 23 24 25 26 27 28 29 30 31 32 33 34 35 36 37 38 39 40 41 42 43 44 45 46 47 48 49 1 J N P 12127
Journal Code Manuscript No. No. of pages: 24 PE: Yuvarani S.
40–65% patients with MS (Bobholz & Rao, 2003; Chiaravalloti & DeLuca, 2008; Langdon, 2011) and includes deficits in planning and decision-making, working memory, attention, and speed of processing.
The identification of CI in MS can be difficult as they may occur at both early and late stages of the disease and may be masked by more visible symptoms, such as fatigue, depression, and pain (Guimar~aes & S!a, 2012; Kraemer, Herold, Uekermann, Kis, Daum, 2013; Kraemer, Herold, Uekermann, Kis, Wiltfang 2013). CI has a negative impact on a patient’s quality of life and as well as their caregivers’ (Labiano-Fontcuberta, Mitchell, Moreno-Garc!ıa, & Benito-Le!on, 2014; Rao et al., 1991). It is therefore important to detect these deficits at an earliest possible stage and to monitor progression frequently, which is particularly crucial for the development and application of remediation strategies (Amato, Zipoli, & Portaccio, 2006).
While cognitive deficits in MS are largely acknowledged, few studies have investigated the extent to which they can affect the ability of patients with MS to speak and engage in conversational interactions. Speech is produced naturally on a daily basis and in large quantities; yet, it is a sophisticated and high general cognitive ability. The planning of speech production involves processes from message generation to articulation (Levelt, 1989). When speakers are engaged in a conversation, they have to quickly plan what to say next. They have to choose the message to convey, the syntactic structure, the words, the segments (consonants and vowels), and the prosody of their sentences. The ability of patients with MS to plan their speech might be crucial for successful day-to-day verbal interactions and thus for preserving social relationships and employment (Northrop, 2005).
In this study, we study how CI in patients with MS can affect the planning of speech production, as reflected in their prosody. A secondary aim of this study was to evaluate the clinical potential of using quantitative speech-based methods for the early detection and monitoring of CI in MS.
Speech planning and prosody in healthy individuals
Psycholinguistic research on healthy individuals provides evidence that the scope of speech production planning (i.e., how far ahead speakers plan the upcoming utterance) varies both as a function of different cognitive-linguistic demands and speaker-specific cognitive abilities.
Concerning cognitive-linguistic demands, it has been found that difficulties in planning longer and more complex sentences are reflected in the prosody of speech (Ferreira, 1991; Swets, Jacovina, & Gerrig, 2013). Speech prosody refers to the global timing, rhythm, and melody of speech, and it is conveyed by multiple acoustic parameters (e.g., acoustic duration, pauses, fundamental frequency). It has generally a linguistic function (e.g., packaging words together in prosodic units which are meaningful and syntactically coherent) and a paralinguistic one (e.g., conveying attitude and emotion). Speech prosody would be indicative of the time needed to plan an utterance (Ferreira, 1991; Swets et al., 2013). For example, under increased cognitive-linguistic demand, speech is characterized by slower articulation rate
5 (Goldman-Eisler, 1961; Swets et al.,
2013), more dysfluencies (i.e., hesitations, repetitions, self-corrections, word
trunca-tions), a higher number of pauses (Clark & Tree, 2002; Fuchs, Petrone, Krivokapi!c, &
Hoole, 2013), and longer pauses (Ferreira, 1991; Fuchs et al., 2013; Krivokapi!c, 2007;
Wheeldon & Lahiri, 1997). A number of studies also reported that an increase in cognitive-linguistic demand by manipulating the phonological length of the upcoming
1 2 3 4 5 6 7 8 9 10 11 12 13 14 15 16 17 18 19 20 21 22 23 24 25 26 27 28 29 30 31 32 33 34 35 36 37 38 39 40 41 42 43 44 45 46 47 48 49 & Wiltfang
utterance leads to an increase in pause duration (Ferreira, 1991; Fuchs et al., 2013;
Krivokapi!c, 2007; Wheeldon & Lahiri, 1997). This is explained by the fact that
phonological length determines how long the encoding time for utterances will be. The melodic characteristics of speech are also indicative of the scope of speech production planning. Speakers would adjust the pitch declination of their utterances (i.e.,
the gradual downtrend of pitch over the course of an utterance; e.g., Garding, 1987; 6
Pierrehumbert, 1979; Prieto, Chilin & Holly, 1996; Shih, 2003) according to the 7 89
phonological length of their utterances. That is, they know in advance how long their utterance is going to be and they will thus systematically plan pitch declination in
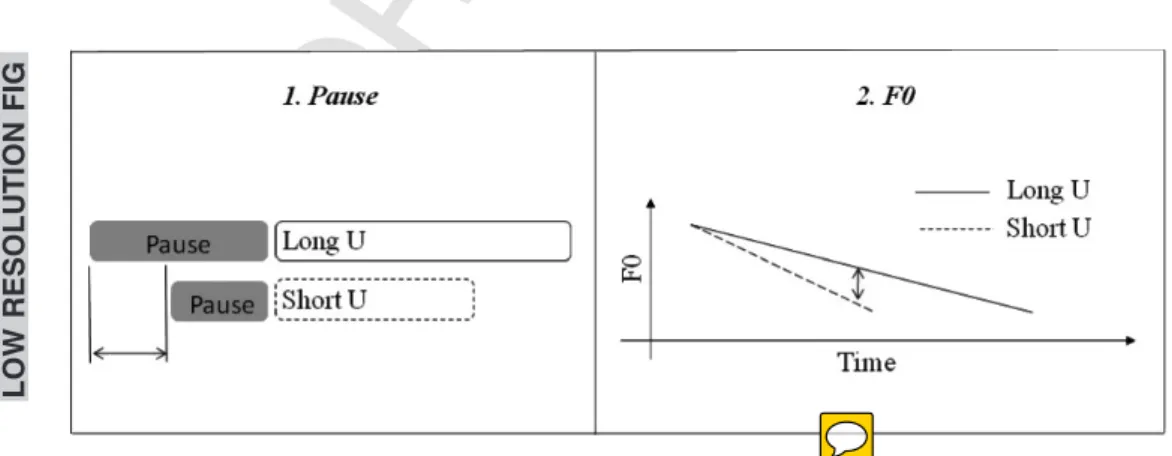
8 advance. The slope of pitch declination across an utterance is steeper for shorter utterances and shallower for longer utterances (Cooper & Sorensen, 1981; Fuchs et al., 2013; Fuchs, Petrone, Rochet-Capellan, Reichel, & Koenig, 2015). A schematization of the findings on healthy speakers for pause duration and pitch declination is illustrated in Figure 1.
In addition to increased cognitive-linguistic demand, psycholinguistic studies also debated the role of individual cognitive abilities on planning. Models share the assumption that language production is incremental: Utterance generation proceeds in a piecemeal (by ‘increments’) fashion, with planning at different levels of the linguistic and
articulatory processes being interleaved (Ferreira, 1991; Krivokapi!c, 2007; Levelt, 1989;
Wheeldon & Lahiri, 1997). However, the issues of how far ahead speakers plan the upcoming sentence and how flexible the units of planning are far from settled. Traditional models of speech production (Levelt, 1989) assume that the scope of planning is fixed (e.g., coinciding with a specific linguistic unit) and that utterance planning generally requires a minimal planning scope. Other psycholinguistic studies on healthy individuals, however, reported that differences in cognitive ability and, in particular, working memory can affect speech production planning at different representational levels. Swets, Desmet, Hambrick, and Ferreira (2007) argued that working memory (WM) is associated with the manner in which silent readers in multiple languages chunk the speech stream into prosodic units of different sizes. Readers with low WM capacity are more likely to chunk the speech into smaller prosodic units (e.g., by inserting a higher number of pauses) than those with high WM, indicating a narrower scope of planning. Similarly, by measuring speech initiation times and eye movements, Swets, Jacovina, and Gerrig (2014) found that speakers with high WM gather advance planning information prior to speaking compared
Figure 1. Schematization of the effects of phonological length of the utterances (U) on pause duration 46
LOW RESOLUTI ON FIG 1 2 3 4 5 6 7 8 9 10 11 12 13 14 15 16 17 18 19 20 21 22 23 24 25 26 27 28 29 30 31 32 33 34 35 36 37 38 39 40 41 42 43 44 45 46 47 48
to speakers with low WM. Such findings led them to conclude that the scope of speech production planning is not structurally fixed but flexible, in that speakers adapt the scope of speech production planning depending on their cognitive ability (Ferreira & Swets, 2002; Levelt & Meyer, 2000).
Speech timing and cognitive deficits in neuropathologies
Measures of speech timing have been shown to be indicative of cognitive-linguistic functioning in several degenerative diseases (e.g., Parkinson’s disease, Alzheimer’s disease, Huntington’s disease; Huber & Darling, 2011
10 ; Lowit, Brendel, Dobinson, &
Howell, 2006; Murray, 2000
11 ; Troche & Altmann, 2012
12 ). Lowit et al. (2006) reported
slower articulation rate and smaller variations in rate between habitual and fast/slow speech conditions with higher cognitive impairment, both in Parkinson’s disease (PD) and early onset dementia.
Concerning MS, at least three studies investigated speech timing as a function of cognitive impairment (Arrondo, Sepulcre, Duque, Toledo, & Villoslada, 2010; Feenaughty, Tjaden, Benedict, & Weinstock-Guttman, 2013; Rodgers, Tjaden, Fee-naughty, Weinstock-Guttman, & Benedict, 2013).
Arrondo et al. (2010) focused on the effect of cognitive impairment in spontaneous speech. CI was assessed through the Brief Repeatable Battery – Neuropsychology (BRB-N, Sepulcre et al., 2006). It was found that patients with CI produced shorter utterances than patients without CI. There was no significant correlation between utterance length and any of the cognitive measures of the BRB-N, leading the authors to hypothesize that the BRB-N test cannot capture specific cognitive measures linked to the language domain.
Feenaughty et al. (2013) and Rodgers et al. (2013) reported in both read and spontaneous speech consistent effects of processing demands on articulation rate, which was slower for MS patients with low cognitive ability than for healthy adults. Feenaughty et al. (2013) also reported a higher number of silent pauses and a lower number of grammatical pauses in MS patients with low cognitive ability. The duration of the silent pauses was not significantly different across the populations. Rodgers et al. (2013) further examined single cognitive predictors of speech and rate measures. They found a moderate association between information processing speed composite scores (as assessed through the PASAT and the SDMT) and speech articulation in both read and spontaneous speech for MS but not for healthy controls. The association of verbal memory and rate measures was negligible in read speech and small in spontaneous speech.
Classification algorithms and clinical diagnosis
An important line of research in speech pathology concerns the potential use of speech prosody-based approaches for the assessment of cognitive impairment (Dodge et al.,
2015; Espinoza-Cuadros et al., 2014; K€onig et al., 2015; L!opez-de-Ipi~na et al., 2013;
Rektorova et al., 2016). Using temporal features extracted from four different speech tasks (counting backward, describing picture, sentence repeating, and semantic fluency)
as input of classification techniques, K€onig et al. (2015) achieved 79%, 87%, and 80%
accuracy in distinguishing HC from patients with mild cognitive impairment (MCI), HC from patients with Alzheimer’s disease (AD), and patients with AD from MCI patients, respectively. Similarly, the use of temporal features extracted from a spontaneous speech fluency test allowed discrimination between patients with AD and HC with a clinically
relevant accuracy of 80% (L!opez-de-Ipi~na et al., 2013). Integrating a set of features based
1 2 3 4 5 6 7 8 9 10 11 12 13 14 15 16 17 18 19 20 21 22 23 24 25 26 27 28 29 30 31 32 33 34 35 36 37 38 39 40 41 42 43 44 45 46 47 48 49
on the temporal organization of speech, pitch, and energy, they obtained an accuracy level of 97.7%. Rektorova et al. (2016) also showed that prosodic features led to 73.2% accuracy in predicting a change in cognitive status.
Research goals and expectations
While cognitive impairment is often found in MS, it is still unclear whether and to what extent such deficits affect speech production planning at specific representational levels in this neuropathology. Based on previous findings, we test in this study whether speech production planning is altered in MS, and whether these alterations are related to cognitive impairment. As a point of departure, we focus on the task of reading sentences aloud as it allows (1) the experimenter to control the manipulation of utterance length and (2) the speakers to solely plan for the production of the prosodic structure and of the segments of the sentences to read.
We expected that, if speech production planning is flexible to cognitive ability, the scope of planning would be narrower in MS speakers with cognitive impairment (and, particularly, with deficits in working memory). We looked at speech timing measures, with the hypothesis that speech in MS speakers with cognitive impairment may be marked by (1) longer utterances (in temporal duration), (2) lower speech rate (i.e., lower articulation rate and higher number of pauses), and (3) more dysfluencies. As the progressive increase in cognitive-linguistic demand can affect both pause duration and pitch declination, we also looked at the effects of the linguistic manipulation of phonological length (or sentence duration) on those parameters across speakers with different cognitive abilities. We expected healthy speakers and MS patients without cognitive impairment to show phonological effects both on preceding pause duration (namely longer utterances should lead to longer pauses) and on pitch declination (longer utterances should be characterized by shallower slopes), as illustrated in Figure 1. On the other hand, MS speakers with cognitive impairment were expected to have difficulties in adjusting pause duration and pitch declination to short/long utterances. Finally, following Rodgers et al. (2013), we investigated which cognitive test relates better to speech and articulation rate. We expected that the PASAT – as a composite measure assessing speed of processing – may relate better than other tests to the rate measures.
In addition, we explored whether prosodic parameters, as input of classification techniques, can have significant discrimination power to assess the cognitive ability of an individual. In line with the literature on other neuropathologies, we hypothesized that speech prosody could be used to identify MS patients with cognitive impairment from speakers without cognitive impairment (HC and MS patients without CI).
Methods
Participants
Twenty-three patients with MS (17 F and 6 M; mean age = 43.26; SD = 11.44) who had a clinically definite MS by the 2010 McDonald criteria (Polman et al., 2011) were recruited from the Department of Neurology of the University Hospital ‘La Timone’ in Marseille, France, and from the Department of Neurology of the ‘Centre hospitalier du Pays d’Aix’ in Aix-en-Provence. All patients were diagnosed with a relapsing-remitting form of MS, which is characterized by periods of acute inflammation followed by periods of recovery.
1 2 3 4 5 6 7 8 9 10 11 12 13 14 15 16 17 18 19 20 21 22 23 24 25 26 27 28 29 30 31 32 33 34 35 36 37 38 39 40 41 42 43 44 45 46 47 48
Patients with MS were matched in age (p = .52), gender (p = .92), and levels of education (secondary education) with 22 healthy volunteers.
The tasks were accomplished when patients attended a day hospital for their monthly therapy based on natalizumab. Participants meeting initial inclusion criteria were invited to participate in the research. Specifically, we included patients with (1) no clinical relapses at the time of the study; (2) no alcoholic history; (3) no concomitant therapy with medications with central nervous system activity (e.g., antidepressant, antipsychotic, and antiepileptic drugs); (4) no history of psychiatric problems; (6) optimal vision (they were capable of reading without specialized aids, and they had no, for example, optic neuritis, cataracts, glaucoma); (7) no dyslexia; (8) no self-reported fatigue prior to the beginning of the experiment; and (9) no dysarthria. No formal test for dysarthria was administered. Dysarthria was first assessed by a neurologist, based on their clinical diagnosis (perceptual evaluation during an oral interview) as well as on the patients’ self-report. A speech therapist made the acoustic recordings (after being intensively trained by the last author, who is an expert phonetician). She perceptually judged the presence of dysarthria based on the reading task. Physical disability was assessed through the EDSS (Expanded Disability Status Scale; Kurtzke, 2008) score. The healthy controls did not have any history of neurological disorder. All participants were native speakers of French.
The recruitment of patients with MS complied with the Declaration of Helsinki (World Medical Association Assembly, 2008)
13 and good clinical practice standards as dictated by
hospital La Timone and the Centre hospitalier du Pays d’Aix. Participants were told that the purpose of the study was to study language in multiple sclerosis, and they were asked to complete a battery of neuropsychological tests and to perform a reading task. Written consent was thus obtained from all enrolees.
Neuropsychological tests
A battery of five neuropsychological tests was presented both to patients with MS and the matched controls. The tests were assessed and administered by the neuropsychologist (NM). Cognitive measures were restricted to memory as we aimed to test specifically the relationship between working memory/speed of processing and prosodic parameters of speech production planning.
The tests were conducted prior of the reading task. They included the following: ! The Paced Auditory Serial Addition Test (PASAT; three-second version; Gronwall,
1977), a test of working memory, speed of information processing, and attention, which consists in adding numbers in three-second intervals.
! The Digit Span task (DigitSpan; Weschler, 2001), a measure of working memory. Participants were asked to repeat back in correct order (forward and backward) a list of numbers.
! The Letter-Number Sequencing Test (LN-Seq) from the Wechsler Memory Scale Third Edition (WMS-III; Weschler, 2001), an executive function task which assesses verbal working memory. Participants were asked to arrange in ascending and alphabetic orders several series of numbers and letters given in a random order.
! Verbal fluency (phonemic fluency or P-fluency and semantic fluency or S-fluency; Cardebat, Doyon, Puel, Goulet, & Joanette, 1990), a measure of lexical (phonemic) and conceptual (semantic) memory. Participants were asked to say as many words starting with a specific phoneme as possible and as many words as possible from a chosen category of animals, in two minutes.
1 2 3 4 5 6 7 8 9 10 11 12 13 14 15 16 17 18 19 20 21 22 23 24 25 26 27 28 29 30 31 32 33 34 35 36 37 38 39 40 41 42 43 44 45 46 47 48 49
Normativedata were derived from the healthy control (HC) group’s neuropsycholog- 14
ical scores. PASAT, LN-Seq, DigitSpan, P-fluency, and S-fluency raw scores were first transformed to z-scores to account for the effect of age by employing a regression-based
approach (Parmenter, Testa, Schretlen, Weinstock-Guttman, & Benedict, 2010). Patients 15 16
with MS were then categorized into two groups, Cognitive Impaired (MS-CI) and Non Cognitive Impaired (MS-NCI). The definition of cognitive impairment is based on the scores obtained for each patient with MS (Labiano-Fontcuberta et al., 2014). The patients who obtained a score ≤ 1.5 SD on at least one of the five neuropsychological tests were denoted as MS-CI (N = 9). The patients who obtained five scores above this threshold were denoted as MS-NCI (N = 14). In total, five of the MS-CI were impaired on one cognitive task, three were impaired on two cognitive tasks, and one was impaired on four cognitive tasks. They therefore all fulfilled our criteria of cognitive impairment. Table 1 reports mean, standard deviation, and range of the demographic, clinical, and neuropsy-chological data for the HC, MS-CI, and MS-NCI groups.
Speech task Corpus and procedure
All participants read five sets of sentences. Each set was composed of four pairs of sentences, including a Context sentence and a Target sentence. The Context and Target sentences were separated by a colon, to induce the speakers to produce a pause between the two sentences. There were no other punctuation marks in the sentences, which might bias speakers’ productions towards specific prosodic patterns. In each pair, the Context sentence was the same. The Target sentence was composed of Subject–Verb–Object syntactic constituents. While the Verb was always monosyllabic, the Subject and the Object constituent were proper names that were modified across three length conditions. This manipulation resulted in three sentence length types: short (Short Subject + Short Object), medium (Short Subject + Long Object or Long Subject + Short Object), and long (Long Sub-ject + Long ObSub-ject). Table 2 provides an example of a sentence set used in the
experiment with Target sentences varying in Subject and Object length. The use of 17
proper nouns for the subject and prepositional phrase was aimed at keeping the syntactic and semantic structure of the sentences constant across the length manipulations.
Context and Target sentences were presented in a random order on a computer screen and printed each in one line to ensure that participants did not place prosodic boundaries due to line breaks. Sentences were repeated three times. Fourteen sentences with different syntactic structures were also inserted as fillers in between the sets of sentences to minimize reading habituation effects. Speakers were asked to read the corpus in a natural way, but were not given any explicit instructions about the prosody to be employed. Each speaker read 60 Target sentences (five set * two Subject length * two Object length * three repetitions). In total, the experimental corpus consists of 2,700 observations (60 sentences * 45 participants).
Patients with MS and healthy controls were recorded in a quiet environment. The software EVA2, SQLab (Ghio et al., 2012), and a headworn microphone (AKG C420) were used for the recordings. The audio signal was recorded at 25 kHz/16 bits. The acoustic recording lasted around 35 min. The speech tasks and cognitive tests were conducted on
1 2 3 4 5 6 7 8 9 10 11 12 13 14 15 16 17 18 19 20 21 22 23 24 25 26 27 28 29 30 31 32 33 34 35 36 37 38 39 40 41 42 43 44 45 46 47 48
Table 1. Comparison of demographic, clinical, and neuropsychological characteristics of patients with MS and healthy controls HC (N = 22) MS (N = 23) MS-NCI (N = 14) MS-CI (N = 9) p Value (HC vs MS) p Value (MS-NCI vs HC) p Value (MS-NCI vs MS-CI) R 2 Mean SD Range Mean SD Range Mean SD Range Mean SD Range Gender (M/F) 7/15 6/17 5/9 1/8 .92 .25 .80 .009 Age 41.27 8.89 26 –61 43.26 11.44 25 –63 45.36 10.92 25 –63 40 12.11 26 –60 .52 .24 .22 " .01
Disease duration (year)
–– – 11.04 6.31 2 –24 9.57 6.48 2 –23 13.33 5.61 7 –24 –– .16 .04 EDSS –– – 3.39 1.52 1 –6.5 3.07 1.17 1 –4.5 3.88 1.91 1.5 –6.5 –– .21 .02 PASAT 55.27 5.86 41 –60 52.26 9.87 22 –60 55.42 4.52 47 –60 47.33 13.78 22 –60 .22 .95 .01 .11 DigitSpan 18.27 3.67 9 –24 15.56 3.68 9 –22 16.85 3.01 12 –22 13.55 3.87 9 –22 .01 .24 .03 .17 LN-Seq 13.64 3.06 8 –19 10.87 2.82 5 –16 12.14 2.35 9 –16 8.88 2.37 5 –13 .002 .11 .007 .28 P-fluency 32.71 10.4 17 –54 27.52 6.47 16 –38 27.86 6.75 19 –38 27 6.38 16 –33 .06 .12 .81 .01 S-fluency 34.94 9.17 22 –60 34.52 7.61 21 –53 35.57 7.25 25 –53 32.88 8.29 21 –47 .87 .83 .45 " .03 Notes . EDSS, Expanded Disability Status Scale; PASAT, Paced Auditory Serial Addition Test (three-second version; maximum score = 60); LN-seq, Letter-Number Sequencing test (maximum score = 21); DigitSpan, Digit Span task (maximum score = 30); P-fluency, phonemic fluency test; S-fluency, semantic fluency test; HC, healthy controls; MS-NCI, patients with multiple sclerosis and no cognitive impairment; MS-CI, patients with multiple sclerosis and cognitive imp airment. For P-fluency and S-fluency, there is no threshold for maximal score. Means, SD ,and range (minimum –maximum) are reported for each test. Linear regression models were used for comparison of continuous demographic data and neuropsychological scores and generalized linear models for gender proportion. R 2 is the explained variance for models including pairwise comparisons between MS-NCI versus HC and between MS-NCI versus MS-CI (negative R 2 indicates the explained variance close to zero). Means, standard deviation (SD ), and range (minimum; maximum) are reported. 1 2 3 4 5 6 7 8 9 10 11 12 13 14 15 16 17 18 19 20 21 22 23 24 25 26 27 28 29 30 31 32 33 34 35 36 37 38 39 40 41 42 43 44 45 46 47 48 49
the same day. The whole experiment was kept at a reasonable duration for each speaker (less than one hour) to minimize possible fatigue effects.
Acoustic annotation
The acoustic annotation was made by the first author (CD), who is an expert phonetician and specialist of French prosody. The first author was not present at the experiments, and she was blind to the group status (CI/NCI) while performing the annotation. 10% of the data was also annotated by a colleague phonetician (who was blind to the subject study) for
inter-rater comparison (Feenaughty et al., 2012; Rodgers et al., 2013). The recordings 18
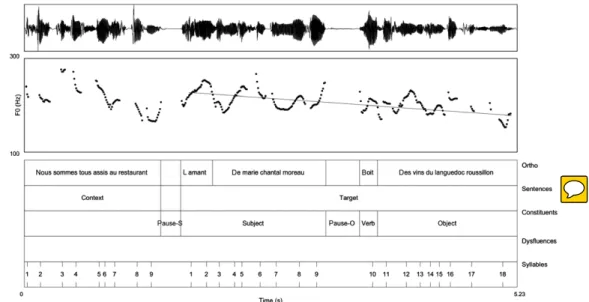
were orthographically transcribed and annotated using the Praat software (Boersma & Weenink, 2015). Acoustic boundaries for the Context and Target sentences, the Subject, Verb and Object constituents of the Target sentences, grammatical and ungrammatical pauses (respectively, between and within syntactic constituents) were semi-automatically derived from the orthographic transcription using Praat scripts. The pause threshold used in the automatic procedure was set at 100 ms to ensure its distinction with silent plosives in the present corpus (Sanderman & Collier, 1995). Their alignment was checked in all the data set and manually corrected. Manual correction of pause boundaries was based on both auditory information and visual inspection of the spectrograms and waveforms (Keating, 1994). Grammatical pauses at major syntactic boundaries included the pauses at the colon between the Context and the Target sentences, that is, immediately before the Subject of the Target sentences (pause-S); grammatical pauses at minor syntactic boundaries included the pauses preceding Object of the Target sentences, which was actually realized immediately before the monosyllabic Verb (pause-O). Pause-S and pause-O were expected to vary accordingly with the Subject and Object length of the Target sentence, respectively. Syllables were automatically aligned to the signal using a modified version of De Jong & Wempe’s Praat script (De Jong & Wempe, 2009) and then manually corrected. Speech dysfluencies (N = 227) were manually annotated. Speech dysfluencies included hesitations (e.g., ‘erm’; N = 46), corrections (e.g., ‘Le la mamie’; N = 126), truncations (e.g., ‘la mar-la mamie’; N = 38), and repetitions (e.g., ‘La la la la mamie’; N = 17; Shriberg, 2001). Figure 2 shows example of the annotations carried out.
A set of prosodic (temporal and pitch) features was automatically extracted from the Target sentences using Praat scripts. Temporal features include sentence duration, articulation rate (number of syllables per second excluding pauses), speech rate (number of syllables per second including pauses), number and duration of grammatical (pause-S
Table 2. Example of a sentence set, with Target sentences varying in length
Context sentence Nous sommes tous assis au restaurant (We are all sitting in the restaurant) Target sentence
Short (SS/SO)
l’amant de Marie boit des vins de Bordeaux (Marie’ s lover is drinking wines from Bordeaux) Medium
(LS/SO)
l’amant de Marie-Chantal Moreau boit des vins de Bordeaux (Marie-Chantal Moreau’ s lover is drinking wines from Bordeaux) Medium
(SS/LO)
l’amant de Marie boit des vins du Languedoc-Roussillon (Marie’ s lover is drinking wines from Languedoc-Roussillon) Long
(LS/LO)
l’amant de Marie-Chantal Moreau boit des vins du Languedoc-Roussillon (Marie-Chantal Moreau’ s lover is drinking wines from Languedoc-Roussillon)
1 2 3 4 5 6 7 8 9 10 11 12 13 14 15 16 17 18 19 20 21 22 23 24 25 26 27 28 29 30 31 32 33 34 35 36 37 38 39 40 41 42 43 44 45 46 47 48
and pause-O) and ungrammatical pauses, and number of dysfluencies. All the features were derived from the manually corrected annotations described above.
Pitch features include pitch declination trend. Pitch declination trend was modelled by fitting a least-squares regression line to the pitch trajectory in the Target sentence. The slope of the regression line was then computed. Pitch values were first extracted using a Praat script. To avoid pitch-tracking errors, we used the algorithm proposed by the first author [Reference to be added after revision
19 ].
Inter-rater reliability on 10% of the data was assessed by computing average absolute measurement error and standard deviations as well as Pearson’s correlation coefficients and Mann–Whitney U-tests (Feenaughty et al., 2012; Rodgers et al., 2013). The absolute measurement error corresponds to the absolute difference between the measurements made by the first rater and the measurements made by the second rater on a sample-by-sample basis. Appendix presents the average and standard deviation absolute measure ment errors and Pearson’s correlation coefficients obtained for each acoustic measure-ment. In average, the measurement errors are low (between 0.01 and 0.16) and the correlations are high (between .88 and .99). These results are in line with Feenaughty et al. (2012) and Rodgers et al. (2013). In addition, Mann–Whitney U-tests showed no difference between the acoustic measurements based on the first rater’s annotation and those based on the second rater’s annotation (p < .05).
Figure 2. Example of analysis performed in the Praat software. Waveform, pitch track, and annotations for a sentence extracted from the speech of a HC speaker: ‘Nous sommes tous assis au restaurant: l’amant de Marie Chantal Moreau boit des vins du Languedoc Roussillon’ (We are all sitting in the restaurant: Chantal Moreau’ s lover is drinking wines from Languedoc-Roussillon). The annotation layers correspond, from top to bottom, to the (1) orthographic transcription, (2) sentence type (Context and Target), (3) syntactic constituent type within the Target sentence (Subject, Verb, Object) and presence of grammatical pauses (between syntactic constituents), (4) presence of ungrammatical pauses (within syntactic constituents) and/or dysfluencies, and (5) number of syllables for each sentence type. The curve above the annotated layers represents the pitch contour (as represented by the fundamental frequency or F0 curve, given in Hz), and the straight line the regression line calculated for the measurement of pitch declination for the Target sentence. 1 2 3 4 5 6 7 8 9 10 11 12 13 14 15 16 17 18 19 20 21 22 23 24 25 26 27 28 29 30 31 32 33 34 35 36 37 38 39 40 41 42 43 44 45 46 47 48 49
Statistics
All statistical tests were performed in the R software environment (R Development Core Team, 2008). Linear regression models were used for comparison of continuous demographic variables and neuropsychological scores, generalized linear model for gender proportion.
A series of mixed model was run to test separately for the relationship between cognitive abilities and both temporal and pitch characteristics of speakers’ utterances. Linear mixed models were used for continuous data and logit mixed models for discrete data. Mixed models have the advantage of dealing with unbalanced data, interspeaker
variability, and repeated-measures designs. As fixed effect, Group (HC/MS-NCI/MS-CI) 20
was included to test the impact of cognitive ability on all the temporal and pitch features described above. The MS-NCI group was the intercept of the model (reference level), to which the other groups were compared (‘dummy’ contrasts). We expect this group
to behave similarly to HC but to differ from MS-CI. Thefactor Length served as covariate to 21
evaluate the effects of Subject (short/long) and Object (short/long) Length on the duration of pause-S and pause-O, respectively. The effect of the Length of the whole utterance (short/medium/long) was also added as a covariate on the analyses on pitch declination trend. For f0, the factor SEX was added as males have lower fundamental frequency than females. In all models, speaker, word, and repetition by speaker constituted the random intercepts. The models had maximal random structure (Barr, Levy, Scheepers, & Tily, 2013). Backward elimination of non-significant parameters was assessed through likelihood ratio tests comparing full models (e.g., which contained all parameters) with simpler ones (e.g., which contained a subset of these parameters). The cut-off point for significance was p < .05.
Finally, the explanatory power of each cognitive test was tested to verify which cognitive component better account for speech behaviour. We focused only on speech and articulation rate as it has been already suggested that processing speed is a stronger predictor for speech rate measures in MS (Rodgers et al., 2013). A series of linear mixed models were run separately on speech and articulation rate, in which the score for each cognitive tests was entered as a numerical variable using a forward selection, that is, with the test which better distinguished between the groups (HC/MS-NCI/MS-CI) added first, followed by the score for subsequent tests. The scores were centred around their mean. The models were run both on healthy controls and patients with MS, to verify possible interactions between cognitive scores and groups. Likelihood ratio tests were again used to compare nested models (p < .05).
Classification
A linear discriminant analysis (LDA) classifier, together with the pitch and temporal features described in the section Acoustic Analyses, was used for the classification analysis. As the main focus of this study is the relationship between prosodic features and cognitive impairment, we first evaluated the discrimination of CI and NCI (HC and MS-NCI combined) speakers. Although we observed no significant difference between the features of HC and MS-NCI, as they are drawn from separate populations (MS and HC), we also considered the two-class discrimination of MS-CI and HC and of MS-CI and NCI. Finally, for completeness, we also considered the discrimination of MS-NCI and HC.
For each classification experiment, training and testing feature sets were created by
1 2 3 4 5 6 7 8 9 10 11 12 13 14 15 16 17 18 19 20 21 22 23 24 25 26 27 28 29 30 31 32 33 34 35 36 37 38 39 40 41 42 43 44 45 46 47 48
condition is unbalanced (MS-CI = 9, MS-NCI = 14, HC = 22), the random subsampling was carried out with the constraint that the ratio of training-testing speakers was approximately 2:1 for each class of subject (e.g., 2:1 for patients with MS-CI and 2:1 for patients with MS-NCI). Furthermore, to ensure independence between training and testing features, there was no overlap between the speakers in each group. With this experimental design, classification proceeded as follows:
! After selecting random training and testing speakers, a linear discriminant analysis classifier was trained. Regularization was applied to suppress the influence of outliers. To account for imbalance in the number of features for positive and negative classes (e.g., MS-CI and HC), the training features were weighted according to the inverse frequency of their class occurrence.
! The trained classifier was applied to the testing feature set to obtain predicted class labels and associated probabilities.
! The actual class labels were then used to evaluate the quality of the predictions. The receiver operating characteristic (ROC) area under the curve (AUC) was computed as the primary metric, as it integrates the performance of the classifier across the full range of operating points. As additional metrics, we provide the accuracy rate, which is the fraction of correct decisions made by the classifier, the false acceptance rate (FAR), which is the fraction of negative samples classified as positive, and the false rejection rate (FRR), which is the fraction of positive samples classified as negative. The FAR and the FRR represent type I and type II errors, respectively.
! This random subsampling, training and testing procedure was repeated 50 times. Based on preliminary testing, a value of 50 was chosen as it was sufficiently large to ensure stable average error metrics. The final error metrics we present are the average values over the 50 iterations.
Results
Demographic and clinical variables
There was no significant difference on gender and age between healthy controls and patients with MS, independent of their cognitive functioning (MS-NCI/MS-CI). There was no statistically significant difference in disease duration and in EDSS score between the MS-NCI and the MS-CI groups. Hence, the demographical and clinical characteristics of the participants were equivalent.
Neuropsychological tests
There was a significant difference between healthy controls and patients with MS both in the DigitSpan and in the LN-seq tests, with lower performance for MS patients with cognitive impairment. When looking at pairwise comparisons, the MS-CI group had significantly lower scores than the MS-NCI group in the PASAT, LN-seq and DigitSpan. On the other hand, there was no significant difference between the HC and MS-NCI groups. Mean differences between participants with (MS-CI) or without (HC/MS-NCI) cognitive impairment are in line with prior work with the same test battery (Genova, Lengenfelder, Chiaravalloti, Moore, & DeLuca, 2012; Fontcuberta et al., 2014; Rodgers et al., 2013
22 ).
Explained variance ranged from 11% for PASAT to 28% for LN-seq. There was no significant difference for S-fluency and P-fluency (p > .05). To sum up, comparison on
1 2 3 4 5 6 7 8 9 10 11 12 13 14 15 16 17 18 19 20 21 22 23 24 25 26 27 28 29 30 31 32 33 34 35 36 37 38 39 40 41 42 43 44 45 46 47 48 49
cognitive tests resulted in expected differences in speed of processing and working memory disfavouring MS patients with cognitive deficits.
Speech task Group
As summarized in Table 3, many prosodic characteristics of patients with MS-CI are significantly different from those of MS-NCI group, while no differences were found between the MS-NCI and the HC groups (p < .05). The Target sentences produced by MS-CI were characterized by a significant longer duration, higher number of dysfluencies, higher number of ungrammatical pauses. In addition, MS-CI produced a significantly lower number of pauses at major syntactic boundaries, that is, between the Context and the Target sentence. As for discrete variables, differences were very small and graphical exploration showed that this type of results is mostly driven by three to four speakers with CI.
Length
Pause-S was independent of Length (p > .05). However, pause-O was significantly longer before long Object constituents than before short ones (b = 0.23, SE = 0.06, t = 3.53, p = .002). There was no effect of Group and no interaction Length by Group. The
declination line was steep in the ‘short’ condition, with a mean negative slope of"0.68;
shallower ("0.56) in sentences of medium size and; even shallower ("0.41) in longer
sentences. The contrasts between short and medium sentences (b = 0.21, SE = 0.04, t = 4.44, p = .002) as well as short and long (b = 0.37, SE = 0.05, t = 7.10, p = .002) sentences were in fact significant. There was an interaction Length by Group, with declination slope in medium sized sentences being flatter in MS-CI than in MS-NCI (b = "0.14, SE = 0.06, t = "2.24, p = .02).
Cognitive tests and speech rate measures
Figure 3 shows the articulation rate of each utterance (y axis) across the scores for the LN-seq test. Results are plotted separately for patients with HC and MS. As can be seen, there is no difference in articulation rate by LN-seq score in HC. For instance, the mean value at lowest (LN-seq = 8) and highest (LN-seq = 19) scores is 5.66 syll/s and 5.46 syll/s, respectively. On the other hand, there is a positive and gradual relationship of the LN-seq score and articulation rate in MS, in that articulation rate is faster as the LN-seq score increases. Hence, at lowest (LN-seq = 5) score and highest (LN-seq = 16) score, mean articulation rate is 4.57 syll/s and 6.05 syll/s, respectively. A similar relationship was observed for speech rate, where mean values are between 4.45 and 5.93. These results are similar in magnitude to those reported by Feenaughty et al. (2013) and Rodgers et al. (2013). The results of the stepwise regression models predicting the speech rate measures confirmed that, for MS, the scores obtained in LN-seq test are related in a linear fashion
with articulation rate (b = 0.10, SE = 0.04, t = 2.15, p = .02, R2m = .09, R2c = .63) and
with speech rate (b = 0.09, SE = 0.04, t = 2.0, p = .03, R2m = .09, R2c = .61).
Likelihood tests showed that adding other cognitive tests (i.e., PASAT and DigitSpan) in the models did not significantly increase the goodness of fit of the model. There was no significant relation between cognitive scores and articulation/speech rates in HC.
1 2 3 4 5 6 7 8 9 10 11 12 13 14 15 16 17 18 19 20 21 22 23 24 25 26 27 28 29 30 31 32 33 34 35 36 37 38 39 40 41 42 43 44 45 46 47 48
Table 3. Comparison of the speech characteristics of patients with and without cognitive impairment (MS-CI and MS-NCI, respectively) and healthy controls (HC)
Prosodic features
Groups Contrasts Effect size
HC MS-NCI MS-CI MS-NCI vs HC MS-NCI vs MS-CI R
2
Discrete data Mean (SD) Mean (SD) Mean (SD) b SE z p Value b SE z p Value R2m R2c Nb of pauses 0.49 (0.57) 0.56 (0.58) 0.79 (0.69) "0.28 0.25 "1.13 .25 0.40 0.31 1.2 .19 .03 .34 Nb of pause-S 0.86 (0.33) 0.91 (0.27) 0.71 (0.45) "0.45 1.08 "0.42 .67 "2.70 1.29 "2.09 .03 .07 .74 Nb of pause-O 0.44 (0.49) 0.49 (0.50) 0.61 (0.48) "0.36 0.59 "0.62 .53 0.74 0.73 1.00 .31 .02 .55 Nb of ungrammatical pauses 0.03 (0.20) 0.03 (0.18) 0.10 (0.36) "0.01 0.40 "0.04 .96 1.32 0.45 2.91 .003 .004 .004 Nb of dysfluencies 0.04 (0.21) 0.07 (0.28) 0.28 (0.67) "0.53 0.44 "1.19 .23 1.18 0.50 2.34 .01 .07 .23 Continuous data Mean (SD) Mean (SD) Mean (SD) b SE t p value b SE t p value R2m R2c Sentence dur. (ms) 2,770 (0.65) 2,881 (0.80) 3,284 (1.17) "0.023 0.03 "0.67 .52 0.12 0.04 2.75 .004 .03 .17 Articulation rate (syll/s) 5.66 (0.67) 5.51 (0.84) 5.21 (0.99) 0.88 0.16 0.52 .60 "0.18 0.21 "0.88 .36 .01 .63 Speech rate (syll/s) 5.54 5.39 5.11 0.10 0.17 0.62 .56 "0.33 0.21 "1.51 .14 .03 .61 Pause_S dur. (ms) 442 (0.31) 452 (0.29) 359 (0.26) "0.009 0.22 "0.039 .96 "0.25 0.28 "0.90 .36 .01 .65 Pause_O dur. (ms) 179 (0.15) 176 (0.15) 236 (0.20) "0.10 0.16 "0.61 .57 0.40 0.20 2.03 .02 .05 .37 Pitch declination "0.53 (0.61) "0.61 (0.49) "0.48 (0.49) 0.09 0.13 0.71 .48 0.18 0.16 1.09 .26 .009 .47 Note. Means and standard deviation (SD) are reported. Pause-S, pause preceding the Subject of the Target sentence; pause-O, pause preceding the Verb of the Target sentence. Generalized mixed models were used for comparisons of discrete data (counts and proportions) and linear mixed models for continuous data. Nb, number; dur., duration.b, estimate of the regression models; SE, standard error of the estimate; z, z-score from the logit mixed models; t, t-score from the linear mixed models; HC, healthy controls; MS-NCI, patients with multiple sclerosis and no cognitive impairment; MS-CI, patients with multiple sclerosis and cognitive impairment. Following standard procedures for mixed models (Nakagawa & Schielzeth, 2013)
23 , both marginal R2
(R2m, which describes the proportion of variance explained by the fixed factors alone) and conditional R2(R2c, which describes the proportion of variance explained by both the fixed and random factors) are reported.
14 C !eline De Looze et al.
Classification
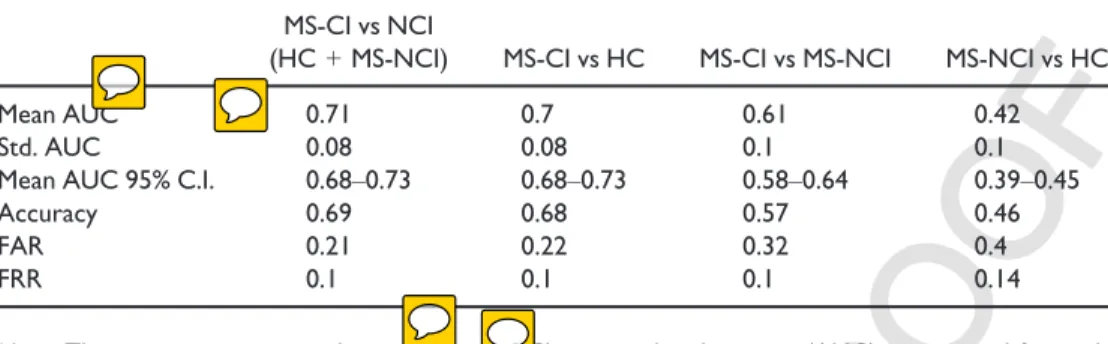
Table 4 provides the ROC AUC for each pairwise comparison with corresponding standard deviation and 95% confidence interval. Accuracy rates, false acceptance rates (FAR), and false rejection rates (FRR) are also given. The linear discriminant analysis shows moderate performance in predicting the cognitive status of an individual, the ROC AUC of identifying MS-CI versus NCI (MS-NCI + HC), MS-CI versus MS-NCI, and MS-CI versus HC being of 0.71, 0.61, and 0.70 (95% confidence interval: 0.68–0.73; 0.58–0.64; 0.68–0.73), respectively. As expected from the above statistical analyses on Group differences, low
Figure 3. Relation between articulation rate and LN-seq scores for healthy controls (HC, left) and 47
patients with multiple sclerosis (MS, right). The straight line indicates the best fit obtained through linear regression. The grey area around the straight lines marks the 95% confidence interval.
LOW RESOLUTI ON COLOR FIG 1 2 3 4 5 6 7 8 9 10 11 12 13 14 15 16 17 18 19 20 21 22 23 24 25 26 27 28 29 30 31 32 33 34 35 36 37 38 39 40 41 42 43 44 45 46 47 48
performance was reached for the classification of the MS-NCI versus HC (AUC = of 0.42; 95% confidence interval: 0.39–0.45).
Discussion
In this study, we investigated how cognitive impairment (as measured by means of neuropsychological testing) is reflected in the speech production planning of MS speakers, through the analysis of their temporal and pitch characteristics during a read speech task.
Our analyses first revealed that MS-CI read speech is characterized by longer sentences and longer pauses at minor syntactic boundaries (i.e., before the Verb of the Target sentence). It also shows that differences in articulation and speech rate in MS are gradual as rate progressively increased with working memory. In particular, the regression analyses demonstrated that the LN-seq test is the assessment of working memory which is the most sensitive to prosodic features. In addition, MS-CI read speech is marked by more ungrammatical pauses and dysfluencies. However, the meaningfulness of such findings is questionable, given that differences are quantitatively small and prone to speaker-specific variation. With regard to the effect of phonological length, pauses before the Object were correlated with the Object length, such that the longer the Object, the longer the pause. Utterance length also had an effect on pitch declination with shorter utterances marked by steeper pitch declination slope. There was no consistent interaction Length by Group (the only one found was that pitch declination slope was shallower in MS-CI in sentences of medium size). Hence, MS speakers with cognitive impairment have no difficulties in adjusting pause duration and pitch declination to short/long utterances.
Our findings on articulation rate and speech rate corroborate earlier studies by Rodgers et al. (2013) and Feenaughty et al. (2013) on read speech. Furthermore, when examining values at the lowest and highest LN-seq score, differences in rate measures (about one to two syllables) were greater in magnitude than those found by such studies. Note also that the speed of articulation movements producing speech sounds generally spans over a small range of variation, for example, between 4.4 and 5.9 syll/s and that this variation is actually perceptually noticeable (Goldman-Eisler, 1961).
Table 4. Linear discriminant analysis performance MS-CI vs NCI
(HC + MS-NCI) MS-CI vs HC MS-CI vs MS-NCI MS-NCI vs HC
Mean AUC 0.71 0.7 0.61 0.42
Std. AUC 0.08 0.08 0.1 0.1
Mean AUC 95% C.I. 0.68–0.73 0.68–0.73 0.58–0.64 0.39–0.45
Accuracy 0.69 0.68 0.57 0.46
FAR 0.21 0.22 0.32 0.4
FRR 0.1 0.1 0.1 0.14
Note. The receiver operating characteristic (ROC) area under the curve (AUC) is reported for each pairwise comparisons with corresponding standard deviation and 95% confidence interval. Accuracy rates, false acceptance rates (FAR), and false rejection rates (FRR) are also given. Comparisons include MS patients with cognitive impairment (MS-CI), MS patients with no cognitive impairment (MS-NCI), and healthy controls (HC). 1 2 3 4 5 6 7 8 9 10 11 12 13 14 15 16 17 18 19 20 21 22 23 24 25 26 27 28 29 30 31 32 33 34 35 36 37 38 39 40 41 42 43 44 45 46 47 48 49
Our findings are in line with studies on other neuropathologies where slower articulation rate was also observed with more cognitive-linguistic deficits (Huber & Darling, 2011; Lowit et al., 2006). Similarly to Rodgers et al. (2013), regression models predicting rate from cognitive abilities were significant for patients with MS but not for healthy controls. Given that the distribution of working memory scores is about the same in both MS and HC, the difference could be due to the fact that the reading task has a higher cognitive load in patients with MS, while it has no cognitive impact on healthy population. It is also interesting to note that the fastest-articulating patients with MS are basically performing at the same level as the healthy population, but the MS patients with low working memory are lower, and there is a linear effect downwards depending on working memory. This could indicate that MS ‘erodes’ the efficiency of language production by some mechanisms other than working memory, but that high WM provides a buffer against that erosion. It is unclear at this point what that mechanism is. In this study, dysarthria was assessed by informal perceptual judgements. It is possible that patients with MS increased effort to maintain their speech perceptually fluent while reading. Such an increase in cognitive load might have affected the efficiency in speech production, resulting in slower articulation/speech rate. This account is though only speculative, and future studies with a larger number of participants will be carried out in the future to better understand the relationship between speech timing and cognition.
In addition, contrary to our expectations based on Rodgers et al. (2013), the PASAT was not a good predictor for rate measures. This might be due to different reasons. First, the test battery to measure cognitive abilities is partially different between the two studies. The LN-seq test, which was the best predictor in our study, was not used in Rodgers et al. (2013)’s battery. The design of the read speech task can also account for this discrepancy. The Grandfather Passage (Duffy, 2005), used in Feenaughty et al. (2013) and Rodgers et al. (2013), was originally designed for the evaluation of speech motor functioning and speech intelligibility. The text consists of sentences varying in syntactic and semantic complexity, which might require longer time to process the information. In the current study, the linguistic material was strictly controlled because of the specific goal of evaluating how phonological length impacts prosodic parameters of planning. The syntactic complexity and semantic complexity were kept constant across the sentences. Hence, it is possible that patients with MS might have experienced working memory (rather than processing speed) difficulties when planning sentences varying only at the phonological level, but similar structure at other representational levels. The LN-seq test might have captured this processing difficulty better than the PASAT.
In addition, Feenaughty et al. (2013) found less grammatical pauses for MS patients with cognitive impairment. We, however, observed (1) less grammatical pauses at major prosodic boundaries only, (2) more ungrammatical pauses, and (3) more dysfluencies for the MS-CI group. The differences were smaller than those reported by Feenaughty et al. (2013), and they were mostly due to individual differences. We propose that the different findings can be accounted for by the design of the read speech task.
The relationship between prosodic features and cognitive ability is interpreted in the light of psycholinguistic literature on healthy individuals, which has attributed a crucial role to cognitive resources in sentence production. Swets et al. (2007) proposed that working memory might be involved in speech production planning. As speakers have to store planning units in working memory before execution, the size of the planning units might depend on individual working memory capacity. As a consequence, working memory differences across individuals would be reflected in the
1 2 3 4 5 6 7 8 9 10 11 12 13 14 15 16 17 18 19 20 21 22 23 24 25 26 27 28 29 30 31 32 33 34 35 36 37 38 39 40 41 42 43 44 45 46 47 48
cognitive resources in MS patients with low working abilities might have affected their planning, resulting in a different reading behaviour. Slower articulation and speech rate may be attributed to a longer time needed to plan the upcoming speech material. The higher number of pauses and dysfluencies in some MS patients with cognitive impairment suggests a narrowing down of the scope of planning units compared to MS-NCI and HC groups. Our findings therefore indicate that the planning of prosodic units is adapted by speakers depending on their cognitive ability. This supports the claim that the scope of speech production planning is flexible (Ferreira & Swets, 2002; Swets et al., 2007).
Concerning the cognitive-linguistic demand manipulation, our results on the effects of phonological length on the duration of the pause before the Object constituent and on pitch declination slope are in line with previous studies on healthy individuals (Cooper & Sorensen, 1981; Fuchs et al., 2013, 2015; t’Hart, 1979
24 ; Thorsen, 1986
25 ),
further supporting that the temporal and melodic characteristics of speech are indicative of speech production planning. Specifically, we found that the duration of the pause before the Object constituent (pause-O) was longer before long constituents and shorter before short constituents. This means that pause duration is sensitive to the length of the immediately upcoming constituent. On the other hand, the pause between the Context and the Target sentence was insensitive to the length manipulation. One possible explanation for the lack of effect is that the Context sentence was the same across the sentence sets. Given the low cognitive-demand associated with the production of the Context sentence, speakers might have started to plan the Subject constituent already during the production of the Context sentence. These findings are similar to Fuchs et al. (2013) for healthy individuals and indicate that the pause duration is a local parameter of planning. As for pitch declination, speakers adjusted the pitch slope depending on the length of the whole utterance, thus indicating that they plan the pitch contour in a more global manner (i.e., with larger look-ahead). The fact that there was no consistent interaction between Length and Group might be related to the specific linguistic manipulation applied. The increase in utterance length may not have required high cognitive-linguistic demand as intended to show any further distinctive characteristics between CI and NCI subjects. In future experiments, more complex syntactic/prosodic structures will be needed to induce higher cognitive-linguistic demand.
In line with research on other neurological pathologies (Dodge et al., 2015; K€onig
et al., 2015; L!opez-de-Ipi~na et al., 2013; Rektorova et al., 2016), our study reveals
moderate to high performance in predicting the cognitive status of an individual, suggesting that prosodic features, along with other speech and language characteristics, could be potentially used as markers for the evaluation of CI in MS. Neuropsychological tests are currently used for the assessment and monitoring of CI. These tests may be, however, time-consuming, may be prone to practice effects, and may increase a person’s distress and frustration. For example, the PASAT is known to be influenced by practice effects, mathematical ability, and anxiety (Barker-Collo, 2005; Tombaugh, 2006; Tombaugh, Rees, Baird, & Kost, 2004). Additional diagnostic tools could be developed to complement current assessment of cognitive impairment in MS. Speech prosody analysis could represent an ecologically valid method where cognitive ability could be indirectly assessed and monitored from read speech as well as day-to-day interactions (e.g., during interviews between a doctor and a patient; during activities of daily living between a patient and their caregiver). It could be imagined that a trained health
1 2 3 4 5 6 7 8 9 10 11 12 13 14 15 16 17 18 19 20 21 22 23 24 25 26 27 28 29 30 31 32 33 34 35 36 37 38 39 40 41 42 43 44 45 46 47 48 49
personnel could perform these diagnostic procedures at screening and monitoring stages in the clinical environment or in the patient’s habitual environment.
We highlight below the limitations to this investigation.
First, dysarthria was assessed through independent perceptual judgements of the neurologist and the speech therapist as well as by the individuals’ self-report. We cannot exclude, however, that some patients had mild dysarthria that did not reach the threshold as perceived by the pathologists. In the same vein, no formal test was administered to assess potential respiratory problems. Yet, poor respiration, respiratory muscle weakness, and specifically the effect of respiratory physiological issues on speech production have been reported in MS (Martin-Valero, Zamora-Pascual, & Amrenta-Peinado, 2014). We cannot exclude that respiratory difficulties may have an effect on the MS speech timing characteristics too. In addition, while fatigue was minimized by keeping the experiment at a reasonable duration (<1 hr per subject), experienced fatigue was only based on patients’ self-report prior to the beginning of the experiment.
Concerning the neurocognitive aspects of our study, the choice of the battery of tests reflects our hypotheses concerning the controversial role of working memory in speech production planning. However, in future studies, we will include more stringent tests on other aspects of cognition (e.g., verbal fluency) given that working memory might correlate with different cognitive abilities, which are known to affect language production (Becic et al., 2010).
Another limitation includes a statistical difficulty in estimating the effect size. We used mixed models, which are preferable to more classical statistical analyses such as simple regression models or repeated-measures ANOVA for our type of data. However, unlike more traditional analyses, though, they lack an obvious criterion to assess model fit and
effect size (Quen!e & Van Den Bergh, 2004). Although differences in both the
neuropsychological scores and rate measures were in line with Feenaughty et al. (2013) and Rodgers et al. (2013), future studies will be needed to evaluate the clinical meaningfulness of the speech differences.
Finally, even though the scores of our classification analyses are in line with the accuracy levels reported for other neurological diseases, higher levels need to be reached to consider the approach reliable for the screening and monitoring of CI in MS. Moderate performance in our study may be linked to the categorization in MS-CI and MS-NCI groups. Cognitive impairment was defined as a performance of ≤1.5 SD below healthy controls on at least one neuropsychological test. In our study, five speakers of nine were impaired on
one test only. Depending on the criteria chosen to define CI (Arrondo et al., 2016; 26
Labiano-Fontcuberta et al., 2014; Parmenter et al., 2006), these borderline speakers 27
could be classified cognitively impaired or non-cognitively impaired. This makes the classification in distinct groups more difficult.
Conclusion
The present study suggests that speech production planning, as reflected in prosody, is adapted by speakers depending on their cognitive ability. In particular, reduced cognitive resources in MS might be responsible for different reading behaviours, resulting in specific speech timing patterns. The relationship between cognitive ability and speech characteristics in MS also suggests that speech-based technologies could be potentially used for CI screening and monitoring in MS. Future analyses will explore the following: (1) the direct link between brain activity associated with cognitive
1 2 3 4 5 6 7 8 9 10 11 12 13 14 15 16 17 18 19 20 21 22 23 24 25 26 27 28 29 30 31 32 33 34 35 36 37 38 39 40 41 42 43 44 45 46 47 48
impact of specific cognitive deficits (as accounted per individual neuropsychological test) on multiple prosodic measures of speech production planning; and (3) the contribution of cognitive and speech motor control disorders (e.g., dysarthria, respiratory dysfunctions) to speech characteristics through a more extensive and formal assessment of such disorders.
Acknowledgements
This work was supported by a grant from the Agence Nationale de la Recherche to Caterina Petrone for the project ‘Representation and Planning of Prosody’ (ANR-14-CE30-0005-01). We also thank Prof. Richard Reilly for comments on earlier drafts, Laurent Pr!evot for technical help, and Robert Espesser for statistical advice. The work is dedicated to Laurent Reni!e and Giovanni Petrone.
References
28 29
Amato, M. P., Zipoli, V., & Portaccio, E. (2006). Multiple sclerosis-related cognitive changes: A review of cross-sectional and longitudinal studies. Journal of the Neurological Sciences, 245(1), 41–46.
Arrondo, G., Sepulcre, J., Duque, B., Toledo, J., & Villoslada, P. (2010). Narrative speech is impaired in multiple sclerosis. European Neurological Journal, 2(1), 11–40.
Barker-Collo, S. L. (2005). Within session practice effects on the PASAT in clients with multiple sclerosis. Archives of Clinical Neuropsychology, 20(2), 145–152.
Barr, D. J., Levy, R., Scheepers, C., & Tily, H. J. (2013). Random effects structure for confirmatory hypothesis testing: Keep it maximal. Journal of Memory and Language, 68(3), 255–278. Becic, E., Dell, G. S., Bock, K., Garnsey, S. M., Kubose, T., & Kramer, A. F. (2010). Driving impairs
talking. Psychonomic Bulletin & Review, 17(1), 15–21.
Benito-Le!on, J., Manuel Morales, J., Rivera-Navarro, J., & Mitchell, A. J. (2003). A review about the impact of multiple sclerosis on health-related quality of life. Disability and Rehabilitation, 25, 1291–1303.
30
Bobholz, J. A., & Rao, S. M. (2003). Cognitive dysfunction in multiple sclerosis: A review of recent developments. Current Opinion in Neurology, 16(3), 283–288.
Boersma, P., & Weenink, D. (2015). Praat: doing phonetics by computer [Computer program]. Version 5.4.14. Retrieved from http://www.praat.org
Breiman, L., Friedman, J., Stone, C. J., & Olshen, R. A. (1984). Classification and regression trees. ????: CRC Press.
31 32
Cardebat, D., Doyon, B., Puel, M., Goulet, P., & Joanette, Y. (1990). Evocation lexicale formelle et s!emantique chez des sujets normaux. Performances et dynamiques de production en fonction du sexe, de l’^age et du niveau d’!etude. Acta Neurologica Belgica, 90(4), 207–217.
Chiaravalloti, N. D., & DeLuca, J. (2008). Cognitive impairment in multiple sclerosis. The Lancet Neurology, 7, 1139–1151.
Clark, H. H., & Tree, J. E. F. (2002). Using uh and um in spontaneous speaking. Cognition, 84(1), 73–111. Cooper, W. E., & Sorensen, J. (1981). Fundamental frequency in sentence production. ????:
Springer Verlag.
33
Darley, F. L., Brown, J. R., & Goldstein, N. P. (1972). Dysarthria in multiple sclerosis. Journal of Speech, Language, and Hearing Research, 15(2), 229–245.
34
De Jong, N. H., & Wempe, T. (2009). Praat script to detect syllable nuclei and measure speech rate automatically. Behavior Research Methods, 41, 385–390.
Dodge, H. H., Mattek, N., Gregor, M., Bowman, M., Seelye, A., Ybarra, O.,. . . Kaye, J. A. (2015). Social markers of mild cognitive impairment: Proportion of word counts in free conversational speech. Current Alzheimer Research, 12, 513–519.
1 2 3 4 5 6 7 8 9 10 11 12 13 14 15 16 17 18 19 20 21 22 23 24 25 26 27 28 29 30 31 32 33 34 35 36 37 38 39 40 41 42 43 44 45 46 47 48 49