The dynamics of invariant object
recognition in the human visual system
The MIT Faculty has made this article openly available.
Please share
how this access benefits you. Your story matters.
Citation
Isik, L., E. M. Meyers, J. Z. Leibo, and T. Poggio. “The Dynamics of
Invariant Object Recognition in the Human Visual System.” Journal
of Neurophysiology 111, no. 1 (October 2, 2013): 91–102.
As Published
http://dx.doi.org/10.1152/jn.00394.2013
Publisher
American Physiological Society
Version
Author's final manuscript
Citable link
http://hdl.handle.net/1721.1/93890
Terms of Use
Creative Commons Attribution-Noncommercial-Share Alike
The dynamics of invariant object recognition in the human visual system
Leyla Isik1,2,*, Ethan M. Meyers1,3, Joel Z. Leibo1,3 and Tomaso Poggio1,31. Center for Biological and Computational Learning, McGovern Institute for Brain Research, Massachusetts Institute of Technology, Cambridge, MA 02139
2. Computational and Systems Biology Program, Massachusetts Institute of Technology, Cambridge, MA 02139
3. Department of Brain and Cognitive Sciences, Massachusetts Institute of Technology, Cambridge, MA 02139
*Corresponding author: Leyla Isik. Address: Massachusetts Institute of Technology, Bldg. 46-5155, 77 Massachusetts Avenue, Cambridge, MA 02139. Phone: 617-253-0549. Email: [email protected]
Running Title: The dynamics of invariant object recognition in humans
Abstract
The human visual system can rapidly recognize objects despite transformations that alter their appearance. The precise timing of when the brain computes neural representations that are invariant to particular transformations, however, has not been mapped in humans. Here we employ magnetoencephalography (MEG) decoding analysis to measure the dynamics of size- and position-invariant visual information development in the ventral visual stream. With this method we can read out the identity of objects beginning as early as 60 ms. Size- and position-invariant visual information appear around 125 ms and 150 ms, respectively, and both develop in stages, with invariance to smaller transformations arising before invariance to larger transformations. Additionally, the MEG sensor activity localizes to neural sources that are in the most posterior occipital regions at the early decoding times and then move temporally as invariant information develops. These results provide previously unknown latencies for key stages of human invariant object recognition, as well as new and compelling evidence for a feed-forward hierarchical model of invariant object recognition where invariance increases at each successive visual area along the ventral stream.
Introduction
Humans can identify objects in complex scenes within a fraction of a second (Potter, 1976; Thorpe et al., 1996). The main computational difficulty in object recognition is believed to be identifying objects across transformations that change the photoreceptor-level representation of the object, such as position in the visual field, size, and viewpoint (DiCarlo and Cox, 2007). Invariance to these transformations increases along the ventral visual pathway (Logothetis and Sheinberg, 1996; Ashbridge and Perrett, 1998; Rolls, 2000; Rust and Dicarlo, 2010), and the latencies of the visual areas along this pathway (from V1 to IT) are known in the macaque (Nowak and Bullier, 1997;
Schmolesky et al., 1998; Thorpe, 2001; Hung et al., 2005). For instance, position and size invariance is found in macaque IT at about 100 ms. In humans, electroencephalography (EEG) studies have shown that neural signals containing object category information can be found at 150ms or later (Bentin et al., 1996; Thorpe et al., 1996; Kirchner and Thorpe, 2006), however, the timing and steps to develop the invariant object representations that drive this categorization are still unknown.
To understand the timing of invariant object recognition in humans, we use a technique called neural decoding analysis (also known as multivariate pattern analysis, or readout). Neural decoding analysis applies a machine learning classifier to assess what information about the input stimulus (e.g., what image the subject was looking at) is present in the recorded neural data. This technique is widely used in functional magnetic resonance imaging (fMRI) (Haynes and Rees, 2006) and brain-machine interfaces (Donoghue, 2002), and has also been applied to electrophysiology data (Hung et al., 2005; Meyers et al., 2008), EEG data (Philiastides and Sajda, 2006; Philiastides et al., 2006; Ratcliff et al., 2009), and MEG motor (Waldert et al., 2008) and semantic data (Sudre et al., 2012). These analyses, however have only been applied to visual data in a few instances (Guimaraes et al., 2007; Carlson et al., 2011, 2013). MEG provides high temporal resolution, whole-head neural signals, making it a useful tool to study the different stages of invariant object recognition throughout the brain.
Using MEG decoding we could identify the precise times when neural signals contain object information that is invariant to position and size. We also examined the dynamics of these signals with high temporal accuracy and estimated their underlying neural sources. Finally, we compared the timing data uncovered here to a, feed-forward model of invariant object recognition in the ventral stream. These results allow us to draw conclusions about when and where key stages of invariant object recognition
occur, and provide insight into the computations the brain uses to solve complex visual problems.
Materials and Methods
Subjects
Eleven subjects (three female) age 18 or older with normal or corrected to normal vision took part in the experiment. The MIT Committee on the Use of Humans as Experimental approved the experimental protocol. Subjects provided informed written consent before the experiment. One subject (S1) was an author and all others were unaware of the purpose of the experiment.
Experimental Procedure
In this experiment, subjects performed a task unrelated to the images presented. The images were presented in two image blocks and the fixation crossed changed color (red, blue or green) when the first image was presented, then changed to black during the inter-stimulus interval, and then turn a second color when the second image was presented. The subjects’ task was to report if the color of the fixation cross was the same or different at the beginning and end of each two image (Figure 1), and thus helped ensure that they maintained a center fixation while both images were presented (this was also verified for two subjects with eye tracking, see below).
To evaluate the robustness of the MEG decoding methods, three subjects (S1, S2, S3) were each shown a different dataset of images presented at one size and position. Subject S1 was shown 25 scene images (from stanford.edu/fmriscenes/resources.html) presented in the center of the visual field at a size of 4x6 degrees of visual angle, Subject S2 was shown 26 black letters on white background presented in the center of the visual field at a size of 5x5 degrees of visual angle, and Subject S3 was shown 25 isolated objects on a gray background, presented
in the center of the visual field at a size of 5x5 degrees of visual angle (Figure 2, right). To study size- and position-invariance, eight subjects (S4-S11) were shown the same subset of six images from the isolated objects dataset, presented at three sizes (two, four and six-degrees of visual angle in diameter) in the center of the visual field, and three six-degree diameter images shown at three positions (centered, and +/- three degrees vertically).
Images were presented for 48ms with 704 ms inter-stimulus interval. Image order was randomized for each experiment, and each stimulus was repeated 50 times. All images were presented in grayscale on a 48cm x 36 cm screen, 140 cm away from the subject, thus the screen occupied 19 x 14 degrees of visual angle.
Eyetracking
To verify that the above subjects maintain central fixation, eyetracking was performed during MEG recordings for two subjects (S9, S10) with the Eyelink 1000 eye tracker from SR Research. A 9-point calibration was used at the beginning of each experiment. We discarded trials that were greater than two degrees away from the mean eye position, which we used as center to account for calibration errors, or that contained artifacts such as blinks. 6% of trials were rejected for subject S9 and 11% were discarded for subject S10. Discarding data did not have a significant effect on decoding, so the data shown contains all trials for each subject (Figure 3).
MEG recordings and data processing
The MEG scanner used was an Elekta Neuromag Triux with 102 magnetometers at 204 planar gradiometers, and the MEG data was sampled at 1000 Hz. The MEG data were pre-processed using Brainstorm software (Tadel et al., 2011). First the signals were filtered using Signal Space Projection for movement and sensor contamination (Tesche et al., 1995). The signals were also band-pass filtered from 2-100 Hz with a linear phase FIR digital filter to remove external and irrelevant biological noise, and the
signal is mirrored to avoid edge effects of band-pass filtering.
Recent studies have shown that high-pass filtering may lead to artifacts that affect evoked response latencies in MEG/EEG data (Acunzo et al., 2012; Rousselet, 2012). To ensure that the high-pass filter threshold did not affect our results, we
performed one set of analyses with a 0.01 Hz high-pass filter threshold, and observed no noticeable difference in the latency or shape of decoding accuracy.
Decoding analysis methods
Decoding analyses were performed with the Neural Decoding Toolbox (Meyers, 2013), a Matlab package implementing neural population decoding methods. In this decoding procedure, a pattern classifier was trained to associate the patterns of MEG data with the stimulus conditions that were present (the identity of the image shown) when the MEG recording were made. The amount of information in the MEG signal was evaluated by testing the accuracy of the classifier on a separate set of test data. In our analyses, data from both magnetometers and gradiometers were used as features that were passed to the pattern classifier (we found both types of sensors had information that contributed to increasing the decoding performance). We also averaged the MEG in 5 ms non-overlapping bins (i.e. each sensor’s activity was averaged within each 5 ms time window) prior to beginning the decoding procedure.
All decoding analyses were performed with a cross-validation procedure where the classifier is trained on a subset of the data and then the classifier’s performance is evaluated on the held-out test data. Our recordings consisted of 50 repetitions of each stimulus condition (see ‘Experimental Procedures’ above). For each decoding run, data from these 50 trials were divided into 5 sets of 10 trials, and the data from each set of 10 trials were averaged together. We were also able to decode without this averaging (using single trials), but found that averaging trials led to an increase in the signal to noise ratio of our results (see Figure 3). This gave rise to five cross-validation splits.
The classifier was trained on 4 of these splits (80% of the data) and then tested on the remaining split (20% of the data), and the procedure was repeated 5 times leaving out each cross-validation split.
In each training phase of the decoding procedure, the mean and standard deviation of the each sensor over the entire time series was used to Z-score normalize the data. Additionally, an analysis of variance (ANOVA) test was applied to the training data to select the 25 sensors at each time point that are most selective for image identity (those sensors with the lowest p-values determined by an F-test). The test data was then z-score normalized using the mean and standard deviation learned from the training data, and only the top 25 sensors that had the lowest p-values were used when testing the classifier. The pattern of the most selected sensors was very localized to the occipital portion of the sensor helmet beginning 60ms after stimulus onset (Supplemental Video 1).
Decoding analyses were performed using a maximum correlation coefficient classifier. This classifier computes the correlation between each test vector and a vector . that is created from taking the mean of the training vectors from class i. The test point is assigned the label of the class of the training data with which it is maximally correlated. This can be formulated as:
The classification accuracy is reported as the percentage of correct trials classified in the test set averaged over all cross-validation splits. This decoding procedure was repeated for 50 decoding runs with different training and test cross-validation splits being generated on each run, and the final decoding accuracy reported is the average decoding accuracy across the 50 runs. For more details on the decoding
€
x
*€
x
_i€
x
*€
i
*€
i
*= argmax
icorr(x
*, x
i(
)
procedure, and to view the code used for these analyses, please visit http://www.readout.info.
The decoding parameters, including number of stimulus repetitions, number of trials averaged, number of sensors used, bin width, and classifier used in decoding were chosen to maximize a signal to noise ratio (SNR), defined as the peak decoding accuracy divided by the standard deviation during the baseline period. Using data from the initial 3 subjects on the 25 image discrimination tasks (Figure 2), we found good SNR values for most of these parameter settings (Figure 3A-E). The results showed 50 stimulus repetitions were more than sufficient to provide good SNR, and that averaging 10 trials and selecting 25 features led to a clear increase in decoding performance. In addition, small bin size not only led to an increase in decoding performance, but also allowed us to interpret our results with finer temporal resolution. Next, we performed the decoding analysis using several different classifiers (correlation coefficient, support vector machine, and regularized least squares with linear and Gaussian kernels), and found that classifier choice did not affect decoding accuracy (Figure 3F). Consequently, in order to have the clearest results possible to examine the effects of interest, we use 50 stimulus repetitions, the average 10 trials, the 25 most selective features, 5 ms bin width, and a correlation coefficient classifier for subsequent invariance analyses.
Significance criteria
We assessed significance using a permutation test. To perform this test, we generated a null distribution by running the full decoding procedure 200 times using data with randomly shuffled labels with 10 cross-validation split repetitions used on each run. Decoding results performing above all points in the null distribution for the corresponding time point were deemed significant with p<0.005 (1/200). The first time decoding reached significantly above chance (“significant time”) was defined as the point when accuracy was significant for two consecutive time bins. We chose this significance
criterion was selected such that no spurious correlations in the baseline period were deemed significant. This criterion was met for all decoding experiments, except one subject in one position-invariance condition (S7, train down/test up condition) whose data was still included in our analyses.
Significance testing with normalized decoding magnitudes
To examine the effect of decoding magnitude on significance time, we also performed a procedure to approximately normalize the peak decoding accuracy across trials. We then repeated this significance testing to see the latencies across different conditions with normalized magnitudes. To normalize the decoding magnitude for different conditions, we included less data for those conditions with higher decoding accuracy: if the peak decoding magnitude was above .7 for one condition or pair of conditions (in the case of invariance conditions, the average of each train and test pair was considered) we performed decoding with 20% of data collected, if the peak decoding magnitude was between 0.6-0.7 we performed decoding with 30% of data collected, and if the peak decoding magnitude was between 0.44-0.6 we performed decoding with 50% of the data collected. After this normalization procedure, peak decoding accuracy for all conditions fell within the same narrow range of 33%-43%. Decoding analysis was still performed with five cross-validation splits, and all the data in each split (3 trials for those conditions using 30% of data, and 5 trials for those conditions using 50% of data) was still averaged at each cross validation run. All other decoding parameters were kept the same. This procedure adjusted the peak decoding magnitudes for each condition so they were between the 0.33-0.44 desired range.
Source localization
We used the minimum norm estimate (MNE) distributed source modeling method, which finds the set of sources along the cortical surface that minimizes the total power of the sources (Hämäläinen et al., 2010), for three subjects (S9-S11) using
Brainstorm software. MNE was performed using the cortical orientation constraints and with the default SNR value (signal-to-noise ratio of power of data) of 3. The sources were estimated on the colin27 standard brain template (Holmes et al., 1998). (Head positions for S1-S8 were not measured in the scanner, so they were excluded from this analysis.) A head model was generated for each subject’s head position using the overlapping spheres method. A full noise covariance matrix from the 233 ms baseline period of 1530 visual presentations was generated for each subject, and used in the MNE algorithm. The source estimates were evaluated by simulating the sensor activity from the source estimates, and comparing these simulated measurements with the actually MEG measurements. Goodness of fit of the source estimate was evaluated as
(Hämäläinen et al., 1993). In the case of MNE,
goodness of fit reflects the effect of the regularization term (as without this term,
goodness of fit would be 1). Goodness of fit values for the three subjects from
stimulus onset to 500 ms post stimulus onset were 0.92, 0.96, and 0.96, (this
value was higher than the goodness of fit values in the 233 ms baseline period
before stimulus onset, which were 0.69, 0.90, and 0.87).
Cortical modeling (HMAX)
To model the MEG invariant decoding results, we tested the HMAX model (Serre et al., 2007). The model consists of alternating layers of simple units and complex units. Simple cells perform a template matching operation between its inputs and stored templates (in the first layer these templates are oriented Gabor functions, similar to those found in primary visual cortex) to build selectivity, and complex cells perform a pooling operation over local regions (here we use max pooling) to build invariance. HMAX was implemented using the Cortical Network Simulator GPU-based framework
€
g = 1 −
(
b
i− ˆ
b
i)
i=1 n∑
2b
i2 i=1 n∑
(Mutch et al., 2010). The HMAX parameters used were the same as in (Serre et al., 2007). 1000 model units were randomly sampled at each model layer, and used as the feature vector for classification. As in the decoding procedure, a correlation coefficient classifier was used to classify the same image across two different sizes or positions, at each model layer. This procedure was repeated ten times and results were averaged.
Results
Fast and robust readout for different types of stimuli
To examine whether we could extract visual information from MEG signals, we first decoded the identity of the presented images. Three subjects were each shown a different stimulus set, which consisted of either images of scenes, images of letters, or images of isolated objects (Figure 2a-c, right), while MEG signals were recorded from 306 sensors covering the full head. The stimulus sets each had 25 images, and each image was shown 50 times to each subject. We trained a correlation coefficient classifier to discriminate between the different images based on the subject’s MEG data. The MEG signals were averaged over 5ms time bins, and data from 10 different trials were averaged together. The classifier was trained and tested separately on each time bin and the 25 most selective sensors were chosen in training for each time point (see Materials and Methods). These decoding parameters were chosen maximize signal to noise in the recordings (Figure 3).
For each image set and subject, we could reliably decode the identity of the 25 different images in the set. Decoding was significantly above chance (based on a p<0.005 permutation test) from 60-335 ms after stimulus presentation for scene images, 70-325 ms for letter images, and 60-370 ms for object images (Figure 2a-c, left). The peak decoding accuracies ranged from 38-70% correct (chance accuracy is 4%),
showing that we were able to reliably extract information from MEG signals from a large range of different stimulus sets.
Timing of size and position invariant visual representations
Once we established that we could decode basic visual information from MEG signals, we then tested whether we could detect visual representations that are invariant to image transformations. To do this we presented a subset of six of the isolated object images (shown in Figure 2c, right in blue box) at various sizes and positions to eight different subjects. We presented large images (6x6 degrees of visual angle) centered and in the upper and lower halves of the visual field (+/- 3 degrees vertically), and presented centered images at medium and small sizes (4x4 and 2x2 degrees of visual angle, respectively). To make sure any invariant information we extracted was not due to eye-movements we used a brief presentation time of less than 50 ms and randomized position and size of the image. Humans require at least 80-100 ms to make a saccadic eye movement (Fischer and Ramsperger, 1984; Busettini et al., 1997), thus presenting images for only 50ms in a random position ensured subjects would not be able to saccade to peripheral images. Eye position was also measured for two of the eight subjects (see Materials and Methods).
As a first check to make sure that we could extract similar visual information from this new stimulus set, we decoded the identity of the images at each of the five different position and size conditions (Figure 4a). The results showed a similar time course as the larger image sets in (Figure 2b), indicating that our initial results generalized to both the new stimulus set and the larger number of subjects.
We next sought to detect position-invariant information by training the classifier on data from images presented at one position and testing it on images presented at a second position. This technique allowed us to detect when common neural representations arose between images of the same object presented at two different
positions - i.e., representations that are invariant to position. Using this method, we detected position invariant visual signals for the six different position comparisons beginning at 150 ms on average (Figure 4b). Similarly, to detect size-invariant visual signals, we trained the classifier on data from images presented at one size and tested it on data from images presented at a second size for six different size comparison cases (Figure 4c). On average, size-invariant information was first detected around 125 ms. These results provide previously unknown human latencies for size and position invariant object recognition, which are consistent across subjects. Additionally they uncover a potential latency difference between size and position invariant processing, which may have interesting implications for how and where in the visual pathway these two types of transformations are processed.
Varying extent of size and position invariance
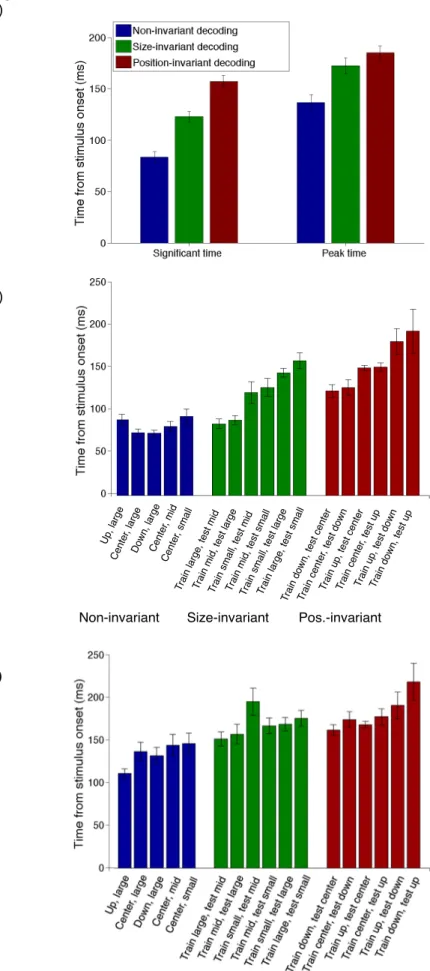
To quantify when non-invariant, position-invariant and size-invariant information rises and peaks, we looked at the first time decoding rose significantly (p<0.005 permutation test) above chance for two consecutive 5ms time bins, and the time when decoding reached peak performance. The non-invariant information appeared at 80 ms and peaked at 135 ms, on average, which was before the size-invariant information (125 ms appearance, 170 ms peak) and the position-invariant information (150 ms appearance, 180 ms peak) (Figure 5a).
We also looked at the individual invariant decoding conditions, which showed that position and size invariant information developed in stages, with the decoding signals from the smaller transformed cases rising before signals from the larger transformed cases (Figure 5b). The three-degree position-invariance cases (lower/centered and centered/upper) both developed before the six-degree position-transformation cases (lower/upper). A similar order was true of the size invariant cases with the 2.25x area increase appearing first (larger/middle), followed by the 4x increase
(middle/small), and finally the 9x size increase (large/small). A similar trend is true when you examine peak times, however, there is much less spread in these latencies as most signals tend to peak around the same time (Figure 5c). This modular development indicates that size and position invariant signals are being computed in stages by a hierarchical system that increases invariance in a feed forward manner.
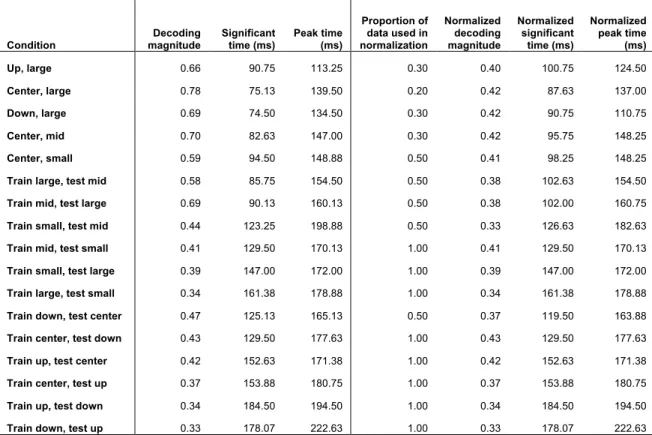
An alternative possibility is that the difference in decoding latencies is an artifact of the different magnitudes of decoding accuracy across conditions. In general, conditions with higher peak decoding accuracy also had shorter latency, and its possible that these conditions could surpass the level of noise sooner thus with significance testing appear to have shorter latencies only due to their higher magnitude. To test this possibility, we normalized the decoding magnitudes for different decoding conditions by including only a fraction of the MEG data for the conditions with higher accuracy (Table 1). By including 20-50% of the data for certain conditions (please see Materials and Methods) we were able to approximately normalize the decoding magnitudes across condition. Importantly, there was little effect on decoding latency, and the decoding order shown in Figure 5 still held for normalized decoding magnitudes.
Combined size- and position-invariance
Using these results, we were also able to look at combined size- and position-invariant visual processing, by performing decoding across the two types of transformations: training with centered, large images and testing with small or medium images presented in the upper and lower halves of the visual field, and vice versa (Figure 6). In two cases (center/small versus up/large, and center/small versus down/large, Figure 6a-b), the corresponding size-invariant and position-invariant decoding had similar magnitude, but in the two other cases (center/medium versus up/large, and center/medium versus down/large, Figure 6c-d), the corresponding size-invariant decoding occurred much earlier and with larger magnitude than the position
invariant decoding. In all four cases the combined size- and position-invariant decoding had similar magnitude and latency to the corresponding position-invariant decoding. This suggests that the slower and lower accuracy transformation, in this case position, limits combined size- and position-invariant decoding, and thus visual processing.
Dynamics of decoded signals
We examined the similarity in the decoded signals at different times by performing a temporal-cross-training analysis (TCT analysis) (Meyers et al., 2008; Meyers, 2013). In TCT analysis, a classifier is trained with data from one time point, and then tested on data from different trials that were taken either from the same time point or from a different time point. This method yielded a matrix of decoding accuracies for each training and test time bin, where the rows of the matrix indicate the times when the classifier was trained, and the columns indicate the times when the classifier was tested. The diagonal entries of this matrix are the same results as plotted in Figure 1, where the classifier was trained and tested with data from the same time points, and again show that there is high decoding accuracy from about 70ms-300ms after stimulus onset.
Additionally, this new analysis showed very low classification accuracy when the classifier was trained and tested at different time points (off-diagonal elements), indicating that different patterns of MEG sensor activity contained object information at different time points in an experimental trial (Figure 7a). The same pattern was true for a position-invariant case (Figure 7b) and a size-invariant case (Figure 7c) with the six-object image. The width of the well-decoded window along the diagonal is 20-50 ms wide, indicating that the neural signal is highly dynamic. Further analysis showed that these dynamics are not due to information moving to different sensors, but instead to the information in a given set of sensors changing over time (Figure 7d). It is important to note that each sensor coarsely samples several brain areas, so these results do not speak directly to the specific regions driving the decoding.
Neural sources underlying sensor activity and classification
To understand which brain areas were behind the high decoding performance, we used a distributed source localization algorithm to determine where the primary neural sources are located at key decoding times (see Materials and Methods). We measured head position in the scanner for three subjects during the six-image invariance experiment. We examined the sources for images presented at each individual position and size, as well as for an average of all image presentations across all positions and sizes, shown in (Figure 8). Sources for the individual conditions looked similar to the overall average.
When identity-specific information first appears in most subjects, at 70ms, the strongest neural sources were localized in the occipital lobe near early visual areas (Figure 8a). When both size and position invariant information is present in the signal, at 150ms, the neural sources were located more temporally, further down the ventral visual stream (Figure 8b). The strongest sources at each time point are a good indication of the brain region carrying visual information and indicate that very occipital areas are driving early decoding, while later visual areas contain size and position invariant visual information.
Invariant recognition with a cortical model
To make sure that low level visual features could not account for the invariance results, we tested a hierarchical model of object recognition, HMAX (Serre et al., 2007), on our six-object dataset to compare with our experimental invariance results. The model, which is inspired by Hubel and Wiesel’s findings in V1 (Hubel and Wiesel, 1962), consists of alternating layers of simple cells that build selectivity and complex cells that build invariance. Each stage of the model yields a set of features that models the representations contained in different brain regions in the ventral visual processing stream. To test whether features from different stages of the model could account for
the invariant decoding results, we applied the model to the same six-object image set presented at the same sizes and positions and then applied a classification analysis to the different layers of model outputs that was analogous to MEG invariance analyses.
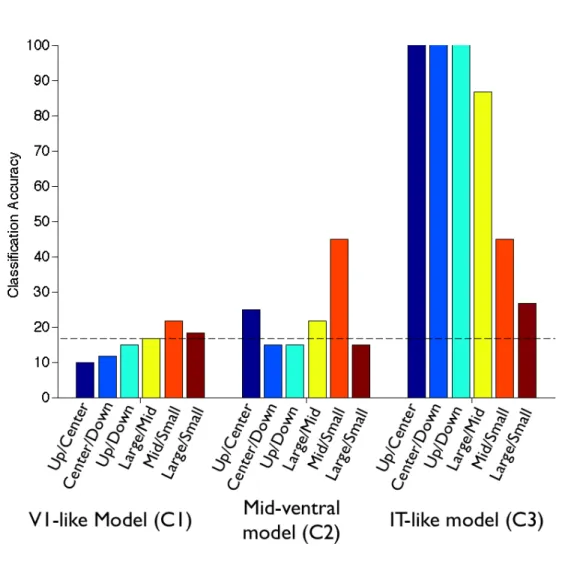
The results showed that a V1-like model, consisting of the first pair of simple/complex cell layers, was not able to achieve above-chance performance on the size and position invariance-decoding task. A mid-level visual model, consisting of an additional layer of simple/complex cells, however, could classify smaller transformed images with above chance performance. The final model output, which modeled cells in anterior inferior temporal cortex and employed global tuning/pooling, was able to classify the transformed images with high performance for each invariance case (Figure 9). The model results show a sequential order of invariance (smaller transformations before larger transformations), which is similar to the MEG experimental results. This data provides further evidence that a feed forward, hierarchical model can account for the timing of experimental invariance results, suggesting that the timing may be directly related to the location of the invariance computations.
Discussion
While it is widely believed that the ventral visual processing stream is involved in object recognition, how this pathway builds up representations that are invariant to visual transformations is still not well understood. Here we addressed this issue by comparing the time course of invariance to two types of transformations, position and size, in the human brain. Using MEG decoding we were able to see the temporal flow of invariant information much more clearly than was possible using conventional analyses.
We detected image identity information as early as 60 ms, and size and position-invariant visual signals at 125 and 150 ms, respectively. The timing of the initial identity decoding is similar to the latency of macaque V1, which is around 60 ms. Additionally,
the timing for size and position invariant information is close to the latencies of size and position-invariant signals in macaque IT, which first occur around 100 ms (Hung et al., 2005). The slightly longer latencies seen in our study are likely due to the fact that human brains are larger, which is believed to lead to longer neural latencies (Thorpe, 2001). Unlike previous physiology studies of invariant object recognition, which are limited in the number of brain regions they can record from, we were able to see a clear latency difference between the initial identity signal and size and position invariant information.
The source localization results showed that neural activity moved to more ventral regions when invariant information developed at 150 ms (Figures 8). While one potential criticism is that there is a fair amount of variation in the sources across subjects, and source localization algorithms taking into consideration structural and functional MRI data may provide a finer picture of where in the brain invariance computations occur (Hämäläinen et al., 2010), these results do show a clear progression in each subject where activity appears to move down the ventral stream. These source localization results combined with timing data and our results showing that it was not possible to decode invariant information from a V1-like model (Figure 9), all suggest that early visual areas are driving the initial identity decoding, and later visual areas are computing the invariant representations.
The timing between neural events recorded through EEG/MEG and behavioral reaction times for visual tasks has not always been consistent in the literature. For example, humans can distinguish between scenes with or without animals with saccades that are as fast as 120 ms (Kirchner and Thorpe, 2006), yet the earliest differences between EEG event related potentials (ERPs) on this task were not observed until 150ms after stimulus onset (Thorpe et al., 1996). Similarly, the N170 ERP (a negative potential observed in certain channels at 170 ms) response to faces (Bentin et al., 1996)
also occurs late relative to behavioral reaction times and latencies in the macaque. A reason for this discrepancy might be that ERP analysis is too coarse a method to capture the earliest components of object related information. By using decoding based methods, we are able to see discriminative visual signals at significantly earlier latencies in humans, also see (Liu et al., 2009; Carlson et al., 2011; Isik et al., 2012). In the study by Carlson et al., the authors found similar latencies for position-invariant MEG decoding using a categorization task. They were able to categorize faces, cars, and face and car textures as early as 105-135 ms post-stimulus onset. Interestingly, in contrast with our results, Carlson et al. did not detect a difference in latency between their position-invariant and non-position-invariant decoding conditions. This discrepancy may due to the fact that the authors used a categorization task, which requires generalization (unlike our identification task) and may occur when the neural signals already show a certain degree of invariance. A recent study by the same group shows that more abstract categorization has a longer decoding latency (Carlson et al., 2013), supporting this explanation. With our experimental paradigm, we were able to see a clear range of latencies from the initial non-invariant identity signal to size- and position-invariant neural signals, which help to frame previous human timing results.
Our timing results also showed that both size and position invariance developed in a sequential order, meaning that smaller transformations were decoded before larger transformations. This sequential development is consistent with a hierarchical, feed-forward visual model where receptive fields pool at each successive visual layer to first create local invariance and then build invariance over a larger area. We tested this theory with a biologically inspired object recognition system, which employs this feed-forward hierarchical architecture, known as HMAX (Serre et al., 2007) (Figure 9). HMAX performance had a similar trend to the order of the MEG experimental results: an early visual model could not decode stimuli invariant to size or position with above chance
accuracy, a mid-level visual model could decode small transformations with above chance accuracy, and an IT-like model could decode all transformations with above chance accuracy. These results give new and compelling evidence that such a feed-forward hierarchy is a plausible model for invariant object recognition in the human ventral stream.
The order and timing information presented here have valuable applications not only for constraining models of the visual system, but also for answering more complex algorithmic questions about invariant object recognition, for example: do different types of invariance arise at different times in the ventral visual pathway? These results allow us to directly compare varying extents of these two transformations, position and size. The shorter latencies for size-invariant decoding, suggest that size-invariance may begin to develop before position-invariance. However, it was not the case that all size-invariance cases arose before position-invariant cases. The timing difference between the two types of invariance is being driven largely by the early rise of the smallest size-invariant shift (between 4 degree and 6 degree images). Additionally, it is difficult to directly compare the “extent” of two different types of transformations. For example, how does a 2-degree linear size increase compare to a 2-degree translation? Our results, however, do suggest that both size and position invariance develop in several areas along the ventral stream and appear significantly later than the initial identity signal.
The MEG decoding methods outlined in this study are a powerful tool to examine the dynamics of visual processing. Unlike conventional methods examining evoked responses, which require recordings from 50 or more stimulus repetitions to be averaged, decoding analysis is sensitive enough to detect visual signals by averaging only a few trials, or even from single trial data (Figure 2). The results and decoding methods presented here serve as a framework to examine an extended range of
transformations, which should help lead to a real computational understanding of invariant object recognition.
Acknowledgements: This research was sponsored by grants from Defense Advanced Research Planning Agency (IPTO and DSO), National Science Foundation (NSF-0640097, NSF-0827427), AFSOR-THRL (FA8650-05-C-7262). Additional support was provided by: Adobe, Honda Research Institute USA, King Abdullah University Science and Technology grant to B. DeVore, NEC, Sony and especially by the Eugene McDermott Foundation. L.I. is supported by a NSF Graduate Research Fellowship under grant number 0645960. We would like to thank the McGovern Institute for Brain Research for their support, and providing use of the MEG facilities. We would also like to thank D. Pantazis and D. Baldauf for their help with MEG setup and data analysis, and R. Desimone, G. Kreiman, D. Pantazis and D. Baldauf for comments on the manuscript.
References
Acunzo DJ, Mackenzie G, van Rossum MCW. Systematic biases in early ERP and ERF components as a result of high-pass filtering. Journal of neuroscience methods 209: 212–8, 2012.
Ashbridge E, Perrett D. Generalizing across object orientation and size. In: Perceptual Constancy: Why Things Look as They Do. Cambridge University Press, 1998, p. 560. Bentin S, Allison T, Puce A, Perez E, McCarthy G. Electrophysiological Studies of Face Perception in Humans. Journal of cognitive neuroscience 8: 551–565, 1996.
Busettini C, Masson GS, Miles FA. Radial optic flow induces vergence eye movements with ultra-short latencies. Nature 390: 512–5, 1997.
Carlson T, Tovar DA, Alink A, Kriegeskorte N. Representational dynamics of object vision: The first 1000 ms. Journal of vision 13: 1–, 2013.
Carlson TA, Hogendoorn H, Kanai R, Mesik J, Turret J. High temporal resolution decoding of object position and category. Journal of vision 11, 2011.
DiCarlo JJ, Cox DD. Untangling invariant object recognition. Trends in cognitive sciences 11: 333–41, 2007.
Donoghue JP. Connecting cortex to machines: recent advances in brain interfaces. . Fischer B, Ramsperger E. Human express saccades: extremely short reaction times of goal directed eye movements. Experimental Brain Research 57, 1984.
Guimaraes MP, Wong DK, Uy ET, Grosenick L, Suppes P. Single-trial classification of MEG recordings. IEEE transactions on bio-medical engineering 54: 436–43, 2007. Hämäläinen M, Hari R, Ilmoniemi RJ, Knuutila J, Lounasmaa O V.
Magnetoencephalography—theory, instrumentation, and applications to noninvasive studies of the working human brain. Reviews of Modern Physics 65: 413–497, 1993.
Hämäläinen MS, Lin F-H, Mosher JC. Anatomically and Functionally Constrained Minimum-Norm Estimates : MEG: An Introduction to Methods. In: MEG: An Introduction to Methods. 2010.
Haynes J-D, Rees G. Decoding mental states from brain activity in humans. Nature reviews. Neuroscience 7: 523–34, 2006.
Holmes CJ, Hoge R, Collins L, Woods R, Toga AW, Evans AC. Enhancement of MR images using registration for signal averaging. Journal of computer assisted tomography 22: 324–33, 1998.
Hubel DH, Wiesel TN. Receptive fields, binocular interaction and functional architecture in the cat’s visual cortex. The Journal of physiology 160: 106–54, 1962.
Hung CP, Kreiman G, Poggio T, DiCarlo JJ. Fast readout of object identity from macaque inferior temporal cortex. Science (New York, N.Y.) 310: 863–6, 2005. Isik L, Meyers EM, Leibo JZ, Poggio T. Preliminary MEG decoding results. MIT-CSAIL-TR-2012-010,CBCL-307. .
Kirchner H, Thorpe SJ. Ultra-rapid object detection with saccadic eye movements: visual processing speed revisited. Vision research 46: 1762–76, 2006.
Liu H, Agam Y, Madsen JR, Kreiman G. Timing, timing, timing: fast decoding of object information from intracranial field potentials in human visual cortex. Neuron 62: 281–90, 2009.
Logothetis NK, Sheinberg DL. Visual object recognition. Annual review of neuroscience 19: 577–621, 1996.
Meyers EM, Freedman DJ, Kreiman G, Miller EK, Poggio T. Dynamic population coding of category information in inferior temporal and prefrontal cortex. Journal of neurophysiology 100: 1407–19, 2008.
Mutch J, Knoblich U, Poggio T. CNS: a GPU-based framework for simulating cortically-organized networks. MIT-CSAIL-TR-2010-013. .
Nowak L, Bullier J. The Timing of information transfer in the visual system. In: Cerebral Cortex: Extrastriate Cortex in Primates, edited by Rockland K, Kaas J, Peters A. Plenum Publishing Corporation, 1997, p. 870.
Philiastides MG, Ratcliff R, Sajda P. Neural representation of task difficulty and decision making during perceptual categorization: a timing diagram. The Journal of neuroscience : the official journal of the Society for Neuroscience 26: 8965–75, 2006. Philiastides MG, Sajda P. Temporal characterization of the neural correlates of
perceptual decision making in the human brain. Cerebral cortex (New York, N.Y. : 1991) 16: 509–18, 2006.
Potter MC. Short-term conceptual memory for pictures. Journal of experimental psychology. Human learning and memory 2: 509–22, 1976.
Ratcliff R, Philiastides MG, Sajda P. Quality of evidence for perceptual decision making is indexed by trial-to-trial variability of the EEG. Proceedings of the National Academy of Sciences of the United States of America 106: 6539–44, 2009.
Rolls ET. Functions of the primate temporal lobe cortical visual areas in invariant visual object and face recognition. Neuron 27: 205–18, 2000.
Rousselet GA. Does Filtering Preclude Us from Studying ERP Time-Courses? Frontiers in psychology 3: 131, 2012.
Rust NC, Dicarlo JJ. Selectivity and tolerance (“invariance”) both increase as visual information propagates from cortical area V4 to IT. The Journal of neuroscience : the official journal of the Society for Neuroscience 30: 12978–95, 2010.
Schmolesky MT, Wang Y, Hanes DP, Thompson KG, Leutgeb S, Schall JD, Leventhal AG. Signal Timing Across the Macaque Visual System. J Neurophysiol 79: 3272–3278, 1998.
Serre T, Oliva A, Poggio T. A feedforward architecture accounts for rapid
categorization. Proceedings of the National Academy of Sciences of the United States of America 104: 6424–9, 2007.
Sudre G, Pomerleau D, Palatucci M, Wehbe L, Fyshe A, Salmelin R, Mitchell T. Tracking neural coding of perceptual and semantic features of concrete nouns. NeuroImage 62: 451–63, 2012.
Tadel F, Baillet S, Mosher JC, Pantazis D, Leahy RM. Brainstorm: a user-friendly application for MEG/EEG analysis. Computational intelligence and neuroscience 2011: 879716, 2011.
Tesche CD, Uusitalo MA, Ilmoniemi RJ, Huotilainen M, Kajola M, Salonen O. Signal-space projections of MEG data characterize both distributed and well-localized neuronal sources. Electroencephalography and Clinical Neurophysiology 95: 189–200, 1995. Thorpe S, Fize D, Marlot C. Speed of processing in the human visual system. Nature 381: 520–2, 1996.
Thorpe SJ. NEUROSCIENCE: Seeking Categories in the Brain. Science 291: 260–263, 2001.
Waldert S, Preissl H, Demandt E, Braun C, Birbaumer N, Aertsen A, Mehring C. Hand movement direction decoded from MEG and EEG. The Journal of neuroscience : the official journal of the Society for Neuroscience 28: 1000–8, 2008.
Figure 1
Figure 1: Experimental task. In order to keep their gaze at the center of the screen, the subjects’ task was to report if the color of the fixation cross was the same or different at the beginning and end of each two image. a) Illustrates a trial where the fixation cross is the same color (red) at beginning and end, and b) illustrates a trial where the fixation cross changes color (from red to green) between beginning and end. The fixation cross changed color when the images were on the screen and was black between stimulus presentations.
Different
Same
50 ms
700 ms
50 ms
Figure 2
a)
b)
c)
Figure 2: Decoding accuracy versus time for three different image sets. (a) 25 scene images (from stanford.edu/fmriscenes/resources.html), presented at 4x6 degrees
−400 −300 −200 −100 0 100 200 300 400 500 0 5 10 15 20 25 30 35 40 Time (ms) Classification Accuracy −300 −200 −100 0 100 200 300 400 500 0 10 20 30 40 50 60 Time (ms) Classification Accuracy −300 −200 −100 0 100 200 300 400 500 0 10 20 30 40 50 60 70 80 Time (ms) Classification Accuracy
(b) 25 black letters on white background, presented at 5x5 degrees (c) 25 isolated objects on a gray background, presented at 5x5 degrees (thumbnail images in blue box indicate the subset used in subsequent invariance experiments). Time zero corresponds to the time of stimulus onset. Each image set was run on a separate date with a separate subject. Please note the change in scale for classification accuracy (y-axis) across the three sub-plots. The horizontal line indicates chance performance. The bars at the bottom of each plot indicate when decoding was significantly above chance (p<0.005, permutation test).
Figure 3
a) b)
c) d)
e) f)
Figure 3: Parameter optimization. The effect of a) number of stimulus repetitions used in decoding (using single trial data, he top 25 features, and 5 ms bin width), b) number of trials averaged (using 50 stimulus repetitions, the top features, and 5 ms bin width), c)
number of sensors used in decoding (using 50 stimulus repetitions, the average of 10 trials, and 5 ms bin width), and d) bin width (using 50 stimulus repetitions, the average of 10 trials, and the top 25 sensors) on signal to noise ratio (SNR). SNR is measured by the peak decoding height divided by the baseline noise (standard deviation of the
decoded signal before stimulus onset). SNR data is averaged for three subjects (S1-S3) on three different data sets (25 scenes, 26 letters, and 25 isolated objects), and the error bars show standard error from the mean.
e) The combined effects of different number of trials averaged and number of sensors used in decoding on decoding accuracy versus time for one subject (S1). f) The effect of classifier on decoding accuracy versus time for one subject (S1).
Train Test
Figure 4
a) b)
c) d)
Figure 4: Assessing position and size invariant information. Six different images of isolated objects (Figure 2c, right in blue box) were presented at three different positions (centered, and +/- three degrees vertically) and three different sizes (two, four and six degrees in diameter). The different training and test conditions are illustrated using a bowling ball-like object, one of the six images used in this experiment. Classification accuracy versus time is plotted for a) average of subjects’ results to five non-invariant conditions (illustrated below plot); b) average of subjects’ results to six position-invariant
Train Test
conditions; c) average of subjects’ results to six size-invariant conditions; d) direct comparison of the non-invariant, position-invariant, and size-invariant results that were calculated by averaging all the individual results together. Please note the change in scale for classification accuracy (y-axis) across the four sub-plots. The horizontal line indicates chance performance. Error bars represent the standard error across mean accuracy per subject. In (a)-(c) the bars below each plot indicate when decoding was significantly above chance (p<0.005, permutation test) for four (thinnest line), six (middle line), or all eight (thickest line) subjects for each condition, indicated by the color of the bar.
Figure 5 a) b) c) Up, larg e Cen ter, larg e Dow n, la rge Cen ter, mid Cen ter, sma ll Tra in d ow n, te st ce nter Tra in ce nter , test dow n Tra in u p, te st ce nter Tra in ce nter , test up Tra in u p, te st d ow n Tra in d ow n, te st u p Tra in la rge, test mi d Tra in mi d, te st la rge Tra in sma ll, te st mi d Tra in mi d, te st sma ll Tra in sma ll, te st la rge Tra in la rge, test sma ll
Non-invariant Size-invariant Pos.-invariant
0 50 100 150 200 250
Figure 5: Significant and peak invariant decoding times. Significant and peak decoding times averaged across subjects for (a) the mean of all non-invariant, position-invariant and size-position-invariant conditions, (b) significant decoding time for each individual condition, and (c) peak decoding time for each individual condition. Significant decoding times indicate the first time decoding is significantly above chance (p<0.005, permutation test) for two consecutive 5ms time bins. Peak decoding time is the maximum decoding performance over the entire time window. Error bars represent standard error across subjects.
Figure 6
a) b)
c) d)
Figure 6: Assessing combined size and position-invariant information. Six different images of isolated objects (Figure 2c, right in blue box) were presented at three different positions (centered, and +/- three degrees vertically) and three different sizes (two, four and six degrees in diameter). The different training and test conditions are illustrated using a bowling ball-like object, one of the six images used in this
experiment. Classification accuracy versus time is plotted for individual size-invariant (red, blue traces), position-invariant (green, cyan traces) and the corresponding
combination of size and position-invariant (pink, yellow traces) decoding in each subplot (a-d). Please note the change in scale for classification accuracy (y-axis) across the three sub-plots.
Figure 7
a) b)
c) d)
Figure 7: Dynamics of object decoding. Temporal cross-training matrices showing the decoding results for training the classifier at one point in time and testing the classifier at a second point in time. The color bar on right indicates classification accuracy for one subject on: (a) six-object images as in Figure 2 (presented three degrees below center), (b) six-object images decoded invariant to position (train at center, test at three degrees below), and (c) six-object images decoded invariant to size (train at 4 degree diameter, test at 6 degree diameter). High decoding accuracies are only achieved when the classifier is trained and tested within the same time window, indicating that the object information is contained in unique patterns across the sensors at different time points. d) Matrix of classification accuracy (for same subject on six-object dataset) with 25 sensors
selected at one time (y-axis), and decoding (training and testing) performed at all other times using these sensors (x-axis). Color bar on right indicates classification accuracy for the experiment.
Figure 8
a) 70 ms
b) 150 ms
Figure 8: Source localization at key decoding times. Source localization results for MEG signals of three subjects (left, center, right) on a standard cortex at (a) 70 ms, when decoding first rises significantly above chance, and (b) 150 ms, when position and size invariant decoding both rise significantly above chance. Ventral view is presented. Color bar at right indicates magnetic poles strength in picoAmpere-meters. Sources are thresholded to only show source activity that is at least 30% of maximal activation (see Methods).
Subject 1
Subject 2
Subject 3
! 140 100 60 20 ! 45 30 15 0 ! 300 200 100 0
Figure 9
Figure 9: Invariant image classification with a cortical model. Classification accuracy for various stages of HMAX model output for three position invariance cases (images in the upper-half of the visual field and centered, centered and lower-half of the visual field, and upper and lower-halves of the visual field) and three size invariance cases (large and mid-size images, mid-size and small images, and large and small image). Each model layer (C1, C2, C3) consists of an additional pair of simple and complex cell layers that perform tuning and pooling operations. See (Serre et al., 2007) for model and parameter details. Dashed horizontal line (at 16.67% accuracy) indicates chance performance.
Condition magnitude Decoding Significant time (ms) Peak time (ms) Proportion of data used in normalization Normalized decoding magnitude Normalized significant time (ms) Normalized peak time (ms) Up, large 0.66 90.75 113.25 0.30 0.40 100.75 124.50 Center, large 0.78 75.13 139.50 0.20 0.42 87.63 137.00 Down, large 0.69 74.50 134.50 0.30 0.42 90.75 110.75 Center, mid 0.70 82.63 147.00 0.30 0.42 95.75 148.25 Center, small 0.59 94.50 148.88 0.50 0.41 98.25 148.25
Train large, test mid 0.58 85.75 154.50 0.50 0.38 102.63 154.50
Train mid, test large 0.69 90.13 160.13 0.50 0.38 102.00 160.75
Train small, test mid 0.44 123.25 198.88 0.50 0.33 126.63 182.63
Train mid, test small 0.41 129.50 170.13 1.00 0.41 129.50 170.13
Train small, test large 0.39 147.00 172.00 1.00 0.39 147.00 172.00
Train large, test small 0.34 161.38 178.88 1.00 0.34 161.38 178.88
Train down, test center 0.47 125.13 165.13 0.50 0.37 119.50 163.88
Train center, test down 0.43 129.50 177.63 1.00 0.43 129.50 177.63
Train up, test center 0.42 152.63 171.38 1.00 0.42 152.63 171.38
Train center, test up 0.37 153.88 180.75 1.00 0.37 153.88 180.75
Train up, test down 0.34 184.50 194.50 1.00 0.34 184.50 194.50
Train down, test up 0.33 178.07 222.63 1.00 0.33 178.07 222.63
Table 1: Decoding accuracy magnitude, significant time, and peak times with varying amounts of data: The above table summarizes the average magnitude of the peak of decoding accuracy, significant time, and peak time for the different size and position conditions using all data (columns 2-4). For those conditions with highest decoding accuracy, a fraction of the total data (column 5) was used to normalize peak decoding accuracy (see Materials and Methods), and the modified peak accuracy, significant time and peak time with a fraction of the data are also shown (columns 6-8). Latency values for the normalized decoding values (columns 7-8) are very similar to those from decoding performed with all data (columns 3-4), suggesting that different latencies are not due only to different magnitudes of decoding performance.
Supplemental Video 1: Visualization of sensors used in decoding procedure over time. This video provides a map of the sensors selected in the training phase and used in the testing phase of the decoding procedure for the initial three subjects viewing the three 25 image datasets shown in Figure 2. Time at bottom left is time (in ms) after stimulus onset. The color map denotes the proportion of times (as calculated over all cross-validation splits and resample runs) each sensor was selected as being one of the top 25 sensors, with darker red indicating a sensor was used in a higher proportion of times.