CBMM Memo No. 011
July 14, 2014
The Compositional Nature of Event
Representations in the Human Brain
by
Andrei Barbu
1
, N. Siddharth
2
, Caiming Xiong
3
,
Jason J. Corso
4
, Christiane D. Fellbaum
5
, Catherine Hanson
6
,
Stephen Jose Hanson
6
, Sebastien Helie
7
, Evguenia Malaia
8
,
Barak A. Pearlmutter
9
, Jeffrey Mark Siskind
10
,
Thomas Michael Talavage
10
, and Ronnie B. Wilbur
11
Abstract: How does the human brain represent simple compositions of constituents: actors,
verbs, objects, directions, and locations? Subjects viewed videos during neuroimaging (fMRI)
sessions from which sentential descriptions of those videos were identified by decoding the
brain representations based only on their fMRI activation patterns. Constituents (e.g., fold and
shirt) were independently decoded from a single presentation. Independent constituent
classification was then compared to joint classification of aggregate concepts (e.g., fold -‐shirt);
results were similar as measured by accuracy and correlation. The brain regions used for
independent constituent classification are largely disjoint and largely cover those used for joint
classification. This allows recovery of sentential descriptions of stimulus videos by composing
the results of the independent constituent classifiers. Furthermore, classifiers trained on the
words one set of subjects think of when watching a video can recognize sentences a different
subject thinks of when watching a different video.
The Compositional Nature of Event Representations
in the Human Brain
Andrei Barbu
1N. Siddharth
2Caiming Xiong
3Jason J. Corso
4Christiane D. Fellbaum
5Catherine Hanson
6Stephen Jos´
e Hanson
6S´
ebastien H´
elie
7Evguenia Malaia
8Barak A. Pearlmutter
9Jeffrey Mark Siskind
10Thomas Michael Talavage
10Ronnie B. Wilbur
11July 14, 2014
Abstract
How does the human brain represent simple compositions of constituents: actors, verbs, objects, direc-tions, and locations? Subjects viewed videos during neuroimaging (fMRI) sessions from which sentential descriptions of those videos were identified by decoding the brain representations based only on their fMRI activation patterns. Constituents (e.g., fold and shirt ) were independently decoded from a single presentation. Independent constituent classification was then compared to joint classification of aggre-gate concepts (e.g., fold -shirt ); results were similar as measured by accuracy and correlation. The brain regions used for independent constituent classification are largely disjoint and largely cover those used for joint classification. This allows recovery of sentential descriptions of stimulus videos by composing the results of the independent constituent classifiers. Furthermore, classifiers trained on the words one set of subjects think of when watching a video can recognise sentences a different subject thinks of when watching a different video.
Nonspecialist Summary When people see John folding a chair, they readily perceive that John per-formed an action fold with a chair, breaking down the aggregate event into individual components. We investigate if such compositional perception is reflected in the brain—Can one identify component and ag-gregate events that someone saw, by looking at their brain activity? Do brain regions that activate when identifying aggregate events (John folding) relate to those that activate when identifying individual compo-nents (John, folding)? Do different people exhibit similar representations? Our findings indicate affirmative outcomes for all the above and that the representations involved are indeed compositional.
Scientific Summary Our work investigates the neural basis for compositionality of event representations. We explore how the brain represents compositions of constituents such as actors, verbs, objects, directions, and locations. While the constituents and their compositions are themselves linguistic in nature, the stimuli are purely visual, depicting complex activity. This enables exploration of the linguistic basis of visual perception through neuroimaging. This work straddles a wide variety of disciplines: cognitive science, vision, linguistics, computational neuroscience, and machine learning.
1Computer Science and Artificial Intelligence Laboratory, MIT, Cambridge MA 02139
2Department of Psychology, Jordan Hall, Building 01-420, Stanford University, 450 Serra Mall, Stanford CA 94305 3Statistics, University of California at Los Angeles, Los Angeles CA 90095
4Electrical Engineering and Computer Science, University of Michigan, Ann Arbor MI 48109 5Department of Computer Science, Princeton University, Princeton NJ 08540
6Department of Psychology and Rutgers Brain Imaging Center, Rutgers University, Newark NJ 07102 7Psychological Sciences, Purdue University, West Lafayette IN 47907
8Southwest Center for Mind, Brain, and Education, University of Texas at Arlington, Arlington TX 76019 9Hamilton Institute and Dept. of Computer Science, National University of Ireland Maynooth, Co. Kildare, Ireland 10School of Electrical and Computer Engineering, Purdue University, West Lafayette IN 47907
11Dept. of Speech, Language, and Hearing Sciences and Linguistics Program, Purdue University, West Lafayette IN 47907
1
Introduction
The compositional nature of thought is taken for granted by many in the cognitive-science community. The representations commonly employed compose aggregated concepts from constituent parts (Miller and Johnson-Laird,1976).1 This has been articulated by Jackendoff as the Cognitive Constraint and the Con-ceptual Structure Hypothesis.2 Humans need not employ compositional representations; indeed, many argue that such representations may be ill suited as models of human cognition (Brooks, 1991). This is because concepts like verb or even object are human constructs; there is hence debate as to how they arise from per-cepts (Smith,1996). Recent advances in brain-imaging techniques enable exploration of the compositional nature of brain activity. To that end, subjects underwent functional magnetic resonance imaging (fMRI) while exposed to stimuli that evoke complex brain activity which was decoded piece by piece. The video stimuli depicted events composed of an actor, a verb, an object, and a direction of motion or a location of the event in the field of view. Instances of these constituents could form ordinary sentences like Dan carried the tortilla leftward. Machine-learned classifiers were used to decode complex brain activity into its constituent parts The classifiers used a subset of voxels in the whole-brain scan that was determined automatically by the machine-learning methods to be maximally effective. The study further demonstrates that:
• Accuracy of classification by classifiers trained independently on the constituents is largely the same as that of classifiers trained jointly on constituent pairs and triples.
• The brain regions employed by the per-constituent classifiers are largely pairwise disjoint.
• The brain regions employed by the joint classifiers largely consist of the unions of the brain regions employed by the component constituent classifiers.
This provides evidence for the neural basis of the compositionality of event representations. We know of no other work that demonstrates this neural basis by simultaneously decoding the brain activity for all of these constituents from the same video stimulus.
Compositionality can refer to at least two different notions. It can refer to the result of a composition. For example, 2 + 3 = 5 composes 5 out of 2 and 3. It is impossible to reconstruct 2 and 3 from the result 5. It can also refer to a specification of the structure of the composition. For example, ‘2 + 3’. From such it is possible to extract ‘2’ and ‘3’. The same issue arises with semantics. John combines with walked to yield John walked. The result of such a composition could be some nondecomposable representation. Yet the structural specification of such a composition could be decomposed into its constituents. (There are also, of course, idiomatic expressions whose meanings are not derived compositionally from their constituents. Such is not the topic of study here.)
Does the brain employ such decomposable representations? It is conceivable that representations are decomposable at some processing stages but not others. When seeing John walk, neural activity might encode regions in the field of view that reflect the aggregate percept of John walking. Moreover, that aggregate percept might be spread across neural activity in space and/or time. A behavioural response to seeing John walk, such as walking towards him, also might reflect the aggregate percept, not the percepts of John alone or walk alone, because the percept of John sitting or of Mary walking might evoke different responses. Motor response might reflect an aggregate percept which might also be spread across neural activity in space and/or time. Thus there appear to be at least some processing stages, particularly at the inputs and outputs, where representations might not be decomposable. The question is whether there exist other intermediate processing stages that are. This question is investigated.
Language itself is compositional. Sentences are composed of words. It seems likely that when a percept involves language, either auditory or visual (orthographic, signed), the neural representation of that percept would be decomposable, at least at the input. It also seems likely that when a behavioural response involves language, oral or visual (written, signed), the neural representation of that motor response would be decom-posable, at least at the output. It would be surprising, however, if a purely visual task that involved no linguistic stimuli or response would evoke decomposable brain activity. The experiment design investigates
just that.
A requirement for decomposable representations is a degree of independence of the constituent repre-sentations. It is not possible to recover 2 and 3 from 5 because extra information enters into the process 2 + 3 = 5, namely addition. It would only be possible to recover ‘2’ and ‘3’ from ‘2 + 3’ if their representations were independent. Just as decomposability need not be black and white—there may be both decomposable and nondecomposable representations employed in different brain regions—independence also need not be black and white—degree of independence may vary. Structural decomposability of aggregate compositional percepts is investigated by measuring and demonstrating a high degree of independence of the constituents. Recent work on decoding brain activity has recovered object class from nouns presented as image, video, aural, and orthographic stimuli (Puce et al.,1996; Hanson et al., 2004;Miyawaki et al.,2008; Hanson and Halchenko,2009;Just et al.,2010;Connolly et al.,2012;Pereira et al.,2012;Huth et al.,2012). Similar work on verbs has primarily been concerned with identifying active brain regions (Kable and Chatterjee, 2006; Kemmerer et al., 2008; Kemmerer and Gonzalez Castillo, 2010; Huth et al., 2012; Coello and Bidet-Ildei, 2012). Other recent work has demonstrated the ability to decode the actor of an event using personality traits (Hassabis et al., 2013). These past successes suggest that one can investigate this hypothesis using significant extensions of these prior methods combined with several novel analyses.
Compositionality is investigated as applied to sentence structure—objects fill argument positions in pred-icates that combine to form sentential meaning—and decompose such into independent constituents. Recent work has identified brain regions correlated with compositionality that may not be decomposable using a task called complement coercion (Pylkk¨anen et al., 2011). Subjects were presented with sentences whose meanings were partly implied rather than fully expressed overtly through surface constituents. For example, the sentence The boy finished the pizza is understood as meaning that the pizza was eaten, even though the verb eat does not appear anywhere in the sentence (Pustejovsky,1995). The presence of pizza, belonging to the category food, coerces the interpretation of finish as finish eating. By contrast, He finished the newspa-per induces the interpretation finish reading. Because syntactic structure in this prior exnewspa-periment was held constant, the assumption was that coercion reflects incorporation of extra information in the result that is absent in the constituents. Brain activity measured using magnetoencephalography (MEG) showed activity related to coercion in the anterior midline field. This result suggests that there may be some regions that do not exhibit decomposable brain activity but does not rule out the possibility that there are other regions that do.
It is conceivable that different subjects represent such compositional information differently, perhaps in different brain regions. Evidence is presented for why this might not be the case by demonstrating cross-subject train and test: training classifiers on a set of cross-subjects watching one set of videos and testing on a different subject watching a different set of videos.
2
Experiment Design and Analysis
The existence of brain regions that exhibit decomposable brain activity was hypothesised and an experiment was conducted to evaluate this hypothesis by demonstrating the ability to decode the brain activity evoked by a complex visual stimulus into a sentence that describes that stimulus by independently decoding the constituent words. During neuroimaging (fMRI), subjects were shown videos that depicted events that can be described by sentences of the form: the actor verb the object direction/location, e.g., Siddharth folded the chair on the right. They were asked to think about the sentence depicted by each video but were not required to provide a specific behavioural response.
The videos were nonlinguistic; they showed one of four actors performing one of three verbs on one of three objects in one of two directions or locations. The videos were also combinatorial in nature; any actor could perform any verb on any object in any direction or location. The following questions were asked:
• Can one recover these individual constituents from the aggregate stimulus? • Can one recover combinations of these from the aggregate stimulus?
• How does accuracy, when doing so, depend on whether the classifiers were trained only on the individual constituents or jointly on the combined concepts?
• Do classifiers trained jointly on the combined concepts use different brain regions than those trained on the individual constituents?
• Do such stimuli evoke different neural activity patterns in different brain regions in different subjects? The combinatorial nature of the stimuli facilitates investigating these questions by allowing one to train classifiers for the independent constituents that occur in each stimulus:
actor one-out-of-four actor identity
verb one-out-of-three verb (carry, fold, and leave) object one-out-of-three noun (chair, shirt, and tortilla)
direction one-out-of-two direction of motion for carry and leave (leftward vs. rightward ) location one-out-of-two location in the field of view for fold (on the left vs. on the right )
This design further facilitates the investigation by also allowing one to train classifiers for combinations of the constituents: pairs (actor-verb, actor-object, actor-direction, actor-location, object, verb-direction, object-verb-direction, and object-location), triples (actor-verb-object, actor-verb-verb-direction, actor-object-direction, and verb-object-direction), and even the entire sentence.
Data was gathered for seven subjects and a variety of different classification analyses were performed using a linear support vector machine (SVM; Cortes and Vapnik, 1995). For all of these, cross validation was employed to partition the dataset into training and test sets, training classifiers on the training sets and measuring their accuracy on the test sets. For constituent pairs and triples, this was done with two kinds of classifiers, ones trained jointly on the combination of the constituents and ones trained independently on the constituents. The accuracy obtained on within-subject analyses, training and testing the classifiers on data from the same subject, was also compared to that obtained on cross-subject analyses, training and testing the classifiers on data from different subjects. Two different methods were further employed to determine the brain regions used by the classifiers and a variety of analyses were performed to measure the degree of overlap.
3
Results
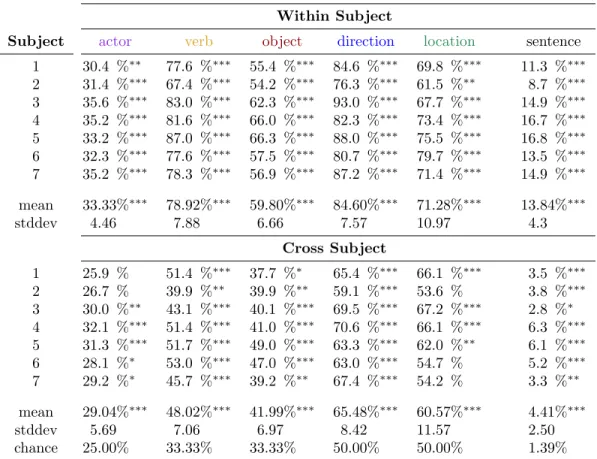
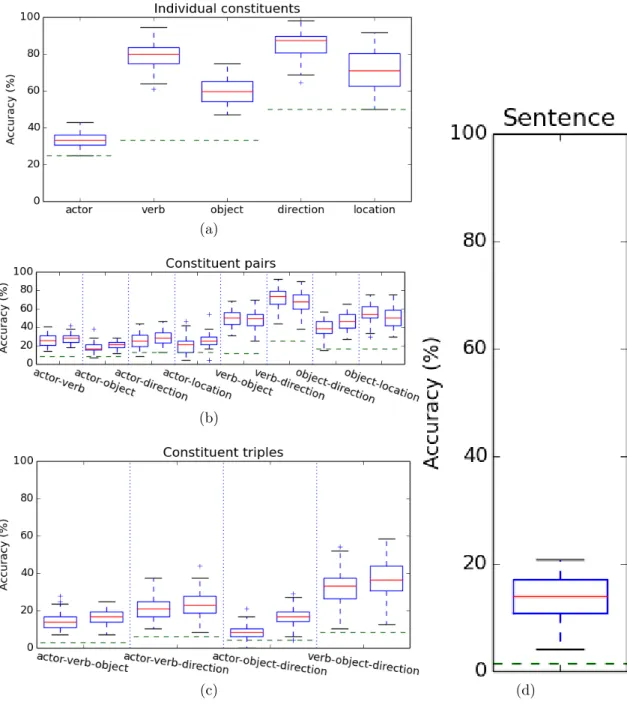
Table 1(top) presents the per-constituent classification accuracies, both per-subject and aggregated across subject, for the within-subject analyses. Fig. 1(a) presents the per-constituent classification accuracies aggregated across subject. Performance well above chance was achieved on all five constituents, with only a single fold for subject 1 and two folds for subject 2 at chance for the actor analysis and two folds for subject 2 at chance for the location analysis. Average performance across subject is also well above chance: actor 33.33%∗∗∗ (chance 25.00%), verb 78.92%∗∗∗ (chance 33.33%). object 59.80%∗∗∗ (chance 33.33%), direction 84.60%∗∗∗ (chance 50.00%), and location 71.28%∗∗∗ (chance 50.00%). (For all classification accuracies, ‘*’ indicates p < 0.05, ‘**’ indicates p < 0.005, and ‘***’ indicates p < 0.0005.)
An additional analysis was conducted to measure the independence of the representations for these con-stituents. Classifiers were trained jointly for all constituent pairs, except for verb and location (because location only applied to a single verb fold ) and the classification accuracy was compared against indepen-dent application of the classifiers trained on the constituents in isolation (Fig.1b). Classifiers were similarly trained jointly for all constituent triples, except for actor, object, and location due to lack of sufficient training data, and a similar comparison was performed (Fig.1c). An independent classification was deemed correct if it correctly classified all of the constituents in the pair or triple.
A further analysis was conducted to measure the accuracy of decoding an entire sentence from a single stimulus. Training a joint classifier on entire sentences would require a sufficiently large number of samples for each of the 72 possible sentences (4×3×3×2), which would be unfeasible to gather due to subject fatigue. However, each sample was independently classified with the per-constituent classifiers and the results were combined as described above (Fig.1d). Average performance across subject is well above chance (13.84%∗∗∗, chance 1.39%).
Classification Accuracy Within Subject
Subject actor verb object direction location sentence
1 30.4 %∗∗ 77.6 %∗∗∗ 55.4 %∗∗∗ 84.6 %∗∗∗ 69.8 %∗∗∗ 11.3 %∗∗∗ 2 31.4 %∗∗∗ 67.4 %∗∗∗ 54.2 %∗∗∗ 76.3 %∗∗∗ 61.5 %∗∗ 8.7 %∗∗∗ 3 35.6 %∗∗∗ 83.0 %∗∗∗ 62.3 %∗∗∗ 93.0 %∗∗∗ 67.7 %∗∗∗ 14.9 %∗∗∗ 4 35.2 %∗∗∗ 81.6 %∗∗∗ 66.0 %∗∗∗ 82.3 %∗∗∗ 73.4 %∗∗∗ 16.7 %∗∗∗ 5 33.2 %∗∗∗ 87.0 %∗∗∗ 66.3 %∗∗∗ 88.0 %∗∗∗ 75.5 %∗∗∗ 16.8 %∗∗∗ 6 32.3 %∗∗∗ 77.6 %∗∗∗ 57.5 %∗∗∗ 80.7 %∗∗∗ 79.7 %∗∗∗ 13.5 %∗∗∗ 7 35.2 %∗∗∗ 78.3 %∗∗∗ 56.9 %∗∗∗ 87.2 %∗∗∗ 71.4 %∗∗∗ 14.9 %∗∗∗ mean 33.33%∗∗∗ 78.92%∗∗∗ 59.80%∗∗∗ 84.60%∗∗∗ 71.28%∗∗∗ 13.84%∗∗∗ stddev 4.46 7.88 6.66 7.57 10.97 4.3 Cross Subject 1 25.9 % 51.4 %∗∗∗ 37.7 %∗ 65.4 %∗∗∗ 66.1 %∗∗∗ 3.5 %∗∗∗ 2 26.7 % 39.9 %∗∗ 39.9 %∗∗ 59.1 %∗∗∗ 53.6 % 3.8 %∗∗∗ 3 30.0 %∗∗ 43.1 %∗∗∗ 40.1 %∗∗∗ 69.5 %∗∗∗ 67.2 %∗∗∗ 2.8 %∗ 4 32.1 %∗∗∗ 51.4 %∗∗∗ 41.0 %∗∗∗ 70.6 %∗∗∗ 66.1 %∗∗∗ 6.3 %∗∗∗ 5 31.3 %∗∗∗ 51.7 %∗∗∗ 49.0 %∗∗∗ 63.3 %∗∗∗ 62.0 %∗∗ 6.1 %∗∗∗ 6 28.1 %∗ 53.0 %∗∗∗ 47.0 %∗∗∗ 63.0 %∗∗∗ 54.7 % 5.2 %∗∗∗ 7 29.2 %∗ 45.7 %∗∗∗ 39.2 %∗∗ 67.4 %∗∗∗ 54.2 % 3.3 %∗∗ mean 29.04%∗∗∗ 48.02%∗∗∗ 41.99%∗∗∗ 65.48%∗∗∗ 60.57%∗∗∗ 4.41%∗∗∗ stddev 5.69 7.06 6.97 8.42 11.57 2.50 chance 25.00% 33.33% 33.33% 50.00% 50.00% 1.39%
Table 1: Results of per-constituent classification. Per-subject mean classification accuracy for each con-stituent, along with independent sentence classification, averaged across fold. Note that all six analyses perform above chance. A ‘*’ indicates p < 0.05, a ‘**’ indicates p < 0.005, and a ‘***’ indicates p < 0.0005.
(a)
(b)
(c) (d)
Figure 1: Classification accuracy, aggregated across subject and fold, for independent constituents (a), constituent pairs (b) and triples (c), and entire sentences using independent per-constituent classifiers (d). (b, c) Comparison of joint (left) vs. independent (right) classification accuracy aggregated across subject and fold for constituent pairs and triples. Red lines indicate medians, box extents indicate upper and lower quartiles, error bars indicate maximal extents, and crosses indicate outliers. The dashed green lines indicates chance performance.
actor actor actor actor verb verb object object
verb object direction location object direction direction location
accuracy 0.6607 0.7059 0.6336 0.6763 0.6709 0.7422 0.6544 0.6235
MCC 0.3724 0.3430 0.3603 0.2807 0.5959 0.7048 0.5560 0.5067
actor actor actor verb verb verb object object object direction direction direction accuracy 0.8093 0.7403 0.8344 0.7154
MCC 0.2521 0.3004 0.2352 0.4594
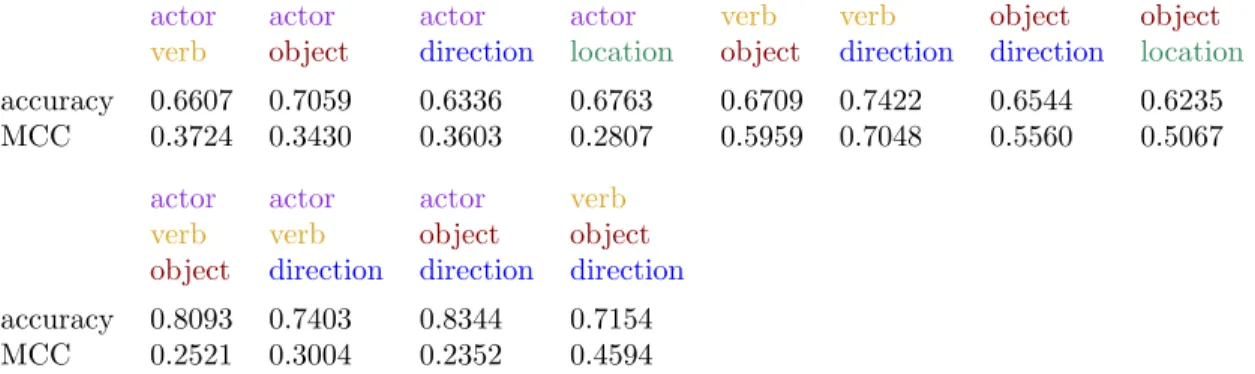
Table 2: Accuracy and MCC between independent and joint classification for constituent pairs (top) and triples (bottom), over the samples where the joint classifier was correct, aggregated across subject and fold.
(Gorodkin, 2004), over the samples where the joint classifier was correct, yielding an average accuracy of 0.7056 and an average correlation of 0.4139 across all analyses (Table2).
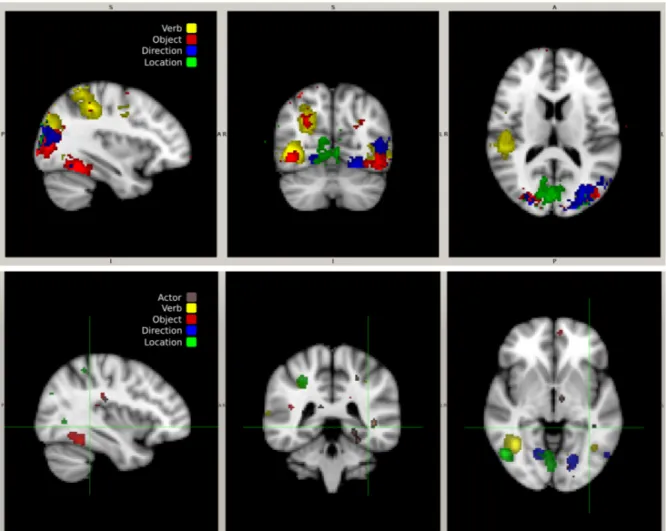
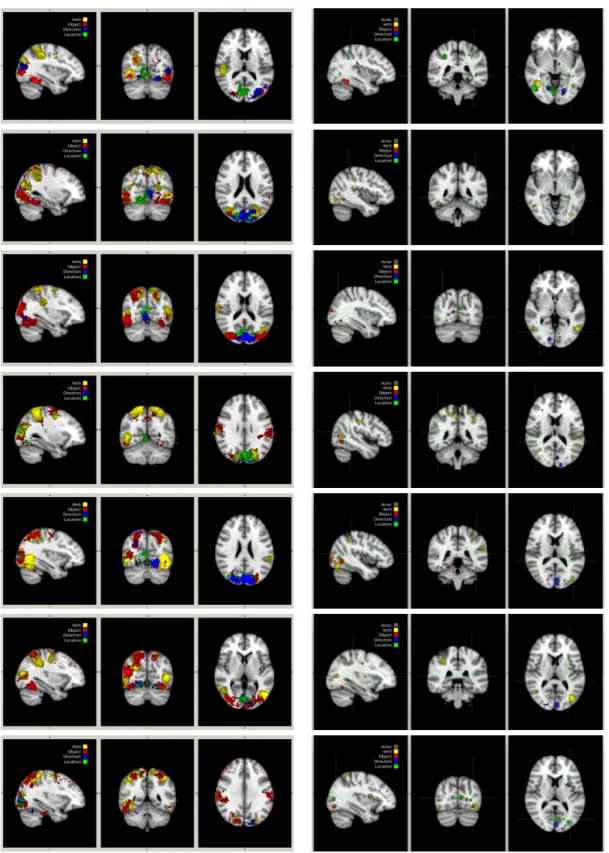
Two distinct methods were used to locate brain regions used in the previous analyses. A spatial-searchlight (Kriegeskorte et al.,2006) linear-SVM method was first employed on all subjects. The accuracy was used to determine the sensitivity of each voxel and thresholded upward to less than 10% of the cross-validation measures. These measures are overlaid and (2-stage) registered to MNI152 2mm anatomicals. This searchlight analysis was performed independently for all of the constituent and joint classifiers. The resulting constituent regions (omitting actor) are colour coded according to the specific constituent being decoded. The thresholded SVM coefficients were also back-projected for all constituents, including actor, produced by the analysis in Table1, for all subjects, onto the anatomical scan, aggregated across run. The resulting regions produced by both analyses for subject 1 are shown in Fig.2. (Figures for all subjects are included at the end.)
To further quantify the degree of spatial independence, the brain regions indicated by searchlight and by the thresholded SVM coefficients of the independent classifiers were compared to those of the joint classifiers, for all constituent pairs and triples. First, the percentage of voxels in the union of the constituents for the independent classifier that were also in the intersection was computed (Table3 top). Next, the percentage of voxels in the joint classifier that are shared with the independent classifier was also computed (Table 3 bottom).
A further set of analyses was conducted to investigate the degree to which different subjects employ different representations, in different brain regions, of the constituents under study. Cross-subject variants of the analyses in Table 1(top) and Fig. 1 were performed where the classifiers used to test on a given run for a given subject were trained on data from all runs except the given run for all subjects except the given subject. These results are shown in Table 1(bottom) and Fig. 3. While classification accuracy is lower than the corresponding within-subject analyses, all analyses aggregated across subject, all per-subject single-constituent analyses, all per-subject independent-sentence analyses, and all but one of the remaining per-subject analyses are above chance; the vast majority significantly so.
4
Discussion
The stimuli were purely visual. There were no words, phrases, or sentences presented, either auditorily or visually (orthographic, signed). Subjects were not asked to provide a specific behavioural response other than to watch the video and think about its content. No behavioural or motor response of any kind was elicited. Specifically, subjects were not asked to produce words, phrases, or sentences, either oral or visual (written, signed). Thus neither the stimuli nor the (nonexistent) behavioural response were overtly linguistic. Nonetheless, the experimental setup was implicitly linguistic in a number of ways. Subjects were shown sample video prior to imaging and were informed of the structure of the stimuli and the intended collection
Figure 2: (top) Searchlight analysis indicating the classification accuracy of different brain regions on the anatomical scans from subject 1 averaged across stimulus, class, and run. (bottom) Thresholded SVM coefficients for subject 1, back-projected onto the anatomical scan, aggregated across run.
\ i independenti [ i independenti
actor actor actor actor verb verb object object
verb object direction location object direction direction location
3.30% 6.74% 1.74% 1.32% 14.98% 1.20% 8.43% 4.48%
2.84% 2.54% 1.16% 2.06% 6.05% 3.61% 3.70% 2.36%
actor actor actor verb verb verb object object object direction direction direction
1.26% 0.06% 0.65% 0.49% 0.42% 0.01% 0.00% 0.20% [ i independenti ! ∩ joint |joint|
actor actor actor actor verb verb object object
verb object direction location object direction direction location
67.42% 48.64% 68.53% 69.37% 79.53% 74.53% 65.97% 79.15% 58.85% 51.22% 42.42% 27.71% 66.05% 62.38% 52.70% 38.81%
actor actor actor verb verb verb object object object direction direction direction 24.48% 59.43% 37.78% 55.13% 60.68% 56.51% 38.35% 58.25%
Table 3: Quantitative comparison of the brain regions indicated by searchlight (upper rows) and thresholded SVM coefficients (lower rows) of the independent classifiers to the joint classifiers, for all constituent pairs and triples, averaged across subject. (top) The percentage of voxels in the union of the constituents for the independent classifier that are also in the intersection. (bottom) The percentage of voxels in the joint classifier that are shared with the independent classifier.
(a)
(b)
(c) (d)
of actors, verbs, objects, directions, and locations. All subjects were aware of the experiment design, were informed of the general intended depiction of the stimuli prior to the scan, and were instructed to think of the intended depiction after each presentation. While no specific behavioural response was elicited, they were asked to think about the sentence depicted by each video. It is conceivable that such subject instruction introduced a linguistic aspect to the task and is what induced a decomposable representation.
This would be interesting in its own right, as it would indicate generation of internal linguistic repre-sentations even given a lack of overt linguistic behavioural and motor response. Nonetheless, it would be interesting to see if such representations arose even when subjects were not given such explicit instruction and perhaps were not even primed as to the experiment design, the set of target constituents, and the set of classes within each constituent. Moreover, it would be interesting to see if such representations also arise for stimuli that are less conducive to sentential description, such as more abstract, perhaps synthetic, video of moving shapes that nonetheless could be conceptually decomposed into shape vs. motion patterns vs. direction and location that would not be described as nouns, verbs, and prepositions.
The results indicate that brain activity corresponding to each of the constituents, actor, verb, object, direction, and location, can be reliably decoded from fMRI scans, both individually, and in combination. Given neural activation, one can decode what the subjects are thinking about.
Furthermore, the analysis indicates that a decomposable neural representation for each of these five constituents exists in the brain. This is surprising; intermediate neural representation could have been all interdependent, just like the inputs and outputs. People engage in distinct motions when fold ing chair s, shirt s, and tortillas. If the representation of a verb, like fold, was neurally encoded for a particular object, for example, to reflect the particular motion involved when performing the action denoted by that verb, it would not be possible to decode this verb with performance above chance in the experiment design, because it is counterbalanced with respect to the objects with which the action is being performed. Moreover, if there were some level of object specificity in verbs, one would expect this to be reflected in marked decrease in classification accuracy of independent classifiers for verb and object over a joint classifier for the pair. This, however, does not appear to be the case: averaged across subject, the joint verb-object classifier has 49.58%∗∗∗ accuracy while the independent one has 47.94%∗∗∗. The relative performance of joint vs. independent classification appears similar across all combinations of constituents, not just verbs and objects (Figs. 1b, c), so much so that one can decode an entire sentence from a single stimulus, with accuracy far above chance, using per-constituent classifiers trained independently on those constituents. Moreover, joint and independent classification are highly correlated (Table2), indicating that the joint classifiers are not making significant use of information beyond that available to the independent classifiers.
In general, the searchlight analysis and the back-projected SVM coefficients (Fig. 2) indicate that such decoding relies on different brain regions for different constituents. Actor activity is present in the fusiform face area (Kanwisher et al., 1997). Verb activity is present in visual-pathway areas (lateral occipital-LO, lingual gyrus-LG, and fusiform gyrus) as well as prefrontal areas (inferior frontal gyrus, middle frontal gyrus, and cingulate) and areas consistent with the hypothetical ‘mirror system’ (Arbib,2006) and the hypothetical ‘theory of mind’ (pre-central gyrus, angular gyrus-AG, and superior parietal lobule-SPL) areas (Dronkers et al., 2004; Turken and Dronkers, 2011). Object activity is present in the temporal cortex, and agrees with previous work on object-category encoding (Gazzaniga et al.,2008). Direction and location activity is present in the visual cortex with significant location activity occurring in the early visual cortex. More specifically, quantitative analysis of the brain regions indicated by both searchlight and the thresholded SVM coefficients indicates that the brain regions used for independent constituent classification are largely disjoint (3.72% for searchlight and 2.08% for thresholded SVM weights, averaged across both subject and analysis) and largely cover (60.83% for searchlight and 51.16% for thresholded SVM weights, averaged across both subject and analysis) those used for joint classification (Table3).
Note that we are claiming that the brain independently processes constituents, e.g., verb and object, not that the output of such processing is independent. In particular, we are not claiming that the outputs of the classifiers are independent across constituent. Classification results are produced by a long pipeline: the stimulus, the evoked brain activity, its indirect measurement via fMRI, and its analysis via classification. Cross-constituent dependence can be introduced at any stage in this pipeline and could also be masked by
any subsequent stage. Moreover, the classifiers are imperfect. The confusion matrices are not diagonal. Since the design is counterbalanced, in order for a χ2 test not to reject the null hypothesis, the contingency table must be uniform. However, if the verb classifier exhibits a misclassification bias where, for example, carry is misclassified as fold more frequently than as leave, and the object classifier exhibits a similar misclassification bias, where, for example, chair is misclassified as shirt more frequently than as tortilla, this would manifest as dependence between verb and object in the classifier output that would have no bearing on classification accuracy. Nor would it indicate joint usage of verb and object information during classification. Thus it makes no sense to perform a standard χ2 independence test between pairs of constituent classifier outputs. What we are claiming is that the brain largely makes classification decisions for one constituent indepen-dent of those for other constituents. We take as evidence for this:
• Classification accuracy using independent classifiers is largely the same as that for corresponding joint classifiers.
• The brain regions employed by the per-constituent classifiers are largely pairwise disjoint.
• The brain regions employed by the joint classifiers largely consist of the unions of the brain regions employed by the component constituent classifiers.
Moreover, one can train a classifier on the words that one set of subjects think of when watching a video to recognise sentences that a different subject thinks of when watching a different video, with accuracy far better than chance. This suggests that there must be sufficient commonality, across subjects, between representations and brain regions used for the constituents under study, to allow such.
Compositionality is a rich notion. Not only must it be possible to determine 2 and 3 from ‘2+3’, it must be possible to determine that 2 is an argument of this addition but not the addition in ‘4 + (3 × 2)’, even though it appears elsewhere in the formula. For language and vision, it must be possible to determine that a person is folding the chair and not the shirt, when a shirt is present in the field of view but is not being folded. The present analysis can be construed as computational identification of associative-linguistic representations, a form of syntax-less language learning, without prefrontal cortex (PFC) engagement (Friederici et al.,2013). Further, not all operations are commutative or symmetric: it must be possible to distinguish ‘2 ÷ 3’ from ‘3 ÷ 2.’ For language and vision, some predicates are also asymmetric; it must be possible to distinguish between a person approaching a dog from a dog approaching a person. Making such distinctions will require analysing fine-grained PFC activity, likely using a region-of-interest approach (Jeon and Friederici, 2013). Finally, the individual constituents may themselves be decomposable. Verbs like raise and lower may decompose into lower-level constituents indicating causation of upward vs. downward motion where the lower-level constituents denoting causation and motion are shared between the two verbs but those denoting direction are not (Miller and Johnson-Laird, 1976; Jackendoff, 1983; Pinker, 1989). For now, the findings are agnostic to these issues.
5
Conclusion
It has been demonstrated that it is possible to decode a subject’s brain activity into constituents, which, when combined, yield a sentential description of a video stimulus. To do so, the first study was conducted which decodes brain activity associated with actors, verbs, objects, directions, and locations from video stimuli, both independently and jointly. These results are the first to indicate that the neural representations for these constituents compose together to form the meaning of a sentence, apparently without modifying one another, even when evoked by purely visual, nonlinguistic stimuli, using what appear to be common representations and brain regions that vary little across subject, at least at the granularity investigated. These results are in concord with Jackendoff’s Cognitive Constraint and Conceptual Structure Hypothesis and indicate that representations which attempt to decompose meaning into constituents may have a neural basis.
6
Methods Summary
Subjects were shown video depicting events described by entire sentences composed of an actor, a verb, an object, and a direction of motion or a location of the event in the field of view. Subjects were shown sample video prior to imaging and were informed of the structure of the stimuli and the intended collection of four actors, three verbs (carry, fold, and leave), three objects (chair, shirt, and tortilla), two directions (leftward and rightward ), and two locations (on the left and on the right )). They were asked to think about the sentence depicted by each video, but no overt behavioural response was elicited.
Subjects were scanned (fMRI) while watching the stimuli. Each subject underwent eight runs, each run comprising 72 stimulus presentations in a rapid event-related design (Just et al., 2010). The presentations were counterbalanced within and across runs, for all constituent categories. Scan data was preprocessed using AFNI (Cox, 1996) to skull-strip each volume, motion correct and detrend each run, and perform alignment. Within-subject experiments were carried out in the native coordinate space while cross-subject experiments were aligned to MNI152 using an affine transform. A subset of significant voxels, determined by Fisher scores and Linear Discriminant Dimensionality Reduction (Gu et al.,2011), was selected to perform classification using a linear support vector machine (SVM) classifier (Cortes and Vapnik,1995). Classification was performed on individual constituents and constituent aggregates: pairs, triples, and entire sentences. Two kinds of classifiers were used when classifying constituent pairs and triples: ones trained independently on the component constituents and ones trained jointly. Two kinds of analyses were performed: within subject and cross subject. For within-subject analyses, leave-one-out cross validation was performed by run, training and testing on the same subject. When testing on run r, the classifiers were trained on all runs except run r. For cross-subject analyses, leave-one-out cross validation was performed by subject and run. When testing on run r for subject s, the classifiers were trained on all runs except run r for all subjects except subject s.
7
Methods
Stimuli Videos depicting one of four human actors performing one of three verbs (carry, fold, and leave), each with one of three objects (chair, shirt, and tortilla), were filmed for this task. The verbs were chosen to be discriminable based on the following features (Kemmerer et al.,2008):
carry −state-change +contact fold +state-change +contact leave −state-change −contact
Objects were chosen based on categories previously found to be discriminable: chair (furniture), shirt (cloth-ing), and tortilla (food) and also selected to allow each verb to be performed with each object (Just et al., 2010). All stimuli enactments were filmed against the same uncluttered uniform nonvarying background, which contained no other objects except for a table. The action depiction was intentionally varied to be unconventional (humorous) to keep subjects awake, attentive, and unhabituated.
In addition to depicting an actor, a verb, and an object, each stimulus also depicted a direction or a location. Direction was only depicted for the two verbs, carry and leave, while location was only depicted for the verb fold. The variation in direction and location was accomplished by mirroring videos about the vertical axis. Such mirroring induces variation in direction of motion (leftward vs. rightward ) for the verbs carry and leave and induces variation in the location in the field of view where the verb fold occurs (on the left vs. on the right ). All other variation was accomplished by filming a combination of actor, verb, and object. There were four actors, three verbs, three objects, two directions, and two locations, leading to 4 × 3 × 3 × 2 = 72 possible distinct depictions, for which between 3 and 7 (mean 5.5) videos were employed for each such depiction.
Each subject viewed a total of 576 stimulus presentations, divided into eight runs of equal length. The runs were individually counterbalanced. Each run comprised 72 stimulus presentations, exactly one for each possible depiction. The particular video chosen for the depiction was randomly drawn from a uniform
distribution. Some stimuli may have been chosen for multiple runs. All subjects were presented with the same stimuli and presentation order within and across runs.
Study Subjects Informed consent was obtained from all subjects. All protocols, experiments, and analyses were carried out with approval of the Institutional Review Board at Purdue University. Data was gathered for eight subjects, two women and six men. Six subjects were between 20 and 30 years old, two were between 50 and 60 years old. Seven subjects were students and faculty. One subject was recruited from the general population of West Lafayette, IN.
Data Collection A rapid event-related design (Just et al.,2010) was employed. Two-second video clips were presented at 10fps followed by an average of 4s (minimum 2s) fixation. Each run comprised 72 stimulus presentations spanning 244 captured brain volumes and ended with 24s of fixation. Runs were separated by several minutes, during which no stimuli were presented, no data was gathered, and subjects engaged in unrelated conversation with the experimenters. This separation between runs allowed runs to constitute folds for cross validation without introducing spurious correlation in brain activity between runs.
Imaging was performed at Purdue University using a 3T GE Signa HDx scanner (Waukesha, Wisconsin) with a Nova Medical (Wilmington, Massachusetts) 16 channel brain array to collect whole-brain volumes via a gradient-echo EPI sequence with 2000ms TR, 22ms TE, 200mm×200mm FOV, and 77◦ flip angle. Thirty-five axial slices were acquired with a 3.0mm slice thickness using a 64×64 acquisition matrix resulting in 3.125mm×3.125mm×3.0mm voxels.
Data was collected for eight subjects but the data for one subject was discarded due to excessive motion. One subject did eight runs without exiting the scanner. All other subjects exited the scanner at various points during the set of eight runs, which required cross-session registration. All subjects were aware of the experiment design, shown sample stimuli, informed of the structure of the stimuli and the intended collection of actors, verbs, objects, directions, and locations, prior to imaging, and instructed to think of the intended depiction after each presentation, but no overt behavioural response was elicited.
Preprocessing and Dimensionality Reduction Whole-brain scans were processed using AFNI (Cox, 1996) to skull-strip each volume, motion correct and detrend each run, and align all scans for a given subject to a subject-specific reference volume. Voxels within a run were z-scored, subtracting the mean value of that voxel for the run and dividing by its variance. Since each brain volume has very high dimension, 143,360 voxels, voxels were eliminated by computing a per-voxel Fisher score on the training set and keeping the 4,000 highest-scoring voxels (12,000 for the cross-subject analyses). The Fisher score of a voxel v for a classification task with C classes where each class c has nc examples was computed as
C X c=1 nc(µc,v− µ)2 C X c=1 ncσ2c,v
where µc,v were σc,v are the per-class per-voxel means and variances and µ was the mean for the entire brain volume. The resulting voxels were then analysed with Linear Discriminant Dimensionality Reduction (Gu et al.,2011) to select a smaller number of potentially-relevant voxels, selecting on average 1,084 voxels per-subject per-fold (12,000 for the cross-subject analyses). Both stages of voxel selection were performed independently for each fold of each subject. The set of voxels to consider was determined solely from the training set. That same subset of voxels was used in the test set for classification.
recover the features that the subjects were asked to think about. The third brain volume after the onset of each stimulus was used, because fMRI does not measure neural activation but instead measures the flow of oxygenated blood, the blood-oxygen-level-dependent (BOLD) signal, which correlates with increased neural activation. It takes roughly five to six seconds for this signal to peak, which puts the peak in the third volume after the stimulus presentation.
Cross Validation Two kinds of analyses were performed: within subject and cross subject. The within-subject analyses trained and tested each classifier on the same within-subject. In other words, classifiers were trained on the data for subject s and also tested on the data for subject s. This was repeated for all seven subjects. For these, leave-one-out cross validation was performed by run: when testing on run r, the classifiers were trained on all runs except run r. Such cross validation precludes training on the test data. Partitioning by run ensures that information could not flow from the training set to the test set through the hemodynamic response function (HRF). This was repeated for all eight runs, thus performing eight-fold cross validation.
The cross-subject analyses trained and tested each classifier on different subjects. In particular, a classifier was trained on the data for all subjects except subject s and then tested on the data for subject s. This was repeated for all seven subjects. For these, leave-one-out cross validation was performed by both subject and run: when testing on run r for subject s, the classifiers were trained on all runs except run r for all subjects except subject s. While there is no potential for training on the test data, even without cross validation by run, there is potential for a different HRF-based confound. Due to the HRF, each scan potentially contains information from prior stimuli in the same run. Since the presentation order did not vary by subject, it is conceivable that classifier performance is due, in part, to the current stimulus in the context of previous stimuli in the same run, not just the current stimulus. One could control for this confound by randomising presentation order across subject, but this was not part of the experiment design. Cross validation by run is an alternative control for this confound.
Analysis Classification was performed on individual constituents and constituent aggregates: pairs, triples, and entire sentences. Two kinds of classifiers were used when classifying constituent pairs and triples: ones trained independently on the component constituents and ones trained jointly.
Thirty classification analyses were conducted in total: five single-constituent analyses, eight constituent-pair analyses, both independent and joint, four constituent-triple analyses, both independent and joint, and an independent sentence analysis. These analyses varied in training- and test-set sizes because of several properties of the design. First, verb does not combine with location since location only applies to a single verb, fold. Second, a joint classifier was not trained for actor, object, and location because there would be only seven training samples per subject, fold, and class. Similarly, only an independent classifier was employed for sentence and a joint classifier was not trained because there would be only seven training samples per subject, fold, and class. Thus per-subject classification results are over 192 trials for analyses that involve location, 384 trials for analyses that involve direction, and 576 trials for all other analyses. Classification results aggregated across subjects are over 1,344 trials for analyses that involve location, 2,688 trials for analyses that involve direction, and 4,032 trials for all other analyses. For within-subject analyses, the training set was seven times as large as the test set and contained exactly seven times as many depictions for any combination of particular constituents as the test set. However, the particular stimulus video for a given depiction may have appeared more than once in the training set and may have been shared between the training and test sets. Cross-subject analyses were similar except that the training set was 42 times as large as the test set.
Statistical Significance For all classification accuracies, ‘*’ indicates p < 0.05, ‘**’ indicates p < 0.005, and ‘***’ indicates p < 0.0005. Such p values were computed for all classification results, taking a one-sided binomial distribution (repeated independent Bernoulli trials with a uniform distribution over possible outcomes) to be the null hypothesis. In most cases, this leads to extremely small p values. Assuming independence between trials, where each trial is uniformly distributed, is warranted because all runs were counterbalanced. All within-subject and cross-subject analyses that aggregate across subject are highly
significant; the largest p value was less than 10−8. The ‘***’ annotations are omitted in plots for such results. Of the 210 per-subject analyses, only three instances have p values that exceed 0.05 for within subject and only eighteen instances have p values that exceed 0.05 for cross subject. We know of no way to determine statistical significance of the non-classification-accuracy results.
Determining Brain Regions Used by Classifiers Two different techniques were employed to determine the brain regions used by the classifiers. The first was a spatial searchlight which slides a small sphere across the entire brain volume and performs training and test using only the voxels inside that sphere. A sphere of radius three voxels, densely placed at the centre of every voxel, was used and no dimensionality reduction was performed on the remaining voxels. An eight-fold cross validation was then performed, as described above, for each position of the sphere and those spheres whose classification accuracies exceeded a specified threshold were back-projected onto the anatomical scans. The second method back-projected the SVM coefficients for the trained classifiers onto the anatomical scans using a classifier (Hanson and Halchenko, 2009) with a different metric, w(i)2. The higher the absolute value of the coefficient the more that voxel contributes to the classification performance of the SVM.
Addendum
Acknowledgements AB, NS, and JMS were supported, in part, by Army Research Laboratory (ARL) Co-operative Agreement W911NF-10-2-0060. AB was supported, in part, by the Center for Brains, Minds and Machines (CBMM), funded by NSF STC award CCF-1231216. CX and JJC were supported, in part, by ARL Cooperative Agreement W911NF-10-2-0062 and NSF CAREER grant IIS-0845282. CDF was supported, in part, by NSF grant CNS-0855157. CH and SJH were supported, in part, by the Mc-Donnell Foundation. BAP was supported, in part, by Science Foundation Ireland grant 09/IN.1/I2637. The views and conclusions contained in this document are those of the authors and should not be in-terpreted as representing the official policies, either express or implied, of the supporting institutions. The U.S. Government is authorised to reproduce and distribute reprints for Government purposes, notwithstanding any copyright notation herein. Dr. Gregory G. Tamer, Jr. provided assistance with imaging and analysis.
Author Contributions AB, NS, and JMS designed the experiments, prepared stimuli, ran subjects, con-ducted analyses, and wrote the manuscript. CX and JJC implemented dimensionality reduction and the classifier. CDF, SH, EM, and RBW contributed to experiment design and conducting analyses. CH, SJH, and BAP contributed to experiment design, running pilot subjects, and conducting analyses. TMT contributed to experiment design, running subjects, and conducting analyses.
Data Deposition Stimuli, presentation files and software, and scan data are available at http://upplysingaoflun.ecn.purdue.edu/~qobi/fmri2014.tgz
Competing Interests The authors declare that they have no competing financial interests.
Correspondence Correspondence and requests for materials should be addressed toJeffrey Mark Siskind.
References
M. A. Arbib. Action to Language via the Mirror Neuron System. Cambridge University Press, Cambridge, UK, 2006.
R. A. Brooks. Intelligence without representation. Artificial Intelligence, 47(1):139–159, 1991.
Y. Coello and C. Bidet-Ildei. Motor representation and language in space, object and movement perception. In Language and Action in Cognitive Neuroscience, chapter 4, pages 83–110. Psychology Press, New York, NY, 2012.
C. Cortes and V. Vapnik. Support-vector networks. Machine Learning, 20(3):273–297, 1995.
R. W. Cox. AFNI: software for analysis and visualization of functional magnetic resonance neuroimages. Computers and Biomedical Research, 29(3):162–173, 1996.
N. F. Dronkers, D. P. Wilkins, R. D. Van Valin, Jr., B. B. Redfern, and J. J. Jaeger. Lesion analysis of the brain areas involved in language comprehension. Cognition, 92(1-2):145–177, 2004.
A. D. Friederici, J. L. Mueller, B. Sehm, and P. Ragert. Language learning without control: The role of the PFC. Journal of Cognitive Neuroscience, 25(5):814–821, 2013.
M. S. Gazzaniga, R. B. Ivry, and G. R. Mangun. Cognitive Neuroscience: The Biology of the Mind. W. W. Norton & Company, New York, NY, third edition, 2008.
J. Gorodkin. Comparing two K -category assignments by a K -category correlation coefficient. Computational Biology and Chemistry, 28(5):367–374, 2004.
Q. Gu, Z. Li, and J. Han. Linear discriminant dimensionality reduction. In European Conference on Machine Learning and Principles and Practice of Knowledge Discovery in Databases, pages 549–564, 2011. S. J. Hanson and Y. O. Halchenko. Brain reading using full brain support vector machines for object
recognition: there is no “face” identification area. Neural Computation, 20(2):486–503, 2009.
S. J. Hanson, T. Matsuka, and J. V. Haxby. Combinatorial codes in ventral temporal lobe for object recognition: Haxby (2001) revisited: is there a “face” area? Neuroimage, 23(1):156–166, 2004.
D. Hassabis, R. N. Spreng, A. A. Rusu, C. A. Robbins, R. A. Mar, and D. L. Schacter. Imagine all the people: how the brain creates and uses personality models to predict behavior. Cerebral Cortex, 23(3), 2013.
A. G. Huth, S. Nishimoto, A. T. Vu, and J. L. Gallant. A continuous semantic space describes the repre-sentation of thousands of object and action categories across the human brain. Neuron, 76(6):1210–1224, 2012.
R. Jackendoff. Semantics and Cognition. MIT Press, Cambridge, MA, 1983.
H. A. Jeon and A. D. Friederici. Two principles of organization in the prefrontal cortex are cognitive hierarchy and degree of automaticity. Nature Communications, 4:2041–2048, 2013.
M. A. Just, V. L. Cherkassky, S. Aryal, and T. M. Mitchell. A neurosemantic theory of concrete noun representation based on the underlying brain codes. PloS One, 5(1):e8622, 2010.
J. W. Kable and A. Chatterjee. Specificity of action representations in the lateral occipitotemporal cortex. Journal of Cognitive Neuroscience, 18(9):1498–1517, 2006.
N. Kanwisher, J. McDermott, and M. M. Chun. The fusiform face area: A module in human extrastriate cortex specialized for face perception. Journal of Neuroscience, 17(11):4302–4311, 1997.
D. Kemmerer and J. Gonzalez Castillo. The two-level theory of verb meaning: An approach to integrating the semantics of action with the mirror neuron system. Brain and Language, 112(1):54–76, 2010.
D. Kemmerer, J. Gonzalez Castillo, T. Talavage, S. Patterson, and C. Wiley. Neuroanatomical distribution of five semantic components of verbs: evidence from fMRI. Brain and Language, 107(1):16–43, 2008. S. M. Kosslyn. Image and Brain: The Resolution of the Imagery Debate. MIT Press, Cambridge, MA, 1996. N. Kriegeskorte, R. Goebel, and P. Bandettini. Information-based functional brain mapping. Proceedings of
the National Academy of Sciences of the United States of America, 103(10):3863–3868, 2006.
G. A. Miller and P. N. Johnson-Laird. Language and Perception. Harvard University Press, Cambridge, MA, 1976.
Y. Miyawaki, H. Uchida, O. Yamashita, M. Sato, Y. Morito, H. C. Tanabe, N. Sadato, and Y. Kamitani. Visual image reconstruction from human brain activity using a combination of multiscale local image decoders. Neuron, 60(5):915–929, 2008.
F. Pereira, M. Botvinick, and G. Detre. Using Wikipedia to learn semantic feature representations of concrete concepts in neuroimaging experiments. Artificial Intelligence, 194:240–252, 2012.
S. Pinker. Learnability and Cognition. MIT Press, Cambridge, MA, 1989.
A. Puce, T. Allison, M. Asgari, J. C. Gore, and G. McCarthy. Differential sensitivity of human visual cortex to faces, letterstrings, and textures: a functional magnetic resonance imaging study. The Journal
of Neuroscience, 16(16):5205–5215, 1996.
J. Pustejovsky. Generative Semantics. MIT Press, Cambridge, MA, 1995.
L. Pylkk¨anen, J. Brennan, and D. K. Bemis. Grounding the cognitive neuroscience of semantics in linguistic theory. Language and Cognitive Processes, 26(9):1317–1337, 2011.
B. C. Smith. On the Origin of Objects. MIT Press, Cambridge, MA, 1996.
U. Turken and N. F. Dronkers. The neural architecture of the language comprehension network: converging evidence from lesion and connectivity analyses. Frontiers in Systems Neuroscience, 5(1), 2011.
carry chair carry shirt carry tortilla
fold chair fold shirt fold tortilla
leave chair leave shirt leave tortilla
analysis a b c d e f g actor 4 126 504 18 72 576 4032 verb 3 168 504 24 72 576 4032 object 3 168 504 24 72 576 4032 direction 2 168 336 24 48 384 2688 location 2 84 168 12 24 192 1344 actor-verb 12 42 504 6 72 576 4032 actor-object 12 42 504 6 72 576 4032 actor-direction 8 42 336 6 48 384 2688 actor-location 8 21 168 3 24 192 1344 verb-object 9 56 504 8 72 576 4032 verb-direction 4 84 336 12 48 384 2688 object-direction 6 56 336 8 48 384 2688 object-location 6 28 168 4 24 192 1344
actor-verb-object 36 14 504 2 72 576 4032
actor-verb-direction 16 21 336 3 48 384 2688
actor-object-direction 24 14 336 2 48 384 2688 verb-object-direction 12 28 336 4 48 384 2688
sentence 72 7 504 1 72 576 4032
Figure 4: (top) Key frames from sample stimuli. (bottom) Dataset statistics for single constituent, joint constituent pair, joint constituent triple, and independent sentence analyses. (a) Number of classes. (b) Num-ber of training samples per subject, fold, and class. (c) NumNum-ber of training samples per subject and fold (a × b = e × 7). (d) Number of test samples per subject, fold, and class. (e) Number of test samples per subject and fold (a × d). (f) Number of test samples per subject (e × 8). (g) Number of test samples (f × 7). The number of classes and number of test samples for independent and joint analyses for corresponding constituent pairs and triples are the same. No classifiers were trained for the independent constituent pair and triple analyses as these used the single-constituent classifiers. The number of training samples for the sentence analysis is the hypothetical number for a joint classifier that was not trained; only independent classification was attempted due to insufficient training-set size.
analysis chance mean stddev 1 2 3 4 5 6 7 actor 0.2500 0.3333∗∗∗ 0.045 0.304∗∗ 0.314∗∗∗ 0.356∗∗∗ 0.352∗∗∗ 0.332∗∗∗ 0.323∗∗∗ 0.352∗∗∗ verb 0.3333 0.7892∗∗∗ 0.079 0.776∗∗∗ 0.674∗∗∗ 0.830∗∗∗ 0.816∗∗∗ 0.870∗∗∗ 0.776∗∗∗ 0.783∗∗∗ object 0.3333 0.5980∗∗∗ 0.067 0.554∗∗∗ 0.542∗∗∗ 0.623∗∗∗ 0.660∗∗∗ 0.663∗∗∗ 0.575∗∗∗ 0.569∗∗∗ direction 0.5000 0.8460∗∗∗ 0.076 0.846∗∗∗ 0.763∗∗∗ 0.930∗∗∗ 0.823∗∗∗ 0.880∗∗∗ 0.807∗∗∗ 0.872∗∗∗ location 0.5000 0.7128∗∗∗ 0.110 0.698∗∗∗ 0.615∗∗ 0.677∗∗∗ 0.734∗∗∗ 0.755∗∗∗ 0.797∗∗∗ 0.714∗∗∗ actor-verb 0.0833 0.2579∗∗∗ 0.063 0.210∗∗∗ 0.214∗∗∗ 0.302∗∗∗ 0.264∗∗∗ 0.292∗∗∗ 0.259∗∗∗ 0.266∗∗∗
actor&verb 0.0833 0.2686∗∗∗ 0.054 0.236∗∗∗ 0.220∗∗∗ 0.295∗∗∗ 0.293∗∗∗ 0.295∗∗∗ 0.252∗∗∗ 0.288∗∗∗
actor-object 0.0833 0.1756∗∗∗ 0.055 0.123∗∗ 0.158∗∗∗ 0.193∗∗∗ 0.220∗∗∗ 0.184∗∗∗ 0.175∗∗∗ 0.175∗∗∗
actor&object 0.0833 0.2061∗∗∗ 0.041 0.167∗∗∗ 0.170∗∗∗ 0.224∗∗∗ 0.229∗∗∗ 0.233∗∗∗ 0.208∗∗∗ 0.212∗∗∗
actor-direction 0.1250 0.2504∗∗∗ 0.084 0.198∗∗∗ 0.195∗∗∗ 0.302∗∗∗ 0.263∗∗∗ 0.227∗∗∗ 0.273∗∗∗ 0.294∗∗∗
actor&direction 0.1250 0.2846∗∗∗ 0.071 0.260∗∗∗ 0.258∗∗∗ 0.313∗∗∗ 0.323∗∗∗ 0.289∗∗∗ 0.234∗∗∗ 0.315∗∗∗
actor-location 0.1250 0.2031∗∗∗ 0.095 0.161 0.177∗ 0.245∗∗∗ 0.141 0.203∗∗ 0.297∗∗∗ 0.198∗∗
actor&location 0.1250 0.2403∗∗∗ 0.079 0.208∗∗ 0.182∗ 0.240∗∗∗ 0.224∗∗∗ 0.245∗∗∗ 0.302∗∗∗ 0.281∗∗∗
verb-object 0.1111 0.4958∗∗∗ 0.092 0.523∗∗∗ 0.389∗∗∗ 0.540∗∗∗ 0.545∗∗∗ 0.595∗∗∗ 0.462∗∗∗ 0.417∗∗∗
verb&object 0.1111 0.4794∗∗∗ 0.089 0.439∗∗∗ 0.366∗∗∗ 0.514∗∗∗ 0.547∗∗∗ 0.589∗∗∗ 0.437∗∗∗ 0.464∗∗∗ verb-direction 0.2500 0.7143∗∗∗ 0.111 0.737∗∗∗ 0.581∗∗∗ 0.766∗∗∗ 0.727∗∗∗ 0.828∗∗∗ 0.596∗∗∗ 0.766∗∗∗ verb&direction 0.2500 0.6711∗∗∗ 0.115 0.661∗∗∗ 0.505∗∗∗ 0.784∗∗∗ 0.682∗∗∗ 0.766∗∗∗ 0.625∗∗∗ 0.674∗∗∗
object-direction 0.1667 0.3906∗∗∗ 0.094 0.354∗∗∗ 0.276∗∗∗ 0.456∗∗∗ 0.453∗∗∗ 0.471∗∗∗ 0.365∗∗∗ 0.359∗∗∗
object&direction 0.1667 0.4621∗∗∗ 0.100 0.427∗∗∗ 0.346∗∗∗ 0.544∗∗∗ 0.513∗∗∗ 0.542∗∗∗ 0.414∗∗∗ 0.448∗∗∗
object-location 0.1667 0.5513∗∗∗ 0.107 0.604∗∗∗ 0.557∗∗∗ 0.599∗∗∗ 0.505∗∗∗ 0.536∗∗∗ 0.599∗∗∗ 0.458∗∗∗
object&location 0.1667 0.5000∗∗∗ 0.110 0.453∗∗∗ 0.437∗∗∗ 0.469∗∗∗ 0.557∗∗∗ 0.563∗∗∗ 0.552∗∗∗ 0.469∗∗∗
actor-verb-object 0.0278 0.1434∗∗∗ 0.045 0.125∗∗∗ 0.099∗∗∗ 0.179∗∗∗ 0.177∗∗∗ 0.161∗∗∗ 0.149∗∗∗ 0.113∗∗∗
actor&verb&object 0.0278 0.1687∗∗∗ 0.042 0.135∗∗∗ 0.123∗∗∗ 0.184∗∗∗ 0.193∗∗∗ 0.210∗∗∗ 0.161∗∗∗ 0.174∗∗∗
actor-verb-direction 0.0625 0.2139∗∗∗ 0.061 0.188∗∗∗ 0.172∗∗∗ 0.279∗∗∗ 0.203∗∗∗ 0.253∗∗∗ 0.180∗∗∗ 0.224∗∗∗
actor&verb&direction 0.0625 0.2333∗∗∗ 0.075 0.201∗∗∗ 0.182∗∗∗ 0.271∗∗∗ 0.284∗∗∗ 0.260∗∗∗ 0.185∗∗∗ 0.250∗∗∗
actor-object-direction 0.0417 0.0867∗∗∗ 0.040 0.083∗∗∗ 0.068∗ 0.117∗∗∗ 0.060 0.096∗∗∗ 0.099∗∗∗ 0.083∗∗∗
actor&object&direction 0.0417 0.1633∗∗∗ 0.055 0.138∗∗∗ 0.107∗∗∗ 0.185∗∗∗ 0.206∗∗∗ 0.198∗∗∗ 0.138∗∗∗ 0.172∗∗∗
verb-object-direction 0.0833 0.3255∗∗∗ 0.102 0.375∗∗∗ 0.182∗∗∗ 0.318∗∗∗ 0.401∗∗∗ 0.417∗∗∗ 0.289∗∗∗ 0.297∗∗∗
verb&object&direction 0.0833 0.3679∗∗∗ 0.110 0.339∗∗∗ 0.227∗∗∗ 0.445∗∗∗ 0.430∗∗∗ 0.474∗∗∗ 0.305∗∗∗ 0.357∗∗∗ sentence& 0.0139 0.1384∗∗∗ 0.043 0.113∗∗∗ 0.087∗∗∗ 0.149∗∗∗ 0.167∗∗∗ 0.168∗∗∗ 0.135∗∗∗ 0.149∗∗∗ Table 4: Per-subject classification accuracy, including means and standard deviations across subjects, for different classifiers, averaged across fold. Joint classifiers are indicated with ‘-’. Independent classifiers are indicated with ‘&’.
Figure 5: (top) Per-subject classification accuracy for actor, verb, object, direction, location, and sentence across the different folds and corresponding confusion matrices aggregated across subject and fold. Note that they are largely diagonal. (bottom) Cross-subject variants of top.
Figure 6: Per-subject comparison of joint (left) vs. independent (right) classification accuracy for constituent pairs and triples across the different folds.
Figure 7: (left) Searchlight analysis indicating the classification accuracy of different brain regions on the anatomical scans from subjects 1–7 averaged across stimulus, class, and run. (right) Thresholded SVM coefficients for subjects 1–7, back-projected onto the anatomical scan, aggregated across run.
bit all good
analysis acc mcc acc mcc acc mcc
actor-verb 0.6607 0.1600 0.3006 0.2371 0.4250 0.3724 actor-object 0.7059 0.1475 0.2584 0.1910 0.3983 0.3430 actor-direction 0.6336 0.1266 0.3363 0.2412 0.4398 0.3603 actor-location 0.6763 0.1149 0.2723 0.1665 0.3736 0.2807 verb-object 0.6709 0.3419 0.4712 0.4051 0.6433 0.5959 verb-direction 0.7422 0.4172 0.6440 0.5433 0.7703 0.7048 object-direction 0.6544 0.2946 0.4475 0.3370 0.6305 0.5560 object-location 0.6235 0.2537 0.4754 0.3702 0.5897 0.5067
actor-verb-object 0.8093 0.1833 0.1262 0.1010 0.2751 0.2521
actor-verb-direction 0.7403 0.1979 0.1916 0.1432 0.3409 0.3004
actor-object-direction 0.8344 0.1314 0.1250 0.0867 0.2661 0.2352 verb-object-direction 0.7154 0.3318 0.2850 0.2267 0.5006 0.4594
Table 5: Comparison of independent classifiers with joint classifiers, aggregated across subject and fold. ‘Acc’ denotes accuracy and ‘mcc’ denotes Matthews correlation coefficient (MCC). The ‘bit’ values involve computing a binary correct/incorrect label for each sample with both the independent and joint classifiers and computing the accuracy and MCC over the samples between the independent and joint classifiers. The ‘all’ values involve computing a (nonbinary) class label for each sample with both the independent and joint classifiers and computing the accuracy and MCC over the samples between the independent and joint classifiers. The ‘good’ values involved computing accuracy and MCC over the samples between the independent and joint classifiers for only those ‘all’ samples where the joint classifier is correct.
\ i independenti [ i independenti analysis 1 2 3 4 5 6 7 mean actor-verb 0.78% 5.75% 3.55% 3.39% 4.44% 2.57% 2.63% 3.30% actor-object 3.72% 4.73% 14.46% 3.85% 3.61% 8.98% 7.85% 6.74% actor-direction 1.52% 1.24% 4.67% 1.15% 0.87% 1.81% 0.90% 1.74% actor-location 0.81% 0.56% 3.16% 1.05% 1.22% 0.65% 1.83% 1.32% verb-object 8.21% 25.32% 9.59% 18.34% 22.04% 9.60% 11.78% 14.98% verb-direction 1.11% 2.08% 0.18% 0.59% 3.74% 0.73% 0.00% 1.20% object-direction 13.39% 11.72% 9.78% 8.85% 3.77% 8.65% 2.84% 8.43% object-location 1.47% 7.15% 5.61% 5.14% 3.02% 1.47% 7.52% 4.48%
actor-verb-object 0.28% 2.14% 1.25% 1.16% 1.47% 1.05% 1.45% 1.26%
actor-verb-direction 0.02% 0.15% 0.00% 0.01% 0.22% 0.04% 0.00% 0.06%
actor-object-direction 0.60% 0.57% 1.79% 0.27% 0.18% 0.89% 0.25% 0.65% verb-object-direction 0.14% 0.96% 0.08% 0.20% 1.76% 0.27% 0.00% 0.49%
mean 2.67% 5.20% 4.51% 3.67% 3.86% 3.06% 3.09% 3.72% [ i independenti ! ∩ joint |joint| analysis 1 2 3 4 5 6 7 mean actor-verb 73.84% 84.17% 29.37% 69.92% 84.69% 62.24% 67.68% 67.42% actor-object 58.13% 70.01% 12.69% 48.66% 58.19% 50.56% 42.26% 48.64% actor-direction 70.57% 76.98% 44.23% 53.25% 92.59% 81.29% 60.79% 68.53% actor-location 77.87% 78.21% 43.04% 60.20% 85.62% 84.59% 56.04% 69.37% verb-object 87.64% 91.44% 47.81% 79.92% 95.24% 72.63% 82.00% 79.53% verb-direction 78.78% 91.95% 38.70% 57.35% 91.39% 76.85% 86.66% 74.53% object-direction 70.03% 38.04% 71.44% 73.35% 63.40% 81.09% 64.41% 65.97% object-location 72.66% 97.45% 95.52% 87.33% 75.24% 68.75% 57.12% 79.15%
actor-verb-object 19.80% 21.10% 9.13% 12.40% 52.40% 42.90% 13.60% 24.48%
actor-verb-direction 67.37% 69.78% 28.90% 44.15% 95.21% 56.72% 53.88% 59.43%
actor-object-direction 57.39% 21.04% 10.21% 38.26% 52.20% 43.39% 41.94% 37.78% verb-object-direction 57.12% 66.48% 47.87% 42.93% 82.05% 43.58% 45.87% 55.13%
mean 65.93% 67.22% 39.91% 55.64% 77.35% 63.72% 56.02% 60.83%
Table 6: Per-subject quantitative comparison of the brain regions indicated by searchlight of the independent classifiers to the joint classifiers, for all constituent pairs and triples, together with means across subject, means across analysis, and means across both. (top) The percentage of voxels in the union of the constituents