HAL Id: hal-00317524
https://hal.archives-ouvertes.fr/hal-00317524
Submitted on 28 Feb 2005
HAL is a multi-disciplinary open access
archive for the deposit and dissemination of
sci-entific research documents, whether they are
pub-lished or not. The documents may come from
teaching and research institutions in France or
abroad, or from public or private research centers.
L’archive ouverte pluridisciplinaire HAL, est
destinée au dépôt et à la diffusion de documents
scientifiques de niveau recherche, publiés ou non,
émanant des établissements d’enseignement et de
recherche français ou étrangers, des laboratoires
publics ou privés.
Location (WWLL) network: Post-algorithm upgrade
C. J. Rodger, J. B. Brundell, R. L. Dowden
To cite this version:
C. J. Rodger, J. B. Brundell, R. L. Dowden. Location accuracy of VLF World-Wide Lightning
Location (WWLL) network: Post-algorithm upgrade. Annales Geophysicae, European Geosciences
Union, 2005, 23 (2), pp.277-290. �hal-00317524�
SRef-ID: 1432-0576/ag/2005-23-277 © European Geosciences Union 2005
Annales
Geophysicae
Location accuracy of VLF World-Wide Lightning Location
(WWLL) network: Post-algorithm upgrade
C. J. Rodger1, J. B. Brundell2, and R. L. Dowden2
1Department of Physics, University of Otago, Dunedin, New Zealand 2LFEM Research Ltd., 161 Pine Hill Road, Dunedin, New Zealand
Received: 2 June 2004 – Revised: 20 October 2004 – Accepted: 19 November 2004 – Published: 28 February 2005
Abstract. An experimental VLF World-Wide Lightning
Lo-cation (WWLL) network has been developed through col-laborations with research institutions across the globe. The aim of the WWLL is to provide global real-time locations of lightning discharges, with >50% CG flash detection effi-ciency and mean location accuracy of <10 km. While these goals are essentially arbitrary, they do define a point where the WWLL network development can be judged a success, providing a breakpoint for a more stable operational mode. The current network includes 18 stations which cover much of the globe. As part of the initial testing phase of the WWLL the network operated in a simple mode, sending the station trigger times into a central processing point rather than mak-ing use of the sferic Time of Group Arrival (TOGA). In this paper the location accuracy of the post-TOGA algorithm WWLL network (after 1 August 2003) is characterised, pro-viding estimates of the globally varying location accuracy for this network configuration which range over 1.9–19 km, with the global median being 2.9 km, and the global mean 3.4 km. The introduction of the TOGA algorithm has significantly improved the location accuracies.
The detection efficiency of the WWLL is also considered. In the selected region the WWLL detected ∼13% of the total lightning, suggesting a ∼26% CG detection efficiency and a ∼10% IC detection efficiency. Based on a comparison be-tween all WWLL good lightning locations in February–April 2004, and the activity levels expected from satellite obser-vations we estimate that the WWLL is currently detecting
∼2% of the global total lightning, providing good locations for ∼5% of global CG activity. The existing WWLL network is capable of providing real-time positions of global thunder-storm locations in its current form.
Key words. Meteorology and atmospheric dynamics
(Light-ning; Atmospheric electricity; Instruments and techniques)
Correspondence to: C. J. Rodger
1 Introduction
Lightning discharges are powerful impulsive sources of elec-tromagnetic energy over a wide bandwidth (well beyond the optical), with significant radiated electromagnetic power from a few hertz to several hundred megahertz (Magono, 1980), and the bulk of the energy radiated in the frequency bands <30 kHz (Pierce, 1977). Passive lightning location methods rely upon the energy released by the lightning discharge, acoustically (thunder), optically (lightning), and in the radio frequency spectrum (Uman, 1987). Today, commercial lightning location networks are in operation in many regions of the world, using multiple stations to lo-cate the source of lightning electromagnetic radiation pulses (Rakov and Uman, 2003). The economic advantages that many groups obtain from accurate and virtually instanta-neous lightning location data, results in this data being in high demand from many industries, such as electricity gen-erators and distributors, aviation, forestry, sporting groups, insurance companies and weather forecasters (Cummins et al., 1998a). In addition to these groups, there is also strong scientific interest in the application of lightning data to a wide range of research topics, including lightning and re-lated thunderstorm processes (Lyons et al., 1998), severe weather warning (Knupp et al., 2003), high altitude dis-charges (Rodger, 1999), global warming (Williams, 1992; Schlegel et al., 2001), regional meteorological processes (Hamid et al., 2001), production of important trace chemicals (Jourdain and Hauglustaine, 2001), determination of iono-spheric parameters (Cummer et al., 1998), and losses from the Van Allen radiation belts (Rodger et al., 2003).
Multi-station lightning location systems generally con-sist of a number of spatially separated receiver stations po-sitioned on the surface of the Earth (although some sin-gle station techniques also exist, e.g. Huang et al., 1999). The information from each station is, on its own, insuffi-cient to enable the location of the discharge to be deter-mined. However, when the information from some or all of the stations is combined together at a central site, the location of the discharge can be determined. An example is the United States National Lightning Detection Network
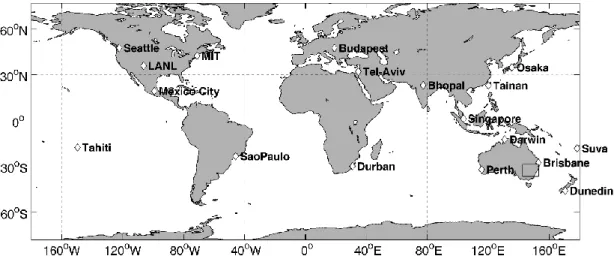
Fig. 1. Locations of the 18 VLF receiving stations (shown as diamonds) currently returning lightning trigger times to the processing stations (Dunedin and Seattle) as of mid-May 2004. The location of the WWLL Kattron comparison region is shown by the black square in Australia.
(NLDN), which in 1996 used 106 sensors located over the continental United States to achieve a typical accuracy of 0.5 km (Cummins et al., 1998b). Many commercial lightning detection networks require such high location accuracies to allow electrical power transmission companies to quickly lo-cate lightning-produced line faults or to assist insurance in-spectors in checking claims. Such networks rely upon the first few microseconds of the lightning pulse received in the MF band (0.3–3 MHz), thus avoiding the sky wave (that which reflects from the ionosphere), and processing only the ground wave (which has high attenuation at the high fre-quencies used). Thus, NLDN requires >100 ground stations to cover the contiguous US (∼107km2), corresponding to a ground station density of ∼10 Mm−2. Such a high density of stations makes these systems poorly suited for coverage of areas with low population density (leading to financial con-straints), or economic development, or across the oceans.
Low-Frequency Electromagnetic Research Ltd. has cre-ated an experimental VLF World-wide Lightning Location (WWLL) network through collaborations with research in-stitutions across the globe (Fig. 1 shows the current network configuration). The network exploits the considerable elec-tromagnetic power radiated by lightning as “sferics” present in the VLF band (3–30 kHz). Very long range remote sens-ing is possible; these VLF signals can be received thousands of kilometres from the source (Crombie, 1964), as the elec-tromagnetic energy propagates with low attenuation inside the waveguide formed by the conducting Earth and the lower boundary of the ionosphere, termed the Earth-Ionosphere Waveguide (EIWG). The vertical electric field from strong lightning dominates over power line noise in the receiver bandwidth (6-22 kHz), such that the WWLL receiving sta-tions have relative freedom from the restriction of noise-free receiver locations required for other long-range lightning lo-cation techniques (e.g. Fullekrug and Constable, 2000). The use of differing sferic frequency ranges in multi-station light-ning location networks has been discussed by Cummins and
Murphy (2000) and Dowden et al. (2002). The aim of the WWLL is to provide real-time locations of cloud-to-ground lightning discharges occurring anywhere on the globe, with
>50% flash detection efficiency and mean location accuracy of <10 km.
In the initial testing phase of the WWLL network (pre-August 2003), the stations operated in a simple mode, send-ing the trigger time, relative to GPS, back to the central sta-tion (in Dunedin, New Zealand) for processing, to produce a lightning location. The location accuracy and detection efficiency of the early network configuration was tested by contrasting WWLL network locations over 2 days in January 2002 with those from a commercial lightning location sys-tem, Kattron, based in Australia (Rodger et al., 2004). The data sets were limited to a relatively small part of Australia where Kattron has its highest performance, with location ac-curacies of ∼1 km or better and >80% detection efficiency for Cloud-to-Ground (CG) lightning discharges. After this selection there were 426 matched lightning events, corre-sponding to lightning discharges with large lightning return stroke peak currents. The WWLL network detected events had a mean absolute peak current of ∼26 kA compared with
∼12 kA for all Kattron events. This reflects the very low de-tection efficiency of the WWLL network at this time (∼1%), when the triggering thresholds were set high to avoid net-work saturation. By considering the random errors in the difference locations between the matching lightning events, an appropriate Gaussian timing error for the WWLL network of receiving stations was determined (∼35 µs), allowing an estimate of the global location errors for the then 11-station network to be calculated, and presented as location accu-racy maps. The “worst-case” global location error found ranged spatially from 7.5–100 km, with the global median being 15 km, and the global mean 30 km.
The location accuracy of the WWLL network has also been tested by contrasting March 2003 commercial light-ning data from Brazil (Lay et al., 2004). At this time all
the VLF lightning receivers in the network were very distant (>7000 km) from the thunderstorms. This study found that WWLL detection was highly dependent upon the peak re-turn stroke current, resulting in a 0.3% stroke detection rate favouring strokes of >50 kA. The detected strokes had a lo-cation accuracy of 20.25 ±13.5 km, consistent with the maps given in Rodger et al. (2004), with temporal accuracy of 0.06
±0.2 ms. Lay et al. (2004) concluded that the WWLL net-work data could provide spatial resolution on the order of magnitude of an isolated thunderstorm even at >7 Mm from the receiver locations, allowing an indication of global light-ning activity in real time (if not individual flashes).
For many scientific applications, the benefits of a global overview in real time can outweigh the very low total light-ning detection. Observations of red sprites undertaken from the space shuttle Columbia during the ill-fated STS107 mis-sion used WWLL activity maps available from the Inter-net to orientate the shuttle (Yair et al., 2004), allowing for some predication of where active thunderstorms containing the large lightning events which produce red sprites would be located.
On 1 August 2003 the WWLL network was upgraded to make use of a new timing algorithm to compensate for the dispersion of the VLF sferic due to EIWG propagation. Prop-agation over long ranges in the EIWG disperses the initial sharp pulse of the lightning stroke into a wave train last-ing a millisecond or more. The amplitude of the received sferic wave train rises slowly (over a few hundred microsec-onds) from the noise floor, so there is no sharp onset and no sharply defined Time of Arrival (TOA) at the receiving sta-tion. In the new algorithm a measurement is made of the time of group arrival (TOGA) of the sferic wave train received at each station, determined relative to GPS at each site from the progression of phase versus frequency using the whole wave-form (Dowden et al., 2002). The TOGA method avoids the requirement of transmitting the entire VLF waveform back to a central station for processing; the lightning locations can be determined from differences in the TOGA times using well developed residual minimization methods employed in loca-tion techniques based on arrival time differences (e.g. Lee, 1986). The introduction of the TOGA method means that dispersion due to VLF propagation is now much less impor-tant in the observations (in theory, such dispersion is removed altogether), such that the uncertainties in arrival times should now be independent of the distribution of lightning source-receiver distances. As the waveform need not be transmitted, Internet costs associated with long-range lightning location data-transfers are decreased, and “normal” Internet transmis-sion (e.g. User Datagram Protocol)) can provide acceptable real-time lightning location (<10 s) without the requirement of special broad-band connections.
In this paper we characterise the location accuracy of the post-TOGA algorithm WWLL network, by comparing the WWLL locations with lightning location data which were purchased from the Kattron commercial Australian lightning location network. This therefore provides a direct contrast between the pre-TOGA algorithm WWLL network location
accuracies considered by earlier studies. We go on to esti-mate the location accuracy of the global network of WWLL receiving stations as currently operating, and estimate the de-tection efficiency of the existing network.
2 WWLL network description
The basic operation of the WWLL receiving stations, the lo-cation finding process, and TOGA calculation are described in Dowden et al. (2002), while network operation issues asso-ciated with stroke selection and data management have been discussed in Rodger et al. (2004).
2.1 VLF receiving stations
All of the current VLF WWLL receiving stations are located in built-up areas unsuitable for use of magnetic loop antennas at VLF, because power line interference will dominate over the magnetic field of the sferic. However, this is not true for the sferic electric field because at VLF even poor conductors such as ferroconcrete buildings, remain at ground potential and shield man-made electric fields generated within them. Consequently, the WWLL receiving stations require only a short (1.5 m) whip antenna on a tall building to measure the vertical electric field of the sferic TM waveguide mode. At the time of writing, the WWLL network consists of 18 re-ceiving stations shown as diamonds in Fig. 1 and listed in Table 1. Dual processing stations are located in Dunedin (New Zealand) and Seattle (USA). Further receiver stations are planned for South America and Central Asia. However, as seen in Fig. 1, the stations are far from being uniformly spaced, despite the rapid growth over the last 3 years. The network P. I. (R. L. Dowden) would be pleased to hear from anyone who could help bridge the larger gaps, particularly in and around Africa. The lightning receiving station at each research institute is provided by the project but each host meets local costs (processing computer and Internet). In re-turn, the hosts are provided with archival lightning data from the world-wide network.
2.2 Sferic selection
Rodger et al. (2004) reported on the algorithm by which each timing measurement from the stations are combined to select a common stroke. This process is still used, although with TOGA measurements rather than TOAs. The Rodger study also outlined the maximum trigger rate limitation used to pre-vent a single receiving station from flooding the processing stations with bad observations, such that no sensible light-ning location estimates are possible. It should be noted that in practise this means that thunderstorms occurring nearby (maybe ∼100 km) from a station will significantly degrade the information from that station, as most of the triggers will only be “local” to that station. In addition to the limitation on the maximum trigger rate, receiving stations now undertake tests on the observed sferic before passing the TOGA back for processing. As part of the processing of each sferic at the
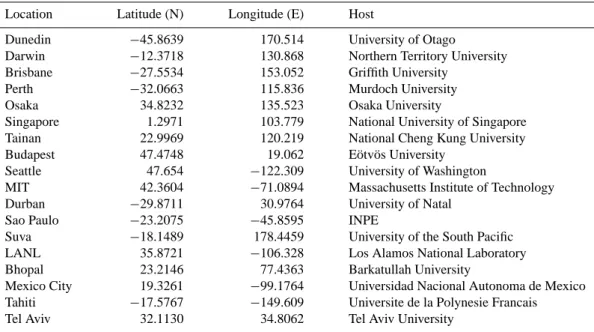
Table 1. Locations and hosts of the 18VLF receiving stations currently operating in the VLF World-wide Lightning Location Network. Location Latitude (N) Longitude (E) Host
Dunedin −45.8639 170.514 University of Otago
Darwin −12.3718 130.868 Northern Territory University Brisbane −27.5534 153.052 Griffith University
Perth −32.0663 115.836 Murdoch University Osaka 34.8232 135.523 Osaka University
Singapore 1.2971 103.779 National University of Singapore Tainan 22.9969 120.219 National Cheng Kung University Budapest 47.4748 19.062 E¨otv¨os University
Seattle 47.654 −122.309 University of Washington
MIT 42.3604 −71.0894 Massachusetts Institute of Technology Durban −29.8711 30.9764 University of Natal
Sao Paulo −23.2075 −45.8595 INPE
Suva −18.1489 178.4459 University of the South Pacific LANL 35.8721 −106.328 Los Alamos National Laboratory Bhopal 23.2146 77.4363 Barkatullah University
Mexico City 19.3261 −99.1764 Universidad Nacional Autonoma de Mexico Tahiti −17.5767 −149.609 Universite de la Polynesie Francais Tel Aviv 32.1130 34.8062 Tel Aviv University
receiving station, a measurement is made of sferic sion (caused by propagation in the EIWG). While the disper-sion can be zero (as it is for the TEM mode, or for short dis-tance propagation in any mode), no genuine physical cause can make the dispersion negative. Thus, only events with non-negative dispersion are treated as real sferics, and their TOGA is transmitted to the processing stations. Spurious events fail this test, and may be due to man-made interference (e.g. electric fences), two sferics overlapping in time at the receiver, or from one sferic being poorly distorted by modal interference. While the latter cases are not strictly “unreal” sferics, they are examples of situations where the TOGA cal-culation (Dowden et al., 2002) will not be meaningful. It is important to point out that most spurious effects affect a sin-gle station at a given moment: sferics from different strokes, Mms apart, are unlikely to overlap at more than two stations at the same time; man-made pulses are likely to be local and appear at only one station; interference peaks from two or more VLF transmitters momentarily in phase cannot appear at two stations at the same time. While genuine sferics may be discarded at one station, the stroke is not necessarily lost, provided that at least 4 other stations observe the sferic. The limitations above serve to decrease the processing load on the processing stations and avoid unnecessary Internet charges.
3 Comparison with commercial lightning location data
We have re-examined the location accuracy of the WWLL network after the implementation of the TOGA algorithm, by making a comparison with Kattron commercial lightning locations following the pre-TOGA algorithm approach out-lined in Rodger et al. (2004).
3.1 Kattron lightning location data
Kattron, an Australian based company, operates a commer-cial TOA (Time of Arrival) lightning location network, us-ing a network of 7 LPATS TOA receivers (Cummins et al., 1998b), positioned to achieve sub-kilometre location accu-racy and high detection efficiencies (>80%) over most of the regions of Australia with high population densities, lo-cated in the south-east of the country. A description of the location accuracies and detection efficiency of this network has been presented earlier (Brundell et al., 2002; Rodger et al., 2004). Kattron data was purchased for 13 January 2004. This day was selected on the basis of WWLL network ob-servations showing strong thunderstorm activity inside the Kattron 7-station network. The data purchased included lo-cations for all the lightning strokes located by Kattron on this UT-day, and thus many well outside the Kattron receiver net-work. Following Rodger et al. (2004), the Kattron data set was limited to a region in SE Australia where the modelled Kattron rms location accuracy is ∼1 km or better, and the CG detection efficiency is >80% (Brundell et al., 2002).
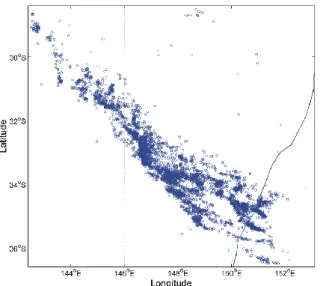
The 19 313 CG strokes reported by Kattron inside this re-gion on 13 January 2004 are shown as black dots in the right-hand panel of Fig. 2. Also shown in this panel are red dots, indicating the locations of 869 Kattron-reported intracloud (IC) lightning flashes (sometimes simply termed “cloud flashes”). In general, it is understood that there are
∼3.5 times more IC lightning flashes than CG flashes (Mack-erras et al., 1998), and thus one might expect there to be considerably more IC events present in Fig. 2. However, the LPATS receiver technology is strongly focused towards the detection and accurate location of the stronger CG dis-charges, and has a fairly low IC detection efficiency. For
Fig. 2. Positions of lightning events on 13 January 2004 detected inside our selected region by the WWLL network (11 609 events, left panel) and Kattron (19 313 CGs, right panel). The WWLL data has been restricted to “good” location data (≤20 µs). The red dots in the Kattron panel show cloud discharge locations (869 events), while the blue line in both panels is part of the east coast of Australia.
example, the Canadian Lightning Detection Network has a 1–4% detection efficiency for cloud flashes (roughly consis-tent with the apparent Kattron IC efficiency), while the de-tection efficiency for ground flashes is 85–90% (Burrows et al., 2002). On 13 January 2004 Kattron reported a total of 22,347 CG discharges, some as far away as Borneo. This to-tal is only ∼15% larger than that reported by Kattron in the selected region, indicating the strong fall off in detection ef-ficiency beyond the ring of Kattron receivers located in SE Australia. A similar situation exists with the NLDN beyond the continental United States.
The lightning activity seen in Fig. 2 occurs almost entirely during the daylight hours, such that we cannot examine local diurnal variations from VLF propagation effects. However, note that signal attenuation for VLF propagation is higher for the daytime ionosphere than for the night, as this would be the worst case (albeit when most lightning also occurs).
3.2 WWLL network lightning location data
Figure 2 also shows the lightning discharge locations re-ported by the WWLL network inside the selected region on 13 January 2004. In the WWLL-employed location algo-rithm, a residual time is provided for each event, provid-ing an indication of the error remainprovid-ing after the minimiza-tion processes has produced a locaminimiza-tion (e.g. Lee, 1986). In our analysis only the 11,609 WWLL events with low resid-uals (≤20 µs) were included (as shown in Fig. 2), provid-ing a fairly strict requirement for “good” lightnprovid-ing loca-tions. Twenty microseconds is currently the LF*EM sug-gested residual threshold for “good” lightning, and is some-what smaller than the 50 µs limit employed by Rodger et
al. (2004). The number of WWLL events on this day in our region changes by only ∼10% if the higher threshold is em-ployed.
A comparison between the 2 panels of Fig. 2 indicates that the WWLL network appears to be very successful at tracking thunderstorms. The overall form of the figures is very simi-lar, and much of the fine structure in lightning activity levels is present in both panels. While this is no substitute for a stroke-by-stroke comparison (undertaken below), it appears to confirm the conclusion that the WWLL can provide accu-rate tracking of large-scale electrical phenomena (Lay et al., 2004), such as the discharges in a frontal squall line seen in this figure.
3.3 Coincident lightning
In order to make comparisons between the location estimates for CG lightning discharges by the Kattron network and WWLL network data, WWLL events were selected which occurred within ±3 ms and 50 km of a lightning event de-tected by Kattron inside the selected region, where the WGS-84 Ellipsoid was used to determine the distance difference. The choice of the time/space window limits are rather arbi-trary, but follow those used in earlier studies (Rodger et al., 2004; Lay et al., 2004). On the basis of the following re-sults we argue that these time/space limitations are sufficient to determine all matching events in the two data sets. Under these restrictions a total of 5006 matching lightning events were found, i.e. that the WWLL network detected ∼26% of the CG discharges reported by the Kattron network. Note that this is a very large increase from the pre-TOGA algo-rithm study, where only ∼1% detection efficiency was found,
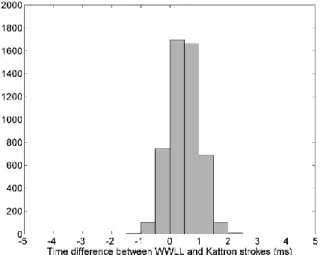
Fig. 3. Absolute value of the time differences (WWLL - Kattron) between the 5006 matching events detected by the WWLL and Kat-tron networks.
Fig. 4. Distribution of return stroke peak currents determined by the Kattron lightning network. The dark bars show the distribution for all Kattron lightning events, while the lighter events show the current distribution for those events which were also detected by the post-TOGA WWLL network.
albeit during a period when the triggering thresholds were set high. The time differences between the Kattron and WWLL events are shown in Fig. 3 where the mean time difference is 0.49 ms. The distribution peaks at ∼0.5 ms as the Kat-tron data is provided with 1-ms resolution, while the WWLL lightning data has 1-µs resolution. This rounding of the Kat-tron event times means that we expect a systematic 0.5-ms difference between coincident events given in the two data sets. Note that there are almost no matching lightning events with time differences greater than ±2 ms, giving us good confidence that we are correctly identifying coincident light-ning observations.
The distribution of Kattron-detected lightning return stroke peak currents are shown in Fig. 4 (blue bars). Note that the Kattron-estimated return stroke peak currents are
Fig. 5. The positions of the matching lightning events as determined by the Kattron (magenta diamonds) and WWLL data sets (closed circles), in the same format as Fig. 2.
based on lightning return-stroke speeds, and as measured return-stroke speeds typically have uncertainties of ±50% (see MacGorman and Rust, 1998), it should be noted that these currents may carry the same uncertainty. However, it appears that the currents reported by the US NLDN are more accurate than this uncertainty would suggest. Direct mea-surements of triggered lightning indicates that NLDN may actually underestimate lightning currents by around ∼20% (Vladimir Rakov, personal communication, 2004).
As expected, the majority of cloud-to-ground (CG) strokes detected by Kattron are of negative polarity and relatively small peak currents, with the mean absolute peak current for all 19 313 CG strokes detected on these 2 days being 13.8 kA and ∼6.5% of the discharges having positive polarity. The red bars in Fig. 4 show the Kattron determined peak cur-rents for the lightning events which were also detected by the WWLL network. While this plot suggests that the WWLL network tends to detect CGs with larger return stroke peak currents, the mean absolute current for the agreed events is 14.3 kA, essentially the same as the Kattron data set. This is a major change from the pre-TOGA network data, where the mean absolute peak current of the matching events was
∼26 kA. However, this change is to be expected, as it reflects the much higher detection efficiency of the WWLL in the current study.
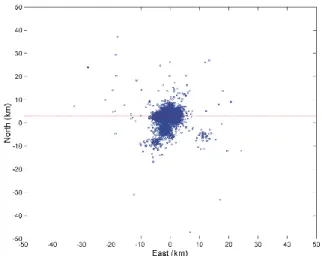
3.4 Location differences between the two networks The positions of the 5006 matching lightning events as deter-mined by the Kattron (magenta diamonds) and WWLL data sets (closed circles) are shown in Fig. 5. The clustering in this figure is very high, such that generally the two data sets lie on top of one another. From the clustering of matching event locations it appears that the WWLL network is success-fully determining the location of lightning discharges with
much improved accuracy. The pre-TOGA WWLL network showed a strong eastwards offset relative to Kattron (Rodger et al., 2004), which was not present in the Brazilian com-parison (Lay et al., 2004). At the time it was suggested that the eastwards offset present in the Australasian sector might be a consequence of an interference problem at the Dunedin station, corrected in July 2003. This problem ap-pears to be associated with the hardware/software combina-tion of the Dunedin based CPC and WWLL receiving stacombina-tion. Once these duties were split between two fresh machines, the problem seems to have disappeared. Figure 5 suggests that this offset has been corrected. This is confirmed in Fig. 6, which shows the east-west and north-south contributions of the WGS-84 Ellipsoid determined distance differences be-tween the matched locations (WWLL minus Kattron). The dotted lines indicate the median values of the differences. These have been displaced ∼2.8 km northwards and ∼0.9 km westwards, both less than the standard deviations in the off-sets (3.5 km north-south and 2.7 km eastwards), and signif-icantly less than the total scatter in Fig. 6. There are now no statistically significant systematic offsets present in this region.
3.5 Random errors in the WWLL network
The random error present in the scatter of the differences in Fig. 6 is described by the mean (4.2 km) and standard devi-ations (2.7 km) in the location differences. As the error in the lightning locations in the Kattron data should not be cor-related with the error in the location deduced in the WWLL network data, we can assume that the random errors in the two data sets are independent. Thus, it can be said that,
σm2=σKattron2 +σWWLL2 , (1) i.e. the variance of the differences between the two data sets is equal to the sum of the variances of the error in each method. As the Kattron location error will vary across our selected region, we will take a conservative approach to es-timating the WWLL network errors, and take σKattron=0, i.e.
treat the Kattron locations as having no significant error. In this case σm should indicate the location error for “good”
lightning locations provided by the WWLL network in our selected region.
We employ a “Monte Carlo” style simulation to obtain an estimate of the location accuracy for the WWLL network (following Rodger et al., 2004). This is undertaken at each position of interest by determining the location errors for 400 (simulated) lightning discharges from which the standard de-viation of the distribution of errors is recorded as an estimate of the location accuracy of the network at that location. The above method has been implemented assuming that the errors in the location network may be modelled as Gaussian with a user-specified standard deviation, that is, described by a Gaussian timing error. Thus, the individual timing errors for each simulated discharge at each location are randomly sam-pled from a normal distribution with standard deviation given by the Gaussian timing error. Following this Monte Carlo
Fig. 6. The east-west and north-south distance differences between the 5006 lightning event locations (WWLL minus Kattron). The dotted lines indicate the median values of these differences.
location accuracy modelling we find that the representative Gaussian timing error for the post-TOGA algorithm WWLL network is ∼10 µs, 3.5 times better than the pre-TOGA algo-rithm network. Clearly, the introduction of TOGA process-ing has led to large improvements in the location accuracy of the network, as expected. This is consistent with the mean of the matched WWLL events’ residual timing errors, which is 8.9 µs. Maps of the global lightning location accuracies determined using this timing error are presented in Sect. 5.
The primary improvement in the location accuracy will be due to the introduction of the TOGA algorithm, miti-gating the effects of sferic dispersion due to propagation in the EIWG. A detailed description of the difference between the TOGA and TOA timing has been presented by Dowden et al. (2002), who also give examples of the dispersion ex-pected over the 6–22 kHz bandwidth of the WWLL station receivers. A more detailed calculation has been shown by Rodger et al. (Fig. 9, 2004) who consider the importance of the east-west anisotropy in this region.
4 Extra events in WWLL network data
In addition to the 5006 matching events found in the two data sets, there were also 6603 WWLL events, shown in Fig. 7, which did not match a Kattron lightning location. As the Kattron network is believed to have a >80% CG detection efficiency in our selected region, it is inconceivable that all of these unmatched events are missed CG discharges. How-ever, as is clear from Fig. 7, the unmatched events are lo-cated in the same locations where CGs have been detected, and track out the same thunderstorm paths seen in Fig. 5 (and the right panel of Fig. 2). Thus, it appears that the WWLL is detecting discharge events occurring inside thunderstorms which are not CGs. Similar sets of unmatched WWLL loca-tions were noted by Rodger et al. (2004) (∼65% as numerous as the matched CGs) and Lay et al. (2004) (∼130%). In the
Fig. 7. The positions of the 6603 unmatched locations from the WWLL data set (blue circles), in the same format as Figs. 2 and 5.
latter case the authors reported that a balloon-borne VLF re-ceiver operating in Brazil detected a sferic within 1 ms of the unmatched WWLL event. On this basis the previous authors have argued that the unmatched events are lightning dis-charges, but are probably cloud discharges rather than CGs. An experimental VLF lightning location network operated in the US detected ∼65% of CG discharges and ∼13% of IC discharges (Morales et al., 2004), such that roughly half the events detected were due to IC discharges. This would be roughly consistent with our finding, where the unmatched event set is ∼130% the size of the matched set of CG dis-charges. VLF observations of sferics made at Palmer station, Antarctica, believed to be from a storm in the southern USA, have been contrasted with CG observations made by NLDN (Wood and Inan, 2002), leading the authors to conclude that both ICs and CGs were present in the Palmer sferic data.
As noted above, the Kattron network detects some cloud flashes, and reported 869 IC discharges on 13 January 2004 in our selected region, allowing another check as to whether our unmatched events are real IC lightning. Of these Kattron IC discharges, 8 are found to match with the 6609 remaining WWLL events, using the same time and distance separations in Sect. 3.3. In addition, we can also consider satellite obser-vations as an extra “ground truth” data set.
The Lightning Imaging Sensor (LIS) aboard the Tropical Rainfall Measuring Mission satellite detects lightning op-tically by observing the neutral oxygen line at 777.4 nm (Orville, 1995). Comparisons of LIS, NLDN, and VHF radar lightning observations found that the LIS tends to de-tect cloud-to-ground (CG) discharges towards the end of the discharge process, probably the late stage in-cloud compo-nents of the CG discharge, occurring in the upper parts of the thundercloud. Differences of ∼1 s were possible between the NLDN and LIS detections (Thomas et al., 2000). While such timing differences will make it difficult to make direct comparisons between the WWLL locations and those
ob-served by satellite, we have examined the LIS flash obser-vations during 2 passes over our selected region, and looked for events occurring within 25 ms and 50 km of a Kattron or WWLL event. During these passes the LIS detected 248 flashes, 9 of which are found in the Kattron data set (of which 2 are present in the matched WWLL locations). We find that 9 unmatched WWLL events occur within 25 ms and 50 km of a LIS flash, with a mean separation of ∼9 km. This com-pares favourably with the LIS location error or expected un-certainty of 6–8 km. These observations provide strong evi-dence that the unmatched WWLL events are indeed caused by IC discharges.
Kattron detected 19,313 CGs in our selected region on 13 January 2004. Assuming that there are 3.5 times more IC discharges than CG, and that the Kattron detection efficiency is 100%, there should have been about 67 600 IC discharges, such that the total lightning activity (CG+IC) should have been about 86 900 lightning discharges. Of these, the WWLL detected ∼13% of the total lightning, suggesting a ∼26% CG detection efficiency and a ∼10% IC detection efficiency in this region. It is not a surprise that the CG detection effi-ciency is higher than that for ICs, as peak currents (and cur-rent moments) in CG flashes tend to be larger than for IC flashes (Uman, 1987). Furthermore, many IC flashes can be quite small in extent (e.g. Rakov and Uman, 2003), whereas a threshold distance must be achieved for a CG flash bridg-ing the main negative charge reservoir and ground. While the detection efficiencies estimated above are lower than the long-term goal of the network, they represent a considerable improvement from the earlier (pre-TOGA algorithm) detec-tion efficiencies reported by Rodger et al. (2004). We should caution that our selected region has a relatively high WWLL station density, and these detection efficiencies will not hold in general (global rates are considered in Sect. 6). However, there are some high lightning activity regions, such as North America, which have similar station densities as Australasia, and thus could have somewhat similar detection efficiencies.
5 Global location accuracy
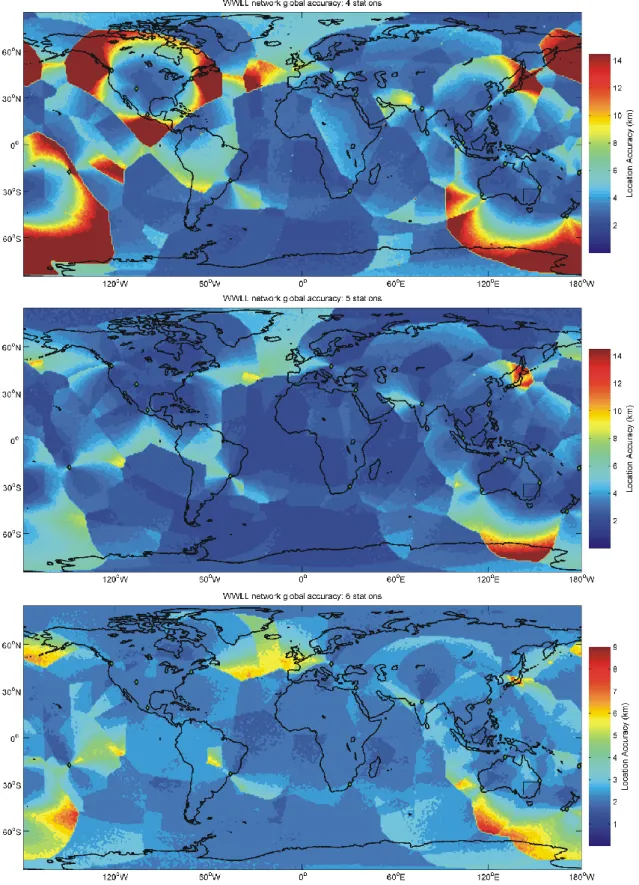
The analysis above has provided us with an estimate for the timing error of the WWLL network. Following the Monte Carlo process outlined in Rodger et al. (2004) we can esti-mate the global lightning location accuracies for the entire network of 18 receiving stations listed in Table 1, assuming that only the minimum number of receiving stations (taken to be the 4 nearest stations) is involved in each location find-ing process. This is shown in the upper panel of Fig. 8. The strong discontinuities seen in the figure are due to the requirement that only the 4 nearest stations are involved in the lightning location process, leading to artificially poor ac-curacy in the Western Pacific area where the receiving sta-tion density is higher. As discussed in Sect. 6.1, there are some parts of the world where most of the lightning loca-tions are provided by observaloca-tions from the minimum num-ber of 4 stations. However, there are some regions where the
Fig. 8. An estimate of the global location accuracy of the 18 receiving station WWLL network listed in Table 1, assuming a 10-µs timing error. The upper panel shows location accuracies assuming that only the minimum 4 receiving stations report a lightning event, while the middle and lower panels shows the same situation for 5 and 6 receiving stations, respectively.
mean number of stations involved in each lightning location observation is as high as 6, with the current global mean be-ing ∼5 stations. Thus, we have also produced maps of the global location accuracies assuming that the 5 or 6 nearest stations take part in locating each lightning flash, as shown in the middle and lower panels of Fig. 8, respectively. As ex-pected the larger the number of stations involved in each dis-charge location, the greater the location accuracy. The global location accuracy for this network configuration assuming 5-station involvement ranges over 1.9–19 km, with the global median being 2.9 km, and the global mean 3.4 km. This is an improvement of almost ten times over the earlier estimates (Rodger et al., 2004), reflecting the improved timing accu-racy provided by the TOGA algorithm and the larger number of stations involved in a typical location.
Note that the colour scale in the lower panel of Fig. 8 (6 stations) is different from the upper two, to show the com-plete range of location accuracies found; in this case the location accuracy worldwide would be <10 km. Thus, the WWLL network could meet its location accuracy goal by retaining the current processing algorithms but boosting the sensitivity of the existing receivers (e.g. decreasing trigger thresholds). However, we note that in-situ comparisons need to be undertaken in regions far from existing WWLL sta-tions, as the use of a globally constant Gaussian timing error derived from the oceanic comparison will not necessarily in-clude propagation errors for lightning far from WWLL sta-tions. Such a study was undertaken by Lay et al. (2004), who examined the location accuracy of the pre-TOGA algorithm WWLL network in Brazil in March 2003, when the closest VLF receivers were >7000 km away, against a local Brazil lightning detection network. This study found that the ab-solute location error was 20.25 ±13.5 km, which should be compared with the location accuracy estimates of Roger et al. (Fig. 11; 2004), who found that for this pre-TOGA algo-rithm 11-station WWLL network the estimated location ac-curacy would be ∼16–17 km. We note that this estimate is rather similar to that demonstrated by experimental compar-ison, and suggests that the combination of the Monte Carlo estimation with a globally fixed Gaussian timing error de-rived from Australian comparisons is adequate, even in the case for extremely long-range propagation. Nonetheless we caution that the global location accuracies shown in Fig. 8 are based upon on an extrapolation taken from a comparatively small region, and cannot be considered as truthful until more direct “ground truth” comparisons are undertaken. Future studies need to be undertaken using independent lightning location data for locations elsewhere in the world, preferably using some of the well-developed large networks existing in North America or the coupled networks of Europe.
6 Detection efficiencies February–April 2004
We have undertaken an analysis of all ∼6.47 million “good” WWLL network lightning locations (residuals ≤20 µs) re-ported over the 90 days from February–April 2004. This time
period was chosen as the network configuration was reason-ably stable.
6.1 WWLL network observed lightning activity
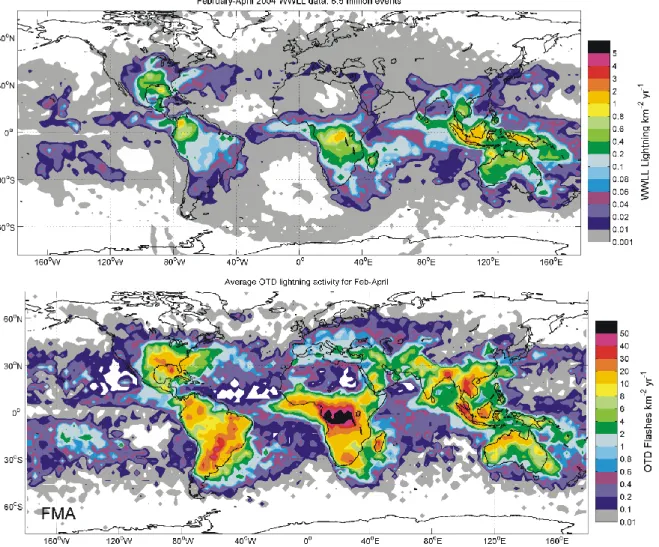
The upper panel of Fig. 9 shows the annualized geographical distribution of WWLL detected lightning activity (in units of flashes km−2yr−1)for February–April 2004. This should be contrasted with the lower panel of Fig. 9, which shows the annualized geographical distribution of total lightning activ-ity taken from the Optical Transient Detector (OTD) Low Resolution Full Climatology data set (Christian et al., 2003). This represents an average picture of the lightning activity in February–April, based on 5 years of satellite observa-tions made from low-Earth orbit. Both panels in the activ-ity plots are calculated using the same 2.5◦resolution
equal-angle grid cells provided with the OTD data set. Note that the scales have been changed between the two panels to aide comparison; the WWLL activity levels are one-tenth of those for the OTD panel.
Clearly, some of the expected features for lightning in February–April (from the OTD observations) are present in the WWLL network lightning activity map, particularly the “maritime continent” (SE Asia and northern Australia and the Indonesian archipelago). Regions of greater light-ning density in the WWLL locations generally correspond to land masses, as expected. Nonetheless, the WWLL light-ning activity currently reflects the relative station densities (Fig. 1), favouring the Maritime Continent, the weaker of the three thunderstorm “chimney” regions (Orville and Hender-son, 1986), over the other two regions (America and Africa). However, the strongest lightning producing region, Africa (e.g. Christian et al., 2003), is currently fairly well repre-sented in the data when one considers the low number of stations in this region. Additional receiving stations will be required to reproduce the relative size of the activity peaks.
The effects of station density can be judged from Fig. 10, where a global map is shown of the daily mean number of re-ceiving stations involved in each lightning location occurring from February–April 2004. The minimum number of obser-vations required for a valid location is 4, and hence this is the minimum number of stations shown in Fig. 10. Note that in some parts of the world most lightning locations are provided on average by only 4 stations (e.g. North America), while in parts of the Maritime Continent the average is ∼6 receiving stations. This will strongly influence the location accuracies in these regions. Globally, about 45% of all events are ob-served by the minimum number of 4 stations, with ∼25% by 5 stations, and ∼1% reported by 10 stations. The global av-erage for February–April 2004 is ∼5.2 stations involved in locating a WWLL event. Again, this is an improvement over the earlier situation and probably reflects the increased sta-tion densities, as well as improved event matching from the TOGA algorithm.
Fig. 9. The annualized geographical distribution of lightning activity in units of flashes km−2yr−1. The upper panel shows the good WWLL lightning locations from February–April 2004, while the lower panel are the annualized mean for these months, determined from 5 years of OTD data, after Christian et al. (2003).
Fig. 10. Diurnal variation in the WWLL reported discharge rate. Also shown are the WWLL lightning rates for the 3 principle thunderstorm activity regions for contrast with the classic Carnegie curve.
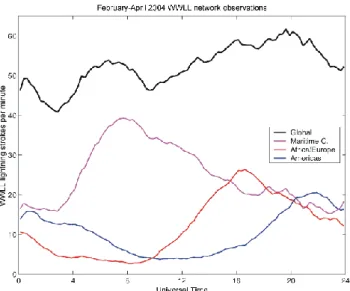
Fig. 11. Diurnal variation in the WWLL reported discharge rate. Also shown are the WWLL lightning rates for the 3 principle thun-derstorm activity regions for contrast with the classic Carnegie curve.
6.2 Diurnal variation in WWLL events
The varying contribution of the 3 chimney regions in the WWLL observations can also be seen in the diurnal varia-tion in the global lightning rate (Fig. 11), which has been di-vided up into the primary chimney regions as follows: Amer-ica (30◦W−120◦W), Africa/Europe (60◦E−30◦W),
Mar-itime Continent (150◦E−60◦E). This figure should be con-trasted with the classic Carnegie curve for regional thunder-storm occurrence (Whipple and Scrase, 1936), which uses the same geographical limits as our Fig. 11. While the di-urnal global thunderstorm occurrence expressed through the Carnegie curve suggests that lightning activity is strongest in Africa/Europe, followed by the Americas and finally the Maritime Continent, the WWLL network has a much stronger Maritime Continent contribution, reflecting the local station density. The relative phasing between the timing of the peaks is also somewhat different, with the Africa/Europe curve peaking at ∼16:50 UT and the Americas curve at
∼22:00 UT, rather than 14:00 UT and 20:50 UT in the case of the Carnegie curve. This phasing difference may reflect the seasonal time period when the WWLL observations were made, but could also reflect the station locations.
6.3 WWLL global detection efficiency
We can roughly estimate the regional detection efficiency of the WWLL network from the diurnal lightning occur-rence curves. Using the OTD observations we can deter-mine the expected mean total flash rate for February–April of
∼39±4 flashes per second, rather similar to the geographic global annual average figure of 44±5 flashes per second (Christian et al., 2003). In contrast, the mean WWLL good lightning rate for February–April 2004 was 0.9 s−1,
indicat-ing that the WWLL is detectindicat-ing ∼2% of the global total light-ning. However, most of the OTD total lightning rate will be due to IC flashes (∼30 s−1), assuming that there are 3.5
times more IC discharges than CG, with the remainder due to CG discharges. If we conservatively assume that 50% of the good WWLL events are CGs and 50% are ICs, then the WWLL provided good locations for ∼5% of global CG ac-tivity. Therefore, we should ask whether it is likely that the WWLL will be able to meet the goal of a 50% CG detection efficiency. During February–April 2004 the WWLL reported 45.5 million lightning locations (with any residual value) with an overall mean event rate of 6.1 s−1. Following the above argument, this should include ∼35% of the global CG activity, which is quite successful given the current station densities and (high) triggering thresholds. Clearly, the prob-lem is that most of these locations are “bad”. It is likely that the algorithm for combining TOGA observations from the globally spaced receivers is often including measurements from multiple discharges, and thus producing a large number of “bad” locations. An improved process for combining the TOGA observations is currently being developed.
7 WWLL regional detection efficiencies
We can also make use of the OTD global flash rates and the Carnegie curve to give a very rough estimate of the re-gional detection efficiencies. Taking the rere-gional maxima in the Carnegie curves, we find that the Africa/Europe re-gion is ∼90% of the total global mean flash rate at its max-imum activity, America ∼75% and the Maritime Continent
∼60%. For the case of the Maritime Continent, the peak to-tal lightning flash rate should be ∼23 s−1(60% of the global mean) of which ∼5 s−1, will be due to CG discharges. At its peak the WWLL reports a good lightning rate of 0.65 s−1 in the Maritime Continent, which, if 50% are due to CGs, will mean a ∼7% regional CG detection efficiency. Under-taking the same process for Africa/Europe and the Americas produces ∼3% and ∼2.5% CG detection efficiencies, respec-tively. While we acknowledge that there is high uncertainly in these estimates, they do provide a rough idea of the re-gional detection efficiencies of the current WWLL network.
It should be noted that the true Carnegie Curve (of at-mospheric electricity) and the Carnegie Curve for global lightning (as used above), are different in both amplitude and phase (see the discussion in Williams and Satori (2004) blackbox (reference missing from reference list). In general, lightning is more volatile than the integrated current in the global circuit, which has contributions beyond that of sim-ple lightning rates, such that Carnegie Curve representing the variation in the global electrical circuit is not well explained by variation in global lightning activity. The comparison of lightning activity in the two tropical chimneys (Africa and South America) is consistent of comparisons with observa-tions using the OTD/LIS (e.g. Christian et al., 2003) and ELF methods (e.g. Williams and Satori, 2004).
8 Summary
An experimental VLF World-wide Lightning Location (WWLL) network has been developed through collabora-tions with research institucollabora-tions across the globe. The aim of the WWLL is to provide global real time locations of light-ning discharges, with >50% CG flash detection efficiency and mean location accuracy of <10 km. In the last ∼4 years the network has expanded from a limited number of stations in the Western Pacific to its current state of 18 stations which cover much of the globe, with additional stations planned in the near future. As part of the initial testing phase of the WWLL, the network operated in a simple mode where the station trigger times are sent to a central processing point, rather than making use of the sferic Time of Group Arrival (TOGA). The location accuracies of the pre-TOGA algo-rithm were reported by Rodger et al. (2004). In this paper the location accuracy of the post-TOGA algorithm WWLL network (1 August 2003) has been characterised, providing estimates of the globally varying location accuracy.
Estimates of the location accuracy have been found by comparison with commercial lightning location data pur-chased from an Australian network, Kattron. In total, 5006 matched lightning events were found over 13 January 2004 in a region where the Kattron location error is modelled as being <1 km. These matched events corresponded to slightly larger Kattron-determined lightning return stroke peak currents but with a much smaller difference than in the pre-TOGA comparison. The WWLL locations were found to have no significant systematic offsets from the Kattron-determined locations, suggesting that an earlier problem with data in this region has been corrected.
The random errors in the radial differences (which are therefore all positive) are described by a mean of 4.2 km and a standard deviation of 2.7 km. A comparison of this WWLL location accuracy in the spatial region selected with the out-put of a Monte Carlo simulation allows us to determine the appropriate Gaussian timing error for the WWLL network of receiving stations (10 µs), and hence simulate the loca-tion errors for the existing 18-staloca-tion network. Currently, the average number of stations involved in each location find-ing measurement is ∼5. The global location accuracy for this network configuration assuming 5-station involvement ranges over 1.9–19 km, with the global median being 2.9 km, and the global mean 3.4 km. This is about a factor of ten improvement over the earlier estimates (Rodger et al., 2004). The implementation of the TOGA algorithm has significantly improved the location accuracies of the WWLL network, and there is a realistic possibility of meeting the <10 km accu-racies for the operational network simply by retaining the current processing algorithms but boosting the sensitivity of the existing receivers (i.e. decreasing the trigger thresholds), such that ∼6 stations are involved in most lightning location measurements.
The detection efficiency of the WWLL was also consid-ered. In the selected region the WWLL detected ∼13% of the total lightning, suggesting a ∼26% CG detection efficiency
and a ∼10% IC detection efficiency. While lower than the long-term goal of the network (∼50% CG detection), this is a considerable improvement from the earlier (pre-TOGA algo-rithm) detection efficiencies reported by Rodger et al. (2004). It appears that the WWLL network operates best in some parts of the Maritime Continent. Based on a comparison be-tween all WWLL good lightning locations in February–April 2004, and the activity levels expected from satellite obser-vations we estimate that the WWLL is currently detecting
∼2% of the global total lightning, providing good locations for ∼5% of global CG activity. The rough breakdown of CG detection efficiencies in the main lightning producing areas of the globe are Maritime Continent (∼7%), Africa/Europe (∼3%) and America (∼2.5%). The network has some way to go before meeting its long-term goal for detection efficiency. Nonetheless, the existing WWLL network is capable of providing real time positions of global thunderstorm loca-tions in its current form. While further “ground-truth” stud-ies of the network will be very valuable, the existing data should prove very useful for users from a wide variety of backgrounds (e.g. aviation, satellite visible and IR compar-isons, detection of global change, etc.).
Acknowledgements. C. J. Rodger would also like to thank F. Grant of Dunedin for her support. He was partially supported by the New Zealand Marsden Research Fund contract 02-UOO-106, while the Australasian network activities were supported by Australian Re-search Council contract LP 0 219 331. We thank the all the network hosts listed in Table 1 for housing the VLF lightning acquisition re-ceivers, and Robert McCormick of the University of Otago for use-ful comments. We also wish to acknowledge the NASA LIS/OTD Science Team and Global Hydrology and Climate Center (GHCC) for collecting and providing the satellite observed lightning data.
Topical Editor O. Boucher thanks J. Nash, A. R. Jacobson and another referee for their help in evaluating this paper.
References
Brundell, J. B., Rodger, C. J., and Dowden, R. L.: Validation of single station lightning location technique, Radio Sci., 37(4), 10.1029/2001RS002477, 2002.
Burrows, W. R., King, P., Lewis, P. J., Kochtubajda, B., Snyder, B., Turcotte, V.: Lightning occurrence patterns over Canada and adjacent United States from Lightning Detection Network obser-vations, J. Atmos. Oceans, 40, 59–80, 2002.
Christian, H. J., Blakeslee, R. J., Boccippio, D. J., Boeck, W. L., Buechler, D. E., Driscoll, K. T., Goodman, S. J., Hall, J. M., Koshak, W. J., Mach, D. M., and Stewart, M. F.: Global frequency and distribution of lightning as observed from space by the Optical Transient Detector, J. Geophys. Res., 108(D1), 10.1029/2002JD002347, 2003.
Crombie, D. D.: Periodic fading of VLF signals received over long paths during sunrise and sunset. Journal of Research National Bureau of Standards, Radio Science, 68D, 27–34, 1964. Cummer, S. A., Inan, U. S., and Bell, T. F.: Ionospheric D region
remote sensing using VLF radio atmospherics, Radio Sci. 33, 1781–1792, 1998.
Cummins, K. L. and Murphy, M. J.: Overview of lightning detec-tion in the VLF, LF, and VHF frequency ranges, 2000
Interna-tional Lightning Detection Conference, Tucson, Arizona, 1–10, 2000.
Cummins, K. L., Krider, E. P., and Malone, M. D.: The U.S. Na-tional Lightning Detection Network and applications of cloud-to-ground lightning data by electric power utilities, IEEE Trans. Electromagn. Comp., 40(4), 465–480, 1998a.
Cummins, K. L., Murphy, M. J., Bardo, E. A., Hiscox, W. L., Pyle, R. B., and Pifer, A. E.: A combined TOA/MDF technology up-grade of the U.S. National Lightning Detection Network, J. Geo-phys. Res, 103, 9035–9044, 1998b.
Dowden, R. L., Brundell, J. B., and Rodger, C. J.: VLF lightning location by time of group arrival (TOGA) at multiple sites, J. Atmos. Sol. Terr. Phys., 64, 817–830, 2002.
Fullekrug, M. and Constable, S.: Global triangulation of intense lightning discharges, Geophys. Res. Lett., 27(3), 333–336, 2000. Hamid, E. F., Kawasaki, Z-I., and Mardiana, R.: Impact of the 1997–1998 El Ni˜no event on lightning activity over Indonesia, Geophys. Res. Lett., 28, 147–150, 2001.
Huang, E., Williams, E., Boldi, R., Heckman, S., Lyons, W., Tay-lor, M., Nelson, T., and Wong, C.: Criteria for sprites and elves based on Schumann resonance observations, J. Geophys. Res., 104(D14), 16 943–16 964, 10.1029/1999JD900139, 1999. Jourdain, L. and Hauglustaine, D. A.: The global distribution of
lightning NOx simulated on-line in a general circulation model, Phys. Chem. Earth Pt. C-Solar-Terr. Planet. Sci, 26, 585–591, 2001.
Knupp, K. R., Paech, S., and Goodman, S.: Variations in cloud-to-ground lightning characteristics among three adjacent tornadic supercell storms over the Tennessee valley region, Mon. Weather Rev., 131, 172–188, 2003.
Lay, E. H., Holzworth, R. H., Rodger, C. J., Thomas, J. N., Pinto, O., and Dowden, R. L.: WWLL Global Lightning Detection Sys-tem: Regional Validation Study in Brazil, Geophys. Res. Lett., 31(3), L03102, 10.1029/2003GL018882, 2004.
Lee, A. C. L.: An experimental study of the remote location of lightning flashes using a VLF arrival time difference technique, Q. J. Royal Met. Soc., 112, 203–229, 1986.
Lyons, W. A., Nelson, T. E., Williams, E. R., Cramer, J. A., and Turner, T. R.: Enhanced positive cloud-to-ground lightning in thunderstorms ingesting smoke from fires, Science, 282, 77–80, 1998.
MacGorman, D. R. and Rust, R. W.: The Electrical Nature of Storms, Oxford University Press, Oxford, 1998.
Mackerras, D., Darveniza, M., Orville, R. E., Williams, E. R., and Goodman, S. J.: Global lightning: Total, cloud and ground flash estimates. J. Geophys. Res., 103, 19 791–19 809, 1998. Magono, C.: Thunderstorms, Elsevier Sci., Amsterdam, 1980. Morales, C. A., Weiman, J. A., Anagnostou, E. N., Goodman, S.,
and Williams, E.: Continuous Long-Range Thunderstorm Mon-itoring by a VLF Receiver Network: Location Error Analysis and Cloud-to-Ground and Intra-Cloud Detection Efficiency, J. Atmos. Ocean. Tech., in press, 2004.
Orville, R. E.: Lightning Detection from Ground and Space, in Handbook of atmospheric electrodynamics; Vol. 1, 2nd ed., edited by H. Volland, 137–149, CRC Press, Boca Raton, Fl., 1995.
Orville, R. E. and Henderson, R. W.: Global distribution of mid-night lightning, September 1977 to August 1978, Mon. Wea. Rev., 114, 2640–2653, 1986.
Pierce, E. T.: Atmospherics and radio noise, in Lightning, vol. 1, edited by R. H. Golde, Academic Press, New York, 309–350, 1977.
Rakov, V. A. and Uman, M. A.: Lightning; Physics and Effects, Cambridge University Press, Cambridge, 2003.
Rodger, C. J., Brundell, J. B., Dowden, R. L., and Thomson, N. R.: Location accuracy of long distance VLF lightning location network, Ann. Geophys., 22, 747–758, 2004,
SRef-ID: 1432-0576/ag/2004-22-747.
Rodger, C. J., Clilverd, M. A., and McCormick, R. J.: Significance of lightning generated whistlers to inner radiation belt electron lifetimes, J. Geophys. Res., 108, 1462, 10.1029/2003JA009906, 2003.
Rodger, C. J.: Red sprites, upward lightning, and VLF perturba-tions, Rev.Geophys., 37, 317–336, 1999.
Schlegel, K., Diendorfer, G., Thern, S., and Schmidt, M.: Thunder-storms, lightning and solar activity − Middle Europe, J. Atmos. Sol.-Terr. Phys., 63, 1705–1713, 2001.
Thomas, R. J., Krehbiel, P. R., Rison, W., Hamlin, T., Bocci-pio, D. J., Goodman, S. J., and Christian, H. J.: Comparison of ground-based 3-dimensional lightning mapping observations with satellite-based LIS observations in Oklahoma, Geophys. Res. Lett., 27, 1703–1706, 2000.
Uman, M. A.: The Lightning Discharge, Int. Geophys. Ser., Vol. 39, Academic Press, San Diego, Calif., 1987.
Whipple, F. J. W. and Scrase, F. J.: Point discharge in the electric field of the earth, Met. Office Geophys. Mem. London, VII68, 3–20, 1936.
Williams, E. R.: The Schumann Resonance: A global tropical ther-mometer, Science, 256, 1184–1187, 1992.
Williams, E. R. and Sartori, G.: Lightning, thermodynamic and hy-drological comparison of the two tropical continental chimneys, J. Atmos. S-P, 66, 1213–1231, 2004.
Wood, T. G. and Inan, U. S.: Long-range tracking of thunder-storms using sferic measurements, J. Geophys. Res., 107, 4553, 10.1029/2001JD002008, 2002.
Yair Y., Israelevich, P., Devir, A. D., Moalem, M., Price, C., Joseph, J. H., Levin, Z., Ziv, B., Sternlieb, A., and Teller, A.: New obser-vations of sprites from the space shuttle, J. Geophys. Res., 109, D15201, doi:10.1029/2003JD004497, 2004.