HAL Id: hal-03164719
https://hal.archives-ouvertes.fr/hal-03164719
Preprint submitted on 10 Mar 2021
HAL is a multi-disciplinary open access archive for the deposit and dissemination of sci-entific research documents, whether they are pub-lished or not. The documents may come from teaching and research institutions in France or abroad, or from public or private research centers.
L’archive ouverte pluridisciplinaire HAL, est destinée au dépôt et à la diffusion de documents scientifiques de niveau recherche, publiés ou non, émanant des établissements d’enseignement et de recherche français ou étrangers, des laboratoires publics ou privés.
A new approach for evaluation of the economic impact
of decentralized electrification projects
Jean-Claude Berthélemy, Mathilde Maurel
To cite this version:
Jean-Claude Berthélemy, Mathilde Maurel. A new approach for evaluation of the economic impact of decentralized electrification projects. 2021. �hal-03164719�
fondation pour les études et recherches sur le développement international
LA FERDI EST UNE FOND
ATION REC ONNUE D ’UTILITÉ PUBLIQUE . ELLE ME T EN ŒUVRE A VEC L ’IDDRI L ’INITIA TIVE POUR LE DÉ VEL OPPEMENT E
T LA GOUVERNANCE MONDIALE (IDGM).
ELLE C
OORDONNE LE LABEX IDGM+ QUI L
’ASSOCIE A U CERDI E T À L ’IDDRI. CE TTE PUBLIC ATION A BÉNÉFICIÉ D ’UNE AIDE DE L ’É TA T FR ANC AIS GÉRÉE P AR L ’ANR A U TITRE DU PR OGR A MME «INVESTISSEMENT S D ’A VENIR» POR
TANT LA RÉFÉRENCE «ANR-10-LABX
-14-01».
A new approach for evaluation
of the economic impact of
decentralized electrification
projects*
Jean-Claude Berthélemy & Mathilde Maurel
Jean-Claude Berthélemy, Professor Emeritus, University
Paris 1 Panthéon-Sorbonne, Senior Fellow, FERDI. Contact: Jean-Claude.Berthelemy@univ-paris1.fr
Mathilde Maurel, Director of Research, CNRS, Centre
d’Économie de la Sorbonne, Senior Fellow, FERDI. Contact: maurelm@univ-paris1.fr
Abstract
This paper proposes a new methodology for evaluating off-grid electrification projects, based upon Nighttime Light (NTL) observations, obtained by a combination of Defense Meteorological Satellite Program (DMSP) data and Visible Infrared Imaging Radiometer Suite (VIIRS) data. The methodology consists of comparing NTL data before and after the implementation of the projects. The projects are selected from FERDI’s Collaborative Smart Mapping of Mini-grid Action (CoSMMA) analysis, which documents existing project evaluations reported in published papers. Such reported evaluations are of uneven quality, with few evaluations which meet scientific standards. Our results suggest that our new methodology can contribute to fill this gap. For each project, we compute the NTL deviation with respect to its counterfactual, which provides us a proxy for the off-grid electricity-induced rate of NTL growth.
… /…
Keywords: Decentralized electrification, sustainable development, impact assessment, Nighttime Light, DMSP, VIIRS.JEL classification: L94, O13, O18, O22
* The authors thank ADEME and FERDI for their financial support and Olivier Santoni and Fatou Cissé for their research assistance. They express their grati-tude to Jean-Louis Arcand for the stimulating discussions on the role of NTL in the evaluation of development programs. Last but not least, the authors are
Dev
elopment Po
lic
ie
s
W
ork
ing Paper
284
February 2021“Sur quoi la fondera-t-il l’économie du monde qu’il veut
gouverner? Sera-ce sur le caprice de chaque particulier? Quelle
confusion! Sera-ce sur la justice? Il l’ignore.”
Abstract
Our main finding is that DMSP data identify success for 68% of projects implemented in localities where NTL was observable before implementation of the project. In localities where no NTL was detected before implementation, the success rate is 16%. Taking the median of the rate of growth of NTL of successful projects, and the NTL elasticity with respect to real GDP per capita to be equal to 2.5 in poor countries, we obtain an estimate of the rate of (local) growth of real GDP per capita of 14% for short periods (3 years) and medium periods (6 years) of observation. We implement several robustness checks on our methodology. Changing the size of pixel observations from pixels of 3km x 3km to pixels of 9km x 9km does not change our conclusions. Applying the same methodology to more precise VIIRS data available from 2013 to projects implemented between 2015 and 2017 does not change the conclusion. Comparing our results with proximate success assessments obtained from a triangulation of evaluations available in CoSMMA also does not change our conclusions.
Introduction
A systematic analysis of Impact Evaluations of international development interventions by Cameron et al (2016) indicated that electricity programs are under-evaluated compared to other areas. Scientific evaluations make up most of the evaluation literature in health, nutrition, and population interventions (83% of these evaluations being Randomized Control Trials (RCT)), education (60%), information and communications technology (68%), and water and sanitation services (69%). The under-evaluation of electrification projects is damaging, as access to electricity constitutes a key element of SDG7 (access to modern energy), which is important in itself, but also as a driving factor for achieving significant progress in the other goals. Extensions of national grids cannot realistically be tested with RCTs, as such extensions cannot be randomized, but there are many decentralized electrification projects that could be submitted to scientific evaluation.
Collaborative Smart Mapping of Mini-Grid Actions (CoSSMA1) also reports, in the relatively scarce scientific evaluation literature on decentralized electrification projects, an over- representation of the impact of such projects on education and health, compared to other SDGs, including SDG 7 (Berthélémy and Millien, 2018). In addition, these evaluations are concentrated on stand-alone electrification devices (such as solar home systems) and are not widely available for mini-grids, although mini-grids have a much higher potential of economic transformation than stand-alone devices, as they usually offer higher electric power and can therefore power a larger variety of appliances.
The systematic under-evaluation of electrification projects probably stems from the fact that they are difficult to evaluate using RCTs and ground-based quasi-experimental methods for cost reasons: randomization of mini-grids has to be done at the village level rather than at the household level. One output of the paper is that the use of satellite observation data could drastically reduce evaluation costs and consequently address the current bias towards certain areas of research on economic development.Like Peters et al. (2019), we argue that successful distributed electrification projects can effectively improve the lives of the world’s poorest people as it can trigger a very big income effect.
Access to such low-cost-based evaluations would totally change the trade-off between scientific evaluation methods and traditional evaluations which are often based only on descriptive data. This trade-off is reflected in CoSSMA by an over-representation of publications reporting evaluations based on descriptive data or on expert opinions (Berthélemy and Millien, 2018). Expert opinions are not supported by statistical tests, which implies that the probability for a declared success to be true cannot exceed 50%.
The objective of this paper is to provide policy-makers with an alternative methodology for evaluating the socio-economic impact of distributed electrification projects with a high level of reliability and scientific rigor, and a high probability of being accurate. This paper shows that Nighttime Light data is an option. It provides statistical evidence, and it has the advantage of being far less expensive and more rapid in its implementation than current traditional scientific methods based on field surveys. Furthermore, the NTL methodology can be repeated over time easily, allowing observation of the performance not only in one given year, which is the case of the above-mentioned traditional methods, but over a time span as large as desired. This “over
time” element constitutes a real advantage of NTL methodology which can be done at no additional cost.
Section 1 is a brief review of the literature about the use of NTL in economics. Section 2 presents the data selection. The projects that we analyze are extracted from the CoSMMA database, in which most projects have not been evaluated scientifically, but with descriptive means, which are not regarded as scientific. From CoSMMA we select 50 projects, which are small-size and geographically well localized. We observe NTL in the localities of these projects within 3km x 3km pixels (alternatively 9km x 9km pixels). We present the Nighttime Light (NTL) data and methodology: the DMSP data available from 1993 to 2013 and the VIIRS data which are available thereafter and are of better quality. We build for each project a counterfactual, which is defined as the NTL pattern that would have been observed in the years after the implementation of the project if the project had not been implemented. The actual NTL following the implementation of the project is then compared to the counterfactual within a confidence range. Our results are presented in Section 3: The rate of success of the projects is 48% in the full sample, but only 14% for the projects implemented in localities that were previously in the dark (with no detectable NTL in DMSP data), compared to 75% for other projects. The effect of electrification on economic activity is large for successful projects, with a median effect on income per capita growth of 14% / year in the short - and medium - term. We perform various robustness checks in Section 4: We re-do the estimates using bigger pixels of 9km x 9km. We perform similar tests on recent projects with more precise VIIRS data. We identify projects that can be considered as probably successful according to the triangulation of descriptive evaluations available in CoSMMA and we check that our tests using NTL provide similar conclusions. The last section draws the main implications for the evaluation of the impact of distributed electrification projects.
Section 1 Literature Review
Following on from the seminal work of Vernon et al (2011), a growing number of empirical papers have shown that NTL can serve as an efficient proxy for a range of economic indicators - electricity use, electricity consumption, real extent of urban agglomerations, urban population size, and population density (Zhuo et al, 2009), pace and type of urbanization (Zhang et al 2011, Elvidge et al 2012), greenhouse gas emissions (Townsend et al, 2010). More ambitiously NTL has been used for mapping and estimating the GDP of nations at national and sub-national levels (Sutton and Costanza, 2002; Ebener et al, 2005; Sutton et al, 2007; Florida et al, 2012; Chen et al, 2011; among others). However, according to Dugoua et al (2018), NTL performs better as a proxy to estimate the connection to the grid and the consumption of electricity than to measure the other socioeconomic outcomes mentioned above.
This literature review focuses on two dimensions: the use of NTL for estimating access to, and consumption of, electricity, which is the issue at hand in the methodology that we propose, and the NTL-based estimates of GDP, which allow, with NTL Elasticity of Real GDP per capita, computation of the off-grid-project-induced growth rate of NTL and of Real GDP per capita.2
2 For a review on the use of satellite imagery including NTL and other indicators, see Berthélemy et al.
To our knowledge several studies have validated the use of NTL as a proxy for consumption of electricity in developing countries3: Min and Gaba (2014) use village surveys in Vietnam4, Min et al (2013) use similar surveys in Senegal and Mali, but their validation exercises are relatively small in scale (approx. 1,000 villages in their studies), and their results are mixed with regard to household electrification. Dugoua et al (2018) expand the validation exercise to India, a large and heterogeneous country. Covering also a large sample of countries for the African continent, the Future Energy Program provides, through the combination of NTL and data regarding population density and geographical location, a mapping of access to electricity (Falchetta et al., 2019a). In the same vein, Falchetta et al. (2019a) provides a fully-reproducible 1-km resolution dataset which contains the number of people without access in each 1-km2 cell for each year between 2014 and 2018 and the estimated tier of consumption; this dataset is built on NTL, population and land cover data combined. Overall the literature concludes that DMSP NTL data are surprisingly accurate for measuring rural electrification, particularly at the village level, and they highlight the potential to use nighttime light imagery to support efforts to connect the 1.2 billion people who lack electricity around the world. Electrified villages appear brighter because of the presence of street lights, while the correlation between light output and household electricity use/access is low. Closer to our methodology because of its dynamic perspective, Algeria Li et al (2018) calculated NTL growth at the national, regional and provincial level and show that human settlements grew by 128%, that NTL data correlates with electric power consumption, and that NTL data can consistently fill the information gap when data from official sources are not available. Notice that none of these papers specifically addresses the distinction between off-grid and on-grid electricity, while our paper is focused on off-grid projects.
The studies are based on simple correlations between the village-level value of NTL collected around the date of observation of the socio-economic outcomes, and ground truth data5. In a simple multivariate regression analysis, nighttime light data are regressed on ground outcomes and are shown to contribute to a correct modeling of ground outcomes. In places with low levels of rural electrification and intermittent supply, the correlations are lower. Thus, a certain level of electricity access and power sector development is a necessary condition for accurate prediction based on nighttime light, and is blurred by intermittent electricity supply. Also, for a low level of luminosity, or no luminosity, there is considerable variation in the number of electrified households, and as luminosity increases the positive correlation between NTL and the number of electrified households becomes clearer.
A recent machine learning approach (Jean et al, 2016) shows that poverty measures can be improved by using a combination of daytime satellite imagery and the NTL data, but they use the NTL data primarily to identify features from their more detailed daytime satellite imagery. As regards GDP, the general result is that NTL provides a robust indicator, although the relationship seems to be statistically stronger for developing economies than developed ones. In developed economies, the services sector, which is less reliant on physical infrastructure, accounts for a greater proportion of overall economic output and artificial light generation might exhibit decreasing elasticity of demand as income levels rise.
Also, the measurement of income in poor countries is often inaccurate. Pinkovskiy and Sala-i-Martin (2015) use NTL to compare the capacity of national accounts and surveys for estimating real GDP and poverty, and conclude that national accounts are better suited for measurement
3 Australia is an example in the developed world: Townsend et al, 2010.
4 Min et al (2014) show a one point increase in brightness for every 550-700 additional electrified Vietnamese
homes.
5 Like the 2011 Census of India, which offers detailed information about electricity access for every village in
purposes, than surveys. According to NTL-based analysis, economic growth and living standards have grown faster, and the world income distribution has become more equal than would be suggested by surveys alone. NTL, like national accounts, is a good indicator of desirable outcomes for the poor (such as longer life expectancy, better education, and access to safe water), while surveys provide distorted pictures of developing countries growing faster and becoming richer.
Focusing on China, Hu and Yao (2019) show that the relationship between NTL and real GDP per capita can be non-linear, and find that NTL adds little value for countries with high-quality statistical systems, but is particularly valuable for low-income and middle-income countries6. In Wu et al (2018), NTL is used to estimate Chinese GDP at a multi-scale level from 2014 to 2017 to gain insight into regional inequality and economic development, and track changes in overall inequality, within-province inequality, and between-region inequality.
Overall, there is a growing consensus that NTL can do a good job in providing accurate estimates of GDP at various scales, be it regional or national. Methods like surveys or national accounts which are historically rooted in the field of social sciences could be progressively replaced by remotely sensed imagery for mapping and inferring phenomena.
Section 2 Data and methodology
2.1 CoSMMA
FERDI has initiated a project of smart mapping of decentralized electrification projects - Collaborative Smart Mapping of Mini-grid Action (CoSMMA), whose aim is to establish a mapping of the effects produced by decentralized electrification projects. CoSMMA documents, for each project, its technical, economic, and organizational characteristics as well as the effects observed by evaluators of these projects on the economic, social and environmental well-being of the populations concerned.
The database has collected 2,712 effects produced by 403 decentralized electrification projects identified by the authors of 125 evaluative studies published in scientific journals or in working papers submitted to a peer review committee. Only 17 projects have been submitted for scientific evaluation, based on standard statistical methods of inference.
The 2,712 effects correspond to the different effects of the Sustainable Development Goals (SDGs): access to energy (SDG7), fighting against poverty (SDG 1), promoting health (SDG 3), education (SDG 4), gender equality (SDG 5), economic transformation (SDG 8), community (SDG 11), environmental preservation (SDG 13), and security (SDG 16). Some effects concern dimensions that are outside the SDGs, like unleashing available time, or providing access to information and communication.
All the effects provide information about the success or the failure of the projects, with a bias due to the fact that not all projects can be evaluated scientifically. More specifically, due to the high fixed costs involved in the traditional methods based on surveys of targeted populations, which imply building representative samples, or on randomized controlled trials (RCT) in which eligible units in a sample have to be randomly assigned to treatment and control groups, small projects cannot be evaluated in the same way.
6 Therefore, variation in NTL may contain useful real economic growth information for a middle-income country
Out of the 403 projects mentioned above (some of which are made up of multiple sites), we have selected 50 projects7 that fit the following three criteria:
1. Size: They are targeted towards small “entities” (which can be individuals, shops, households, etc), which encompass less than 20 000 individuals, shops, or households. Bigger projects are ignored because the identification strategy would be less convincing. 2. Localization: They are localized with a defined level of precision - the name of the place
within the country, and its GPS coordinates, to make sure that the extracted NTL can be matched with the project.
3. Localization in areas where NTL is moderate between 1992 and 2018. Areas with high NTL would be likely to be connected to the grid and close to urban areas in which the effect of mini-grid projects could be hardly detected.
4. Projects that were implemented between 1994 and 2017, so that we can use NTL data
to build a counterfactual and compare it to post-implementation data.
2.2 Nighttime Light data
Berthélemy et al (forthcoming) summarize the technical and methodological developments in the area of retrospective impact evaluations with the help of satellite imagery, which can close the evidence gap for electricity projects. Nighttime Light (NTL) constitutes one of the earliest indicators in these developments.
The two main sources of NTL imagery are the Defense Meteorological Satellite Program (DMSP) and the Visible Infrared Imaging Radiometer Suite (VIIRS) datasets. There are important differences between the DMSP and VIIRS datasets as regards NTL. DMSP is available monthly between 1992 and 2013, whereas VIIRS has been available monthly since 2012. The DMSP spatial resolution (2.7km) is less detailed than VIIRS (742m). The DSMP radiometric resolution (6-bit) is lower than VIIRS (12-or 14-bit). In short, VIIRS offers better spatial and radiometric resolution. Additionally, VIIRS images are collected at 1:30AM while DMSP is collected at 8:30-9:30PM. The difference in the overpass time of these two sensors means that the light captured by one might be inconsistent with that captured by the other.8
While VIIRS offers better spatial, radiometric, and temporal resolution than DMSP, its relatively shorter availability (from 2012 onwards) implies that DMSP is the more widely used NTL dataset for time series analysis.
Both DMSP and VIIRS data are used in the socio-economic literature. Their relative performance is evaluated in Elvidge et al (2017), for whom VIIRS data collect global low-light image data which are significantly better than DMSP. Shi et al (2014) compare R2 values of the
regressions of NTL from VIIRS and DMSP data on GDP and Electric Power Consumption (EPC). They conclude that the R2 obtained with VIIRS data are all higher than those from DMSP data, and that VIIRS data are consequently better for modelling socioeconomic indicators, such as GDP and EPC. While DMSP allows construction of NTL time series, which cover a longer time span (from 1992 to 2013), VIIRS data which is available at a monthly frequency can be used with a sufficient number of degrees of freedom over a shorter time span. There have been attempts by researchers to adjust for the differences between DMSP and VIIRS in order to have consistent long-term NTL data. Li et al (2017) estimated Syrian city light dynamics between 2011 and 2017 by converting monthly VIIRS data into monthly like data. This was only done at a local scale, because generating an up-to-date
7 The list of these 50 CoSSMA projects is provided in Appendix 1
8 DMSP and VIIRS sensors capture slightly different economic activity: not only do people’s activities change
from the early evening to midnight, but so do public services (e.g. some streetlights are turned off by 1:30am when VIIRS collects its data).
like dataset at a global scale by integrating DMSP and VIIRS observations is exceedingly difficult. The results derived from inter-calibrating DMSP data are sensitive to the selected region and year, and dependent on ancillary datasets like surveys of socioeconomic data. However, a new study by Li et al (2020) created a global-scale dataset from 1992 to 2018 by harmonizing inter-calibrated DMSP data with simulated DMSP-like VIIRS data. First, they aggregated monthly VIIRS into annual data, and excluded time-variable light, like fires, that VIIRS tends to pick-up due to its finer resolution. Then, to convert the VIIRS data into DMSP-like data (with the same spatial resolution and similar radiometric characteristics) they used a sigmoid function to quantify the relationship between the two datasets, Finally, they integrated the temporally calibrated DMSP data and DMSP-like VIIRS data.
We use harmonized data provided to us by Li et al (2020). When the numerical values of DMSP and converted VIIRS data were different in 2013, we complemented their harmonization with a simple linear extrapolation: we kept DMSP data for 2013, and we used the growth rates of converted VIIRS data from 2013 to 2018 to extend our time series to 2018. This eliminated any possible artificial structural break of our time series in 2013.9
The main issue with the DMSP or DMSP-like observations is that their precision is limited. When DMSP observed in 3km x 3km pixels falls below 0.111 (on a scale of 0 to 63), it is considered as non-detectable and set to 0. The threshold used for 9km x 9km pixels is 0.037. Non-detectable observations need to be treated properly, as they are not equivalent to actual zeroes. Their treatment is explained in the next section and Appendix 2.
2.3 Methodology
We estimate NTL patterns for t varying from 1992 to the introduction date T0 of the off-grid
project, and we predict the level of NTL after T0, which gives us a proxy for what would have
been the level of NTL if the project did not occur.
The method of estimation of the counterfactuals depends on the quality of the NTL measurement i.e. on the number of non-zero observations. This leads us to consider 5 different groups of projects:
When all NTL values are positive before T0, we run OLS regressions (group 1).
When few observations are missing, we use tobit regressions (group 2).
Simple averages (without trend) are computed if the number of positive observations before T0 is insufficient to estimate a time trend. This number can be either above 1
(group 3 - for which we can compute the mean value of positive NTL and its standard deviation before T0), equal to 1 (group 4 - for which we cannot compute a standard
deviation of NTL before T0), or 0 (group 5 - for which we can compute neither the mean
value of NTL before T0, nor its standard deviation).
In group 1 we estimate a linear regression of NTL on time t. When the parameter associated with t is significantly different from 0, we use the parameters of this regression to compute the predicted values of NTL after T0 and their standard deviation. When the parameter associated
with t is non-significant we set it to 0, which means that the project is moved from group 1 to group 3.
In group 2, we run a tobit regression in which we set the minimum level of observability of NTL at 0.111 (0.037 when we use pixels of 9km x 9km). When the parameter associated with t is significantly different from 0, we use the parameters of this regression to compute the
predicted values of NTL after T0 and their standard deviation. When the parameter associated
with t is not significant we set it to 0, and the project is moved from group 2 to group 3. In group 3, the information available before T0 is insufficient to compute a robust trend. We
define our counterfactual as the average of observed values of NTL. All zeroes are eliminated, which means that our counterfactual is built only on observable NTL before T0. In this way, we
compare NTL observations after T0 with periods before T0 when NTL was actually observed.
We also compute the standard deviation of NTL before T0.
Group 4 is similar to group 3, except for the fact that we cannot compute the standard deviation of NTL before T0. We can however compute a proximate upper limit of this standard deviation,
using the fact that we observe one observation out of T0-1992 observations at least equal to the
value of the NTL actually observed before T0. The computation of this upper limit is detailed
in Appendix 2.
In group 5, we set the lower limit of the mean NTL before T0 to 0.111 (0.037 when we use 9km
x 9km pixels). We also define a proximate upper limit of NTL standard deviation using the fact that the proportion of NTL observations before T0 above the 0.111 (0.037) threshold is below
1/(T0-2011) (assuming that if we had observed NTL in 2011, it would have been found to be
above the 0.111 (0.037) threshold). The computation of this upper limit is detailed in Appendix 2.
Using the pre-treatment patterns, based upon either fitted curves (groups 1 and 2) or simple averages (groups 3 to 5), we predict NTLt, t>T0, which gives us for t>T0 an estimate of what NTL
would have been in the absence of the project (treatment).Predicted and actual values of NTL are plotted by year. This provides us with a graphical evidence of the likely effect of the project. We compute the deviation DevNTLi, t>T0 between actual NTLi, t>T0 and predicted NTL. We
compute also the P-values associated with DevNTLi, t>T0, through a t-test function:
Pr(DevNTL>0)=t(dof, DevNTL/std)
where std is the standard deviation of our estimator of predicted values, dof is the degree of freedom of the regression associated with the estimator and t(.,.) refers to the Student-t function. The complement to 1 of these probabilities is classically called P-value. Such P-values are computed for 3-year periods, over the short term (T0+i, i varying from 1 to 3) and the medium
term (T0+j, j varying from 4 to 6). A project is considered successful if its P-Value is below or
equal to 20% (the probability that the deviation from trend is positive is higher or equal to 80%). This P-value level is higher than the standard ones 10% (5% or 1%), but it is small enough to support the NTL methodology as a good alternative to the traditional methods, in a context where there is a trade-off between the accuracy of the project evaluation and the cost of the evaluation.
Section 3: Results
3.1 Primary results
Graphs 1 and 2 show the results for groups 1 and 2, where the counterfactual can be constructed on the basis of a trend, estimated through OLS or tobit, which is significantly positive (or negative). Actual observations are plotted against their fitted values, and the deviations can be significantly positive or not. The vertical green bars refer to the date of implementation of the
projects, showing the years before, and the years after, the project. Graph 1 is a situation of project failure, while the opposite holds for Graph 2.
Graphs 1 and 2: Graphical evidence for groups 1 and 2
Source: Projects – 29 (Brazil) and 46 (India); more details in Appendix 1.
Graphs 3 and 4 show the counterfactuals, which use simple averages (groups 3 and 4). As previously, we are able to distinguish two situations. In Graph 3, there is a clear increase in NTL at the right of the green bar, which means that the project unleashed a successful story of electrification, which turns out to be long-lasting. Graph 4 refers to the opposite situation, with no distinguishable improvement of NTL after the introduction of the project. For Graph 3 the probability of success is high (close to 99%); while there is no trend before, the post-treatment period is characterized by the appearance of a positive trend. For Graph 4 the probability of success is very low and there is no trend after the treatment.
Graphs 3 and 4: Graphical evidence for groups 3 and 4
Source: Projects – 21 (Myanmar) and 9 (Philippines); more details in Appendix 1.
When there is no light at all before the projects take place (when the villages are initially in darkness), we again face two possible outcomes. Graph 5 shows no effect over the first 15 years after T0, and then NTL increases – this increase cannot be imputed to the project implemented
15 years earlier. Graph 6 shows an immediate post-project increase in NTL, which is persistent over time.
Graphs 5 and 6: Graphical evidence for group 5
Source: Projects – 1 (Nepal) and 25 (Senegal); more details in Appendix 1.
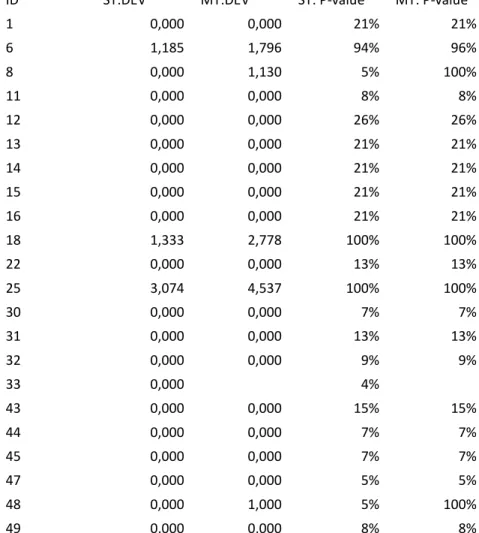
Numerical results for the 50 projects are shown in Tables 1 and 2 (Appendix 3). They are summarized in the following graph, which shows the distribution of success of the projects: the horizontal axis corresponds to 1-P-values (probabilities of success), and the vertical axis gives the share of the projects, which report a given P-value. Of the total number of projects, 48% of the projects report a probability of success higher (or equal) than 80%.
Graph 7: Distribution of successful projects
This probability is very heterogeneous across groups. In the first four groups (28 projects), an average of 75% projects have been successful (P-value being lower than 20%). In Group 5, the rate of success is much lower: out of 22, three have been successful, which makes an estimated rate of success of 14% (see Graph 8). Knowing that this group is characterized by a complete
absence of detectable light before the project was introduced, the high number of failures can be interpreted in three different ways.
Graph 8: Heterogeneity across groups: In the dark versus out of the dark localities
The first interpretation, is that for a project implemented in a locality initially extremely poor, the probability of success in the short and medium term is much lower, be it for demand reasons (households that have no previous experience with electrical appliances need time to adopt such innovations), or supply reasons (producing electricity and managing its distribution require experience that is lacking in localities initially deprived of any access to modern energy). The second interpretation is that if we observe positive NTL several years after the implementation of the project, it means that longer time spans are necessary before one can observe that the project has been successful. It could also mean that new projects have been implemented later on to deal with the initial project failure. The third interpretation is that NTL is unobservable in certain localities for geographical or physical reasons, which is plausible only for a small number of projects, because for most of them we observe positive NTL by the end of the observation period. The absence of project success is nevertheless an open question, which requires further investigation.
The magnitude of positive and significant deviations from counterfactual varies from approximately 0.5 to 6, with a median of 2.2. For most projects considered as successful in the short term, the deviation from counterfactual increases over time with a median increase in the deviation of about 0.5. Short-term effects could be considered to be the mere effect of electricity use for night lighting of streets and buildings. The significant increase in the effects detected from the short to the medium term suggests that in many cases electrification triggers economic transformation. Only 3 of the 18 successful projects for which we can compute medium-term deviations experience a declining deviation from trend in the medium run.
Four projects, which were unsuccessful in the short term (with a short-term deviation from the counterfactual not significantly positive initially) became successful in the medium term. This may be due to difficulties at the start of implementation, which were solved later. Two of them belong to Group 5 projects in localities initially in the darkness, which is consistent with our interpretation of this group as containing projects for which the delay in successful implementation is long due to adverse initial conditions.
Graph 9: Success detected only in the medium /long term under poor initial conditions
Source: Projects – 48 (Cambodia), 42 (India), 7 (Peru, Campo Alegre), 8 (Peru, El Regalado); more details in Appendix 1.
If we count as successful those projects which failed in the short term but succeeded in the medium term, the total rate of success is higher, 56% on average (82% in groups 1 to 4 and 23% in Group 5).
Interestingly, the share of successful projects increases over time from 30% in the 1990s to 75% in the 2010s. This result is reported in Graph 10, which reflects the improvement from experience gained over time, as well as organizational and technological progresses.
3.2 The effect on income per capita growth
Hu and Yao (2019) examine the relationship between official GDP measures and nighttime light, in an attempt to detect GDP measurement errors. Their paper shows that the relationship between NTL and GDP per capita exhibits nonlinearities and varies with geographic location. It suggests that the error in official GDP per capita may depend on the country’s statistical capacity.
More importantly, for the purpose of this paper estimates of nighttime light elasticity with respect to real GDP at different levels of income are obtained. They steadily decrease as real GDP per capita increases, reflecting that a country moves away from infrastructure development toward other sources of economic growth as it develops, while the link between electricity and growth is strong at lower stages of economic development. As a result, low-income countries have an estimated elasticity of NTL to GDP of about 2.5 whereas high-low-income countries have an elasticity close to 0.
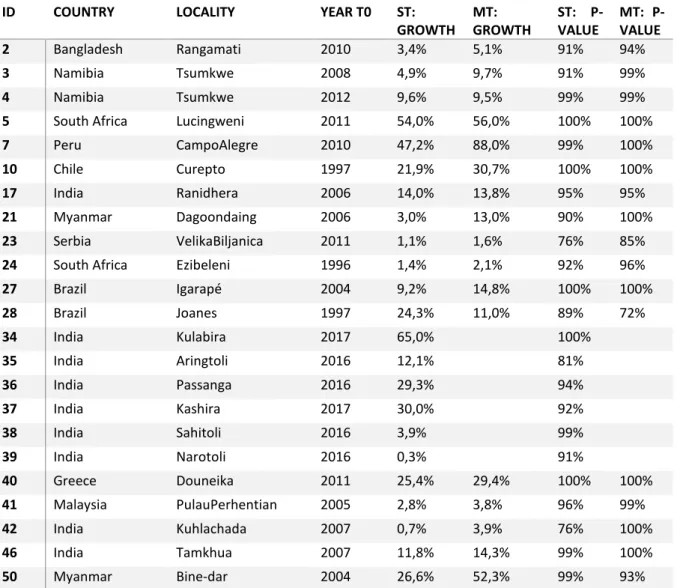
Table 3: Estimates of GDP per capita rate of growth induced by successful distributed electrification project
ID COUNTRY LOCALITY YEAR T0 ST:
GROWTH MT: GROWTH ST: P-VALUE MT: P-VALUE 2 Bangladesh Rangamati 2010 3,4% 5,1% 91% 94% 3 Namibia Tsumkwe 2008 4,9% 9,7% 91% 99% 4 Namibia Tsumkwe 2012 9,6% 9,5% 99% 99%
5 South Africa Lucingweni 2011 54,0% 56,0% 100% 100%
7 Peru CampoAlegre 2010 47,2% 88,0% 99% 100%
10 Chile Curepto 1997 21,9% 30,7% 100% 100%
17 India Ranidhera 2006 14,0% 13,8% 95% 95%
21 Myanmar Dagoondaing 2006 3,0% 13,0% 90% 100%
23 Serbia VelikaBiljanica 2011 1,1% 1,6% 76% 85%
24 South Africa Ezibeleni 1996 1,4% 2,1% 92% 96%
27 Brazil Igarapé 2004 9,2% 14,8% 100% 100% 28 Brazil Joanes 1997 24,3% 11,0% 89% 72% 34 India Kulabira 2017 65,0% 100% 35 India Aringtoli 2016 12,1% 81% 36 India Passanga 2016 29,3% 94% 37 India Kashira 2017 30,0% 92% 38 India Sahitoli 2016 3,9% 99% 39 India Narotoli 2016 0,3% 91% 40 Greece Douneika 2011 25,4% 29,4% 100% 100% 41 Malaysia PulauPerhentian 2005 2,8% 3,8% 96% 99% 42 India Kuhlachada 2007 0,7% 3,9% 76% 100% 46 India Tamkhua 2007 11,8% 14,3% 99% 100% 50 Myanmar Bine-dar 2004 26,6% 52,3% 99% 93%
Notes: ST (MT): growth refers to short-term (medium-term) growth
The estimates of GDP per capita rate of growth attributable to distributed electrification projects in Table 3 above are based upon the project-induced NTL deviations computed for the short-and medium-term in Table 1 (Appendix 3). We excluded the projects belonging to group 5 as the NTL for those projects does not exist before T0. We also excluded projects with
non-significantly positive deviations from trend, as in these case deviations cannot be attributed to the projects. The deviations provide us with estimates of the project-induced NTL growth rates. We combine the later with an NTL elasticity with respect to real GDP per capita equal to 2.5 as in Hu and Yao (2019). This is justified as all localities in our sample belong to the category of low-income countries.
The estimates of GDP per capita rate of growth attributable to successful projects in the short term vary over a wide range, from a minimum of 0.2% to a maximum of 65%. The median is 14%, which echoes the rate of growth of China and other emerging countries during their early phases of economic development and underlines the high potential of off-grid electricity for unleashing economic take-off. The median of medium-term growth effects attributable to successful projects is also equal to 14%.
Section 4: Robustness checks
In this section we check the robustness of our results as follows:
1. We change the size of pixels used to observe NTL from 3km x 3km to 9km x 9km. 2. We re-do our exercise for projects implemented recently, for which we can use more
precise VIIRS data. We use monthly data to increase the degrees of freedom of our regressions.
3. We mobilize the evaluation data, which is available in CoSMMA, to identify projects that can be considered as successful, and we use a standard triangulation method in which a project is considered as successful if we observe at least 3 independent positive effects attributable to this project.
In each case, we show that the new results obtained are consistent with our initial findings.
4.1 Varying the intensity of the treatment
Our conclusions might depend on the size of pixels used to measure NTL. We have in our sample small villages and large villages. We also have villages that are completely isolated (small islands, villages in poorly populated areas) as well as villages located in densely populated areas. We check that our results are not affected by the choice of the size of pixels by re-doing our estimations with pixels of 9 km x 9 km. We find that our qualitative conclusions are not affected by this change:
- All but one project found to be successful with 3 km x 3 km pixels are found to be successful when we use the 9 km x 9 km pixels.
Three projects are found to be successful with 9 km x 9 km pixels that were unsuccessful with 3 km x 3 km pixels, but the difference is small: One of these projects has a probability of success of 75% when assessed with 3 km x 3 km pixels, the other two have a deviation from the trend observed from the 9 km x 9 km pixels that is small (below 0.2) but significant.
4.2 Monthly VIIRS data
For the seven projects that have started in recent years, from 2015 onwards, it may be suitable to use VIIRS monthly data. Monthly data usually have a seasonal profile, particularly in rural areas where the principal economic sector is agriculture. We take seasonality into account by introducing it into our model specification used to compute the counterfactual dummy variables for each month. Sometimes there are small negative observations, which correspond to measurement errors for low-level NTL. We kept them in the calculations, as they provide information on the profile of NTL over time. Otherwise, our methodology is the same as for DMSP data. Our results are reported in Table 4. Probabilities of success are relatively high, varying from 65% to 100%, with a mean value equal to 88%.
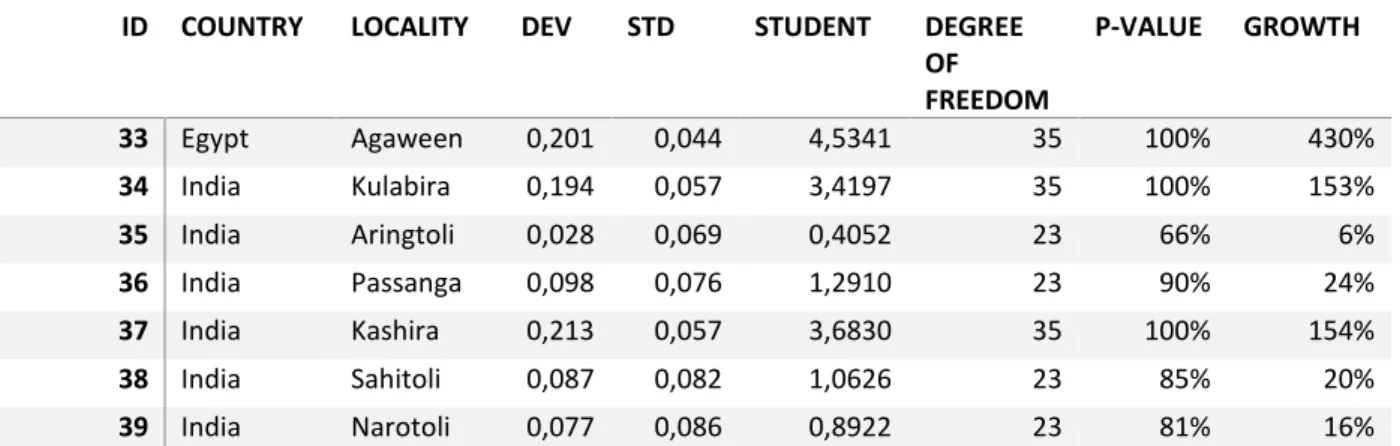
Table 4: Monthly and VIIRS data
ID COUNTRY LOCALITY DEV STD STUDENT DEGREE
OF FREEDOM P-VALUE GROWTH 33 Egypt Agaween 0,201 0,044 4,5341 35 100% 430% 34 India Kulabira 0,194 0,057 3,4197 35 100% 153% 35 India Aringtoli 0,028 0,069 0,4052 23 66% 6% 36 India Passanga 0,098 0,076 1,2910 23 90% 24% 37 India Kashira 0,213 0,057 3,6830 35 100% 154% 38 India Sahitoli 0,087 0,082 1,0626 23 85% 20% 39 India Narotoli 0,077 0,086 0,8922 23 81% 16%
Notes: DEV for deviation over the short term; STD for standard deviation over the short term; ST: Student for student statistics over the short term; P-value for probability of success over the short term.
Comparing the results based on DMSP and VIIRS data gives an interesting picture. First and most importantly, the quality of the measurement looks much better with VIIRS data, as reflected in the availability and precision of the VIIRS measures in graphs 10 to 13 below. In five out of seven cases, the conclusions are identical and consistent: a project, which is successful according to DMSP NTL, is successful according to VIIRS NTL.
Two projects have conclusions that are not consistent. The first divergent project is unsuccessful according to DMSP but successful according to VIIRS NTL (Graphs 11 and 12). This is clearly due to the low quality of DMSP, which implies that only one observation is available after the implementation of the project, while it is constantly zero before T0.
Contrasting with this inability to detect any light before and after the project, VIIRS data, which are available on a monthly basis and provide a more precise measurement, are capable of detecting that an improvement, even slight, occurred after T0.
Graphs 11 and 12: Unsuccessful according to DMSP but successful according to VIIRS NTL
Source: ID =33 more details in Appendix 1.
The second divergent project is reported in graphs 13 and 14 below:
Graphs 13 and 14: successful according to DMSP but unsuccessful according to VIIRS NTL
Source: ID =35 more details in Appendix 1.
With DMSP NTL there is a clear improvement 2 years before the introduction of the project and 1 year after it. This result, which is based only on two observations, is not confirmed by VIIRS data, because the VIIRS data reveal an increasing trend over the whole period, which continues for the post-project observations.
4.3 Projects which can be triangulated
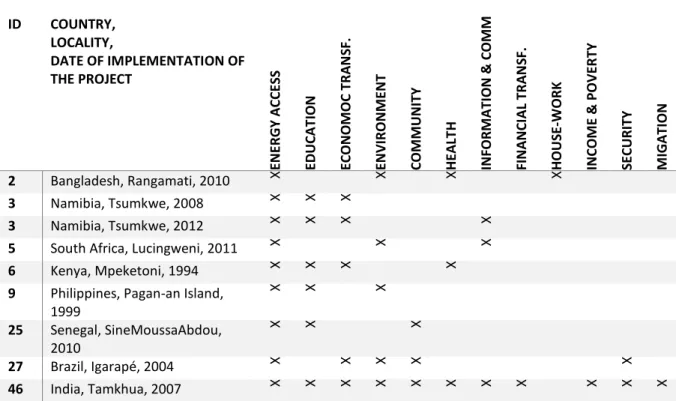
Across all groups, nine CoSMMA projects report at least three independent positive outcomes (see Table 5 below). This multiplicity of outcomes makes them more likely to be successful, both intuitively but also scientifically. Berthélemy (2020) proposes a method of evaluation, which is based upon the so-called principle of triangulation. According to this method, a successful project is more likely if it produces several favorable effects. The probability of being right when concluding on a successful outcome is about 1-0.5n where n is the number of
The effects are assumed to be independent and absolutely equivalent in importance, which means that the method does not hierarchize them. In the absence of a standard scientific test of significance, we cannot say that effect 1 is significant at the usual level, but we can say, at least, that it is significant at 50%. With a second observed outcome, associated with a similar probability, 0.5, of making a mistake, the probability for the project to be a failure, whatever the exact nature of the failure, falls to 0.5 x 0.5, that is 25%. With each additional effect we multiply the probability by an additional 0.5.
By focusing on CoSSMa projects that have at least three independent observed effects (maximum 6), we end up with levels of significance which are close to standard ones: from 0.125 (3 dimensions) to 0.015 (6 dimensions). Notice that this triangulation method is particularly well-suited for off-grid electricity projects, which are usually characterized by a large range of effects beyond the direct effect of providing access to electricity.
Nine projects can be considered as successful according to this triangulation approach. All of them but one were also found successful according to our NTL-based methodology. Scrutinizing this project, for which we obtain diverging conclusions, is revealing. It was implemented in 1999 and evaluated more than 10 years later by Hong and Abe (2012) on the basis of a household survey implemented in 2010. The authors mention that the project faced difficulties in its early years, as illustrated by a decline in power production in the first 3 years after 1999. This initial decline is reflected in Graph 4, which reports the late success of the project in 2010, when NTL departs from its counterfactual. Interestingly, this apparent success has been short-lived, as we see a decline of NTL later.
This example illustrates the superiority of the NTL-based methodology over survey-based approaches, which are not only more costly but also less accurate, as they cannot be repeated every year and depend therefore on the date of implementation of the surveys.
Table 5: Projects that can be triangulated
ID COUNTRY, LOCALITY, DATE OF IMPLEMENTATION OF THE PROJECT EN ER GY ACCE SS ED UCA T IO N ECON OM OC TR A N SF. EN VIRON M EN T COM M UNITY H EA LT H INFORM A TI ON & C OM M FI N A N CI A L TR A N SF. H OU SE -W ORK INCOM E & POVE R TY SE CURITY M IGA TI ON 2 Bangladesh, Rangamati, 2010 X X X X 3 Namibia, Tsumkwe, 2008 X X X 3 Namibia, Tsumkwe, 2012 X X X X
5 South Africa, Lucingweni, 2011 X X X
6 Kenya, Mpeketoni, 1994 X X X X
9 Philippines, Pagan-an Island, 1999 X X X 25 Senegal, SineMoussaAbdou, 2010 X X X 27 Brazil, Igarapé, 2004 X X X X X 46 India, Tamkhua, 2007 X X X X X X X X X X X
Conclusion
The NTL approach allows us to evaluate the success of an off-grid electricity project with an acceptable level of accuracy, which is particularly useful when the first-hand evaluations are of low quality, and when there is a trade-off between the benefit and the cost of a project evaluation. The rationale behind this approach is that the success of a project will be reflected in a positive and significant deviation of NTL from its estimated normal pattern.
We proceed in several steps. First, we select 50 CoSMMA projects which fit criteria of Size and Localization. Depending on the nature and quality of NTL data, and date T0 of the
implementation of the project, we estimate a counterfactual by running simple OLS, tobit for dealing with censored data, or simple means, using observations before T0. We compute the
deviation of the actual NTL from what it would have been in the absence of the treatment, and we look at whether the deviation is significantly different from zero. The finding is that NTL can be used for evaluating the success or failure of off-grid electricity projects. We infer from our results and the elasticity of NTL with respect to real GDP per capita of 2.5, as in Hu and Yao (2019) a median estimate of GDP per capita growth effect of successful projects of 14% annually, both in the short term and the medium term.
We run sensitivity tests by varying the size of pixels used to observe NTL, by using monthly VIIRS data, and by restricting the analysis to a sub-sample of projects that can be triangulated. Several preliminary conclusions emerge from this research:
- Successful projects are associated with large effects on local economic growth. This should lead policy makers to pay more attention to distributed electrification projects, which could accelerate economic development in rural areas.
- About half of projects have failed; given the previous conclusion, it is urgent to identify factors that may facilitate, or hinder, the success of projects.
- One key element of failure seems to be the initial energy poverty in the localities concerned. In localities that are initially in darkness, policy interventions aimed at accelerating the adoption of electricity in both consumption and production behaviors should be considered.
More research is necessary to develop and strengthen these conclusions. The results do not establish a causal link between access to electricity and improvement in socioeconomic outcomes, such as SDGs, or more specific outcomes. To establish such a link an analysis with better controls is needed, in particular to compare what happens in similar situations with and without access to electricity. NTL data should be also complemented with other data to better understand the impact of electrification on the various SDGs. Finally, our methodology should be complemented with an analysis of the business models and governance of distributed electrification projects to identify factors of success.
References
Berthelemy, J.C., 2020, Measuring the impact of decentralized electrification projects: a triangulation-led approach, FACTS Reports, 22, pp. 108-115.
Berthelemy J-C, Millien A., 2018, “Impact of decentralized electrification projects on sustainable development: A meta-analysis”, FERDI Working paper P240.
Berthelemy J-C, Davis R., Maurel M., forthcoming, “The Application of Satellite Data to Impact Evaluations and the Measurement of Development Indicators”, FERDI Working paper.
Cameron, B. Mishra, A. & Brown, A., 2016, “The growth of impact evaluation for international development: how much have we learned?”, Journal of Development Effectiveness, 8 (1), pp. 1-21.
Donaldson, D. Storeygard, A., 2016, “The View from Above: Applications of Satellite Data in Economics” Journal of Economic Perspectives, 30 (4), pp. 171-98.
Dugoua, Eugenie, Kennedy, Ryan and Urpelainen, Johannes, 2018, “Satellite data for the social sciences: measuring rural electrification with night-time lights”, International Journal of Remote Sensing, 39 (9), pp. 2690-2701.
Ebener, S., Murray, C., Tandon, A. and Elvidge, C.D., 2005, “From wealth to health: Modelling the distribution of income per capita at the sub-national level using night-time imagery”, International Journal of Health Geographics, 4 (5).
Elvidge C.D., Baugh K.E., Anderson S.J., Sutton P.C. Ghos T., 2012, “The Night Light Development Index (NLDI): a spatially explicit measure of human development from satellite data”, Social Geography, 7, pp. 23-35.
Elvidge C.D., Baugh K., Zhizhin M., Feng Chi Hsu, Tilottama Ghosh T., 2017, “VIIRS night-time lights”, International Journal of Remote Sensing, 38 (21), pp. 5860-5879.
Falchetta, G., Hafner, M.. A New Approach for Mapping Electricity Access in Sub-Saharan Africa with Satellite Data. FEEM Policy Brief No. 03 (2019a).
Falchetta, G., Pachauri, S., Parkinson, S. et al. A high-resolution gridded dataset to assess electrification in sub-Saharan Africa. Sci Data 6, 110 (2019b).
Florida R., Mellander C., Gulden T. 2012., “Global metropolis: assessing economic activity in urban centers based on nighttime satellite images”, Professional Geographer, 64(2), pp. 178-187.
Chen X., Nordhaus W. D., 2011, “Using luminosity data as a proxy for economic Statistics”, Proceedings of the National Academy of Sciences, 108 (21), pp. 8589-8594.
Hu Yingyao, and Jiaxiong Yao, 2019, “Illuminating Economic Growth”, IMF Working Paper.
Letu H., Hara M., Tana G., Nishio F., 2012, “A saturated light correction method for DMSP/OLS nighttime satellite imagery”, IEEE Transactions on Geoscience and Remote Sensing, 50, pp. 389-396.
Jean, Neal, Marshall Burke, Michael Xie, W., Matthew Davis, David B. Lobell, and Stefano Ermon, 2016, “Combining Satellite Imagery and Machine Learning to Predict Poverty” Science, 353 (6301), pp. 790-794.
Li Xi, Li Deren, Xu Huimin and Wu Chuanqing, 2017, “Intercalibration between DMSP/OLS and VIIRS night-time light images to evaluate city light dynamics of Syria’s major human settlement during Syrian Civil War”, International Journal of Remote Sensing, 38 (21), pp. 5934-5951.
Li,X., Lixian Zhao, Wenjun Han, Bouarouri Faouzi, Prosper Washaya, Xubing Zhang, Huazhong Jin and Chuanqing Wu, 2018, “Evaluating Algeria’s social and economic development using a series of night-time light images between 1992 to 2012”, International Journal of Remote Sensing, 39(23), pp. 9228-9248.
Li, X., Zhou, Y., Zhao, M. et al., 2020, A harmonized global nighttime light dataset 1992–2018. Scientific Data, 7(168).
Min, Brian, Kwawu Mensan Gaba, Ousmane Fall Sarr, and Alassane Agalassou, 2013, “Detection of Rural Electrification in Africa Using DMSP-OLS Night Lights Imagery”, International Journal of Remote Sensing, 34 (22), pp. 8118-8141.
Min, Brian, and Kwawu Mensan Gaba, 2014, “Tracking Electrification in Vietnam Using Nighttime Lights”, Remote Sensing, 6 (10), pp. 9511-9529.
Peters, J., Sievert M., Toman M.A., Rural electrification through mini-grids: Challenges ahead, Energy Policy, Volume 132, 27-31 (2019).
Pinkovskiy, M. Sala-i-Martin, X., 2016, “Lights, Camera … Income! Illuminating the National Accounts-Household Surveys Debate”, The Quarterly Journal of Economics, 131 (2), pp. 579-631.
Sutton, P. C., and Costanza, R., 2002, “Global estimates of market and non-market values derived from nighttime satellite imagery, land use, and ecosystem service valuation”. Ecological Economics, 41, pp. 509-527.
Sutton P., Elvidge C., Ghosh T., 2007, “Estimation of Gross Domestic Product at Sub-National Scales using Nighttime Satellite Imagery”, International Journal of Ecological Economics & Statistics, 8, pp. 5-21.
Shi K., Yu B., Huang Y., Hu Y., Yin B., Chen Z., Chen L., Wu J., 2014, “Evaluating the Ability of NPP-VIIRS Nighttime Light Data to Estimate the Gross Domestic Product and the Electric Power Consumption of China at Multiple Scales: A Comparison with DMSP-OLS Data”, Remote Sensing, 6, pp. 1705-1724.
Townsend A.C., Bruce D.A., 2010, “The use of night-time lights satellite imagery as a measure of Australia’s regional electricity consumption and population distribution”, International Journal of Remote Sensing, 31(16), pp. 4459–4480.
Vernon, H. Storeygard, A. & Weil, D., 2011, “A Bright Idea for Measuring Economic Growth”, American Economic Review, 101 (3), pp. 194-99.
Weidmann, N. Schutte, S., 2016, “Using night light emissions for the prediction of local wealth”, Journal of Peace Research, 54 (2), pp. 125-140.
Wu R., Yang D., Dong J., Zhang L., Xia F., 2018, “Regional Inequality in China Based on NPP-VIIRS Night-Time Light Imagery”, Remote Sensing, 10(2), 240.
Zhuo L., Ichinose T., Zheng J., Chen J., Shi P. J., Li X., 2009, “Modeling the population density of China at the pixel level based on DMSP/OLS non‐radiance‐calibrated night‐time light images”, International Journal of Remote Sensing, 30(4), pp. 1003-1018.
Zhang Q., Seto K. C., 2011, “Mapping Urbanization Dynamics at Regional and Global Scales Using Multi-Temporal DMSP (OLS Nighttime Light Data”, Remote Sensing of Environment, 115 (9), pp. 2320–2329.
Appendix 1: List of CoSMMA projects
ID Country Locality Latitude Longitude Journal Authors Publication
Year
Title
1 Nepal Tangting 28,596111 83,820278 Renewable Energy Gurung et al. 2011 The potential of a renewable
energy technology for rural electrification in Nepal: A case study from Tangting
2 Bangladesh Rangamati 22,657350 92,173269 Renewable and
Sustainable Energy Reviews
Mollik et al. 2016 Prospects, progress, policies, and effects of rural electrification in Bangladesh
3 Namibia Tsumkwe -19,598461 20,503669 Applied Energy Klintenberg
et al.
2014 Successful technology transfer: What does it take?
4 Namibia Tsumkwe -19,598461 20,503669 Renewable Energy Azimoh et
al.
2017 Replicability and scalability of mini-grid solution to rural electrification programs in sub-Saharan Africa
5 South Africa Lucingweni -32,178186 28,759153 Energy Conversion
and Management
Azimoh et al.
2016 Electricity for development: Mini-grid solution for rural
electrification in South Africa
6 Kenya Mpeketoni -2,390486 40,696842 Renewable and
Sustainable Energy Reviews
Sovacool et Ryan
2016 The geography of energy and education: Leaders, laggards, and lessons for achieving primary and secondary school electrification
7 Peru CampoAlegre -7,459931 -78,110114 Journal of Human
Development and Capabilities
Fernández-Baldor et al.
2014 Are technological projects reducing social inequalities and improving people's well-being? A capability approach analysis of renewable energy-based electrification projects in Cajamarca, Peru
8 Peru ElRegalado -6,959750 -78,671528 Journal of Human
Development and Capabilities
Fernández-Baldor et al.
2014 Are technological projects reducing social inequalities and improving people's well-being? A capability approach analysis of renewable energy-based electrification projects in Cajamarca, Peru
9 Philippines Pagan-anIsland 10,232010 123,967310 Renewable and Sustainable Energy Reviews
Hong et Abe 2012 Sustainability assessment of
renewable energy projects for off-grid rural electrification: The Pangan-an Island case in the Philippines
10 Chile Curepto -35,095856 -72,020889 Energy, Sustainability
and Society
Feron et al. 2016 Sustainability of rural
electrification programs based on off-grid photovoltaic (PV) systems in Chile
11 Gambia Darsilami 13,176203 -16,655658 Energy Policy
Moner-Girona
2009 A new tailored scheme for the support of renewable energies in developing countries
12 Buthan Trongsa 27,500228 90,508064 Renewable and
Sustainable Energy Reviews
Sovacool et Ryan
2016 The geography of energy and education: Leaders, laggards, and lessons for achieving primary and secondary school electrification
13 India Bhopa 26,689208 70,901178 Energy Policy
Moner-Girona
2009 A new tailored scheme for the support of renewable energies in developing countries
14 India Sanwata 26,106294 76,647047 Energy Policy
Moner-Girona
2009 A new tailored scheme for the support of renewable energies in developing countries
15 India Achala 26,663517 71,418061 Energy Policy
Moner-Girona
2009 A new tailored scheme for the support of renewable energies in developing countries
16 India Baiteena 26,634128 71,495236 Energy Policy
Moner-Girona
2009 A new tailored scheme for the support of renewable energies in developing countries
17 India Ranidhera 22,257528 81,766397 Biomass and
Bioenergy
Gmünder et al.
2010 Life cycle assessment of village electrification based on straight jatropha oil in Chhattisgarh, India
18 Uganda Kyannamukaaka 1,373333 32,290275 ND Furukawa 2012 Health and Safety Benefits of
Replacing Kerosene Candles by Solar Lamps- Evidence from Uganda
19 Montenegro Suvodol 41,207222 21,232500 SeeNews Electricity SeeNews
Electricity
2011 I. Electricity News and Data April 16
20 Myanmar Yonthalin 17,646994 95,451572 Renewable and Sustainable Energy Reviews
Pode et al. 2016 Solution to sustainable rural electrification in Myanmar
21 Myanmar Dagoondaing 21,848209 96,077141 Renewable and
Sustainable Energy Reviews
Pode et al. 2016 Solution to sustainable rural electrification in Myanmar
22 Iran Dorbid 32,123333 54,518611 Renewable and
Sustainable Energy Reviews
Dehghan 2011 Status and potentials of renewable
energies in Yazd Province-Iran
23 Serbia VelikaBiljanica 43,031156 22,015414 SeeNews Electricity SeeNews
Electricity
2011 I. Electricity News and Data April 16
24 South Africa Ezibeleni -31,886900 26,973469 Renewable energy Leitch et al. 1997 Non-grid electrification of 45
schools in the Eastern Cape, South Africa: an assessment
25 Senegal SineMoussaAbdou 14,867553 -16,817839 Nature Tollefson 2014 Energy: Islands of light
26 Slovenia Dravograd 46,589219 15,024603 SeeNews Electricity SeeNews
Electricity
2011 I. Electricity News and Data April 16
27 Brazil Igarapé -1,136494 -47,617825 Renewable and
Sustainable Energy Reviews
Sanchez et al.
2015 Renewable energy generation for the rural electrification of isolated communities in the Amazon Region
28 Brazil Joanes -0,879064 -48,510700 Renewable and
Sustainable Energy Reviews
Sanchez et al.
2015 Renewable energy generation for the rural electrification of isolated communities in the Amazon Region
29 Brazil Lencois -12,563678 -41,388414 Renewable and
Sustainable Energy Reviews
Sanchez et al.
2015 Renewable energy generation for the rural electrification of isolated communities in the Amazon Region
30 Brazil Maues -5,306489 -58,189292 Renewable and
Sustainable Energy Reviews
Sanchez et al.
2015 Renewable energy generation for the rural electrification of isolated communities in the Amazon Region
31 Brazil Tamaruteua -0,746222 -47,767833 Renewable and
Sustainable Energy Reviews
Sanchez et al.
2015 Renewable energy generation for the rural electrification of isolated communities in the Amazon Region
32 Brazil Timbo -0,940197 -49,639308 Renewable and
Sustainable Energy Reviews
Sanchez et al.
2015 Renewable energy generation for the rural electrification of isolated communities in the Amazon Region
33 Egypt Agaween 29,569636 26,419389 FRPT- Energy Snapshot
FRPT- Energy Snapshot
2017 Solar electrification project inaugurated in Matruh with Indian support
34 India Kulabira 23,065236 84,682986 Mlinda Foundation Sambodhi 2018 Baseline study of rural
electrification project in Gumla, Jharkand by Mlinda Foundation
35 India Aringtoli 23,101153 84,612886 Mlinda Foundation Sambodhi 2018 Baseline study of rural
electrification project in Gumla, Jharkand by Mlinda Foundation
36 India Passanga 23,124278 84,581764 Mlinda Foundation Sambodhi 2018 Baseline study of rural
electrification project in Gumla, Jharkand by Mlinda Foundation
37 India Kashira 23,049608 84,699444 Mlinda Foundation Sambodhi 2018 Baseline study of rural
electrification project in Gumla, Jharkand by Mlinda Foundation
38 India Sahitoli 22,927069 84,446458 Mlinda Foundation Sambodhi 2018 Baseline study of rural
electrification project in Gumla, Jharkand by Mlinda Foundation
39 India Narotoli 22,939017 84,465756 Mlinda Foundation Sambodhi 2018 Baseline study of rural
electrification project in Gumla, Jharkand by Mlinda Foundation
40 Greece Douneika 38,472947 21,666997 SeeNews Electricity SeeNews
Electricity
2011 I. Electricity News and Data April 16
41 Malaysia PulauPerhentian 5,903789 102,753740 Renewable Energy Borhanazad
et al.
2013 Potential application of renewable energy for rural electrification in Malaysia
42 India Kuhlachada 20,951667 85,098522 Renewable and
Sustainable Energy Reviews
Mishra et Behera
2016 Socio-economic and environmental implications of solar electrification: Experience of rural Odisha
43 Nepal PokhariChouri 27,570000 85,810000 Asia-Pacific Journal of
Rural Development
Rao 2006 Rural Infrastructure: A Critical Issue
for Farm Productivity in Asia
44 Malawi Gumulira -13,254308 34,301525 Renewable and
Sustainable Energy Reviews
Sovacool et Ryan
2016 The geography of energy and education: Leaders, laggards, and lessons for achieving primary and secondary school electrification
45 Malaysia TerumbuLayangLayan g
4,383889 118,656670 Renewable Energy Borhanazad et al.
2013 Potential application of renewable energy for rural electrification in Malaysia
46 India Tamkhua 27,154311 84,354206 Nature Tollefson 2014 Energy: Islands of light
47 New Zeland Tokelau -9,200200
-171,848400
Nature Tollefson 2014 Energy: Islands of light
48 Cambodia Charchouk 13,736653 103,705750 Renewable and
Sustainable Energy Reviews
Pode et al. 2015 Sustainable rural electrification using rice husk biomass energy: A case study of Cambodia
49 Philippines NewIbajay 11,180153 119,499170 Journal of
International Development
Marquardt 2014 How Sustainable Are Donor-Driven
Solar Power Projects in Remote Areas?
50 Myanmar Bine-dar 17,958511 96,719967 Renewable and
Sustainable Energy Reviews
Pode et al. 2016 Solution to sustainable rural electrification in Myanmar
Appendix 2: Computing P-values
Our objective is to build a counterfactual of NTL after T0, using the time series of NTL observed
before T0. This is our standard procedure (Groups 1 & 2 of projects). We obtain from
regressions of NTL on T, predicted NTL values (p) and their standard deviations (s). Using p and s, we can compute the probability of being false when concluding that post-T0 NLT is above
its predictor (P-values). We report in Table xxx the complement to 1 of these P-values, i.e. the probability that post-implementation NTL is above its predictor, in other words the probability of success.
When there are too many zeros (unobservable NTL) before T0, we do not have enough
information to compute p and s. In such cases (Group 3 to 5) we define conservative estimates (upper limits) of p and/or s, which we use to compute conservative estimates of the probability of success. In doing so, we aim to avoid Type I errors, i.e. declaring projects successful when they are failures.
- Group 1
For projects in Group 1, we have non-zero observations of NTL for all years before T0. We run
a linear regression of NTL on time T NTL = a + b*T + u
where T is time (year of observation) and u is the error term.
We use the parameters of this regression to build a predictor of NTL, p, and its standard deviation, s.
The probability that NTL observed after T0, X, be above its predictor is computed using the
Student ratio distribution: P(x>p) = t(d, (x-p)/s)
where d is the degree of freedom of our linear regression d=T0 - 1992 -2
and t(.,.) is the Student distribution function.
Note that if the parameter b is not significantly different from zero, we move the project to Group 3.
- Group 2
In Group 2 we have some zeros before T0 but we can run a tobit regression of NTL on T.
NTL = Max(l, a + b*T +u )
where l is the minimum observable NTL (0.111). Again, the probability that X is above p (predicted value of NTL) is