HAL Id: hal-00318362
https://hal.archives-ouvertes.fr/hal-00318362
Submitted on 29 Aug 2007
HAL is a multi-disciplinary open access
archive for the deposit and dissemination of
sci-entific research documents, whether they are
pub-lished or not. The documents may come from
teaching and research institutions in France or
abroad, or from public or private research centers.
L’archive ouverte pluridisciplinaire HAL, est
destinée au dépôt et à la diffusion de documents
scientifiques de niveau recherche, publiés ou non,
émanant des établissements d’enseignement et de
recherche français ou étrangers, des laboratoires
publics ou privés.
Lidar observations of sporadic Na layers over Gadanki
(13.5° N, 79.2° E)
Vishnu Parimisetty Prasanth, S. Sridharan, Y. Bhavani Kumar, D. Narayana
Rao
To cite this version:
Vishnu Parimisetty Prasanth, S. Sridharan, Y. Bhavani Kumar, D. Narayana Rao. Lidar observations
of sporadic Na layers over Gadanki (13.5° N, 79.2° E). Annales Geophysicae, European Geosciences
Union, 2007, 25 (8), pp.1759-1766. �hal-00318362�
www.ann-geophys.net/25/1759/2007/ © European Geosciences Union 2007
Annales
Geophysicae
Lidar observations of sporadic Na layers over Gadanki (13.5
◦
N,
79.2
◦
E)
P. Vishnu Prasanth, S. Sridharan, Y. Bhavani Kumar, and D. Narayana Rao
National Atmospheric Research Laboratory, Gadanki-517 112, Pakala Mandal, Chitoor District, Andhra Pradesh, India Received: 13 March 2007 – Revised: 12 July 2007 – Accepted: 26 July 2007 – Published: 29 August 2007
Abstract. We studied the characteristics of sporadic sodium
layers (SSLs) observed with the sodium (Na) resonance scat-tering lidar at Gadanki (13.5◦N, 79.2◦E). The SSLs were
observed on a total of 63 occasions during 464 h of Na lidar observations from January 2005 to February 2006. The ob-servations showed that one SSL event occurred, on average, every 7 h. The most prominent sporadic layer, which formed on 12 February 2005, exhibited a peak density of 60 722 Na atoms/cm3 around 92 km and it was nearly twice the peak density reported from elsewhere using ground-based obser-vations. In general, the SSLs exhibited the following char-acteristics: (1) they developed at heights between 88 and 98 km with an average height around 94 km; (2) maximum den-sity occurred during the early morning hours between 02:00 and 05:00 IST; (3) the ratio of the maximum peak Na den-sity to the average denden-sity was normally around 3 to 5 and it exceeded even 10 in some cases; (4) the events lasted from a few minutes to several hours. The formation period of the SSLs was longer compared to the decay period of the SSLs. Most of the SSL events showed downward motions.
Keywords. Atmospheric composition and structure (Middle
atmosphere – composition and chemistry; Thermosphere-composition and chemistry) – Radio science (Remote sens-ing)
1 Introduction
Since the experimental work of Bowman et al. (1969), ground-based lasers have now become the most important in-struments for observations of the sodium (Na) layer at meso-sphere and lower thermospheric heights. Since that time, measurements have been made in several parts of the world to delineate the characteristics of the Na layer. During these
Correspondence to: P. Vishnu Prasanth
(vishnu@narl.gov.in)
observations, researchers discovered the sudden formation of a dense thin Na layer, superposed on variations of normal sodium layer. Such an enhanced layer is called a sporadic sodium layer (SSL). The magnitude of enhancement is re-ferred to as the strength factor. During SSL events, the peak densities of the SSLs, in general, exceed the normal Na den-sities by a factor of 2–5 and sometimes by a factor of 10. The thickness of these sporadic Na layers is very small, typ-ically of the order of 1–2 km full width at half maximum (FWHM). The formation periods of the SSLs vary from a few minutes to several hours and some events have been ob-served for more than 6 h. Though the sporadic formation of thin dense metal atom layers has also been observed in other mesospheric metal atoms, namely, Fe and Ca, only SSLs have been studied for more than 20 years and are known to be common phenomena at low and high latitudes but rare at mid-latitudes (Batista et al., 1989; Hansen and von Zahn, 1990; Gardner et al., 1993; Nagasawa and Abo, 1995).
The SSL was first observed by Clemesha et al. (1978) at S˜ao Jos´e dos Campos, Brazil (23◦S, 46◦W). After the
dis-covery of the SSL, there have been many observations of SSL reported from low latitudes (Kwon et al., 1988; Batista et al., 1989; Beatty et al., 1989; Kane et al., 1993) and high lati-tudes (von Zahn et al., 1987; von Zahn and Hansen, 1988; Gardner et al., 1988; Collins et al., 1996; Heinselman et al., 1998, Williams et al., 2007). Lidar observations at both low and high latitudes indicated that their occurrence altitudes were usually in the upper part of the normal sodium layers and they often showed a downward motion with time.
Earlier, the SSLs were rarely observed at mid-latitudes. In nearly two decades of Na layer observations at mid-latitudes by several groups, only a few events of SSLs were detected (Senft et al., 1989; Gardner et al., 1993). However, Naga-sawa and Abo (1995) indicated that the occurrence rate of SSLs at Hachioji, Tokyo (35.6◦N, 139.4◦E) could be
compa-rable with that at low and high latitudes. According to them, the occurrence of SSLs depends on geomagnetic latitude
1760 P. Vishnu Prasanth et al.: Lidar observations of sporadic Na layers over Gadanki
rather than geographic latitude and the location of the ob-servation site, Hachioji, at low geomagnetic latitude (26◦N),
might be the reason for the high occurrence rate observed. Gong et al. (2002) also observed the frequent occurrence of SSLs at mid-latitudes.
There have been various generation mechanisms sug-gested for the occurrence of SSLs. Since there is a good cor-relation between Sporadic E (Es) and SSL at low and mid lat-itudes (Clemesha et al., 1980; Beatty et al., 1989; Kane et al., 1993; Nagasawa and Abo, 1995), it has been suggested that the conversion of Na+ions, Na bearing molecules, or smoke
particles could convert into neutral sodium atoms (Hansen and von Zahn, 1990; von Zahn and Murad, 1990). Kirk-wood and von Zahn (1991) suggested an alternative mecha-nism that a strong electric field could generate Es and SSLs in the auroral region. Cox et al. (1993) investigated the pos-sible chemical processes that could generate the SSLs by dissociative electron attachment to sodium containing sili-cate molecules. Zhou et al. (1993) suggested the temper-ature fluctuations induced by gravity waves, or other wave processes, might be the cause of the SSL layers. The depo-sition of sodium from meteors was also discussed based on observations at Sao Jose dos Campos (23◦S, 46◦W)
(Cleme-sha et al., 1978, 1980, 1988; Batista et al., 1989). Cleme(Cleme-sha et al. (1996) pointed out that vertical winds associated with gravity waves might form SSLs considering the fact that the peak of the background layer appeared to be lower in alti-tude than the SSL layer. Though the basic characteristics of SSLs have been understood, some aspects of SSLs, such as their formation mechanism and latitude dependence, are still unclear.
In the present study, we describe the instrument details of Na resonance lidar installed at Gadanki and the first results of SSLs obtained using the lidar observations for the period January 2005–February 2006.
2 Lidar instrument and data analysis
A state-of-the art Rayleigh and Mie backscattering lidar (Bhavani Kumar et al., 2000; Bhavani Kumar et al., 2001) was set up at Gadanki (13.5◦N, 79.2◦E) under the
Indo-Japanese collaboration programme in 1998. Recently the lidar system was augmented with the capability of prob-ing the mesospheric sodium. The broadband Na lidar sys-tem at Gadanki was setup in a mono-static configuration. The power-aperture product of the lidar system was approxi-mately 0.35 W m2. The detailed lidar specifications are given in Table 1. The transmitter consists of a tunable pulsed dye laser pumped by a frequency-doubled Nd: YAG laser. The pulsed dye laser is tuned to the D2resonant absorption line
of Na at a wavelength near 589 nm. The dye laser employs a dual grating system that is controlled by a computer which enables a rapid selection of transmitted wavelength. The line width of the laser is about 2 pm. The dye laser is pumped
with 200 mJ at 532 nm to obtain an output pulse energy of 25 mJ at 589 nm. The dye laser uses Kiton Red as the laser medium. The laser beam is expanded and transmitted into the atmosphere using a steering mirror. The receiving system uses a 750-mm Newtonian telescope with field optics and an interference filter. We employed a photomultiplier tube (PMT) for photon detection. The output pulses of the PMT are amplified by a broadband amplifier and then fed into a PC-based photon counting multi-channel scalar (MCS). The MCS counts the pulses in successive time bins. Each time bin is set to 2 µs, corresponding to a vertical resolution of 300 m. The photon counts are accumulated for 2400 shots, corre-sponding to a time resolution of 120 s. As the laser FWHM spectral width is 2 pm (about 1.7 GHz), the effective cross section of the Na atom, which is a function of the laser spec-tral width, is estimated to be 5.17×10⁻¹⁶m2. Then, using
this value in the equation for the concentration of sodium, given in Gardner (1989), the sodium concentration profiles are derived. The method of estimation of sodium concentra-tion profiles, along with the system details, were described in detail by Bhavani Kumar et al. (2007a). The first lidar observations of the sodium layers from Gadanki were also reported by Bhavani Kumar et al. (2007b).
In the total observation period of sodium density from Jan-uary 2005 to FebrJan-uary 2006, there are 464 h of sodium mea-surements. Among these, the SSL events are selected based on the following criteria: (i) the maximum density of the SSL peak must be at least two times higher than that of the Na layer at the same altitude (i.e. strength factor is larger than 2); (ii) the width of SSL (FWHM) must be less than 5 km and it should last for at least two successive lidar profiles. It may be noted that the SSL events occurring below 100 km (meso-spheric SSL events) are considered for the present study. The peak width is obtained by fitting a Gaussian curve to the max-imum density profile. Following these conditions, 63 SSL events could be identified from 10 January 2005 to 24 Febru-ary 2006. More specifically, in the 464 h of measurements from about 102 nights, 63 SSL events were clearly identified in 43 nights. Among these total 63 SSL events, 20 events can be considered as larger SSL events having a strength factor greater than 5.
3 Observations
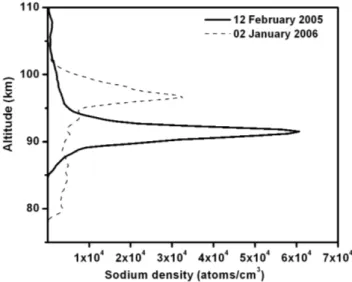
Figure 1 shows a typical SSL event for 2 January 2006 (dashed curve), with the maximum density of 33 460 cm−3at
an altitude of 97 km with a peak width of 2.7 km. A special SSL event is identified on 12 February 2005 (shown in the figure as a solid curve). During this event, the sodium den-sity over Gadanki peaks to the greatest ever observed value of 60 722 atoms/cm3. The peak density occurs at an altitude of 92 km with a peak width (FWHM) of 2.1 km. These profiles show that the occurrence of SSL events are highly variable in altitude, density and peak width.
Table 1. Main specifications of sodium lidar.
Transmitter Pump laser
Continuum, USA make Power Lite model 8020 Repetition rate 20 Hz
Energy (per pulse) 200 mJ max Laser beam size 8 mm Beam divergence 0.5 mrad Pulse width 6 ns Line width 1 cm−1 Dye laser
Continuum, USA make Jaguar Narrow scan model D90DMA Tunable range 330–740 nm
Tuning mechanism Dual Grating
Dye used Sulfo-Rhodamine -B (Kiton Red) Energy (per pulse) 25 mJ
Grating resolution 2400 lines/mm Precision 1 pm
Divergence Set to 1.0 mrad
Line width 0.05 cm−1or 2 picometer Stability 0.05 cm−1◦C−1h−1 External beam expander 10×
(CVI, USA)
Divergence 100 µrad (After beam expander)
Receiver
Telescope diameter 750 mm, Newtonian type Field of View 1.0 mrad
IF filter CW 589.0 nm IF filter FWHM 1.0 nm Peak transmission 60%
PMT 12 dynode, low dark current (1 nA), room cooled type (Hamamatsu make R3234-01)
Quantum efficiency 8%
Gain of PMT 2.5×10⁷units Data acquisition system
Type Single photon counting Model EG&G Ortec, MCS-plus Maximum counting rate 100 MHz
Bin width 2 µs Number of bins per pulse 1024
Figure 2 shows the histogram of the total number of hours of measurements (solid bar) and number of hours in which SSLs are present (grey bar) for each month. The number of measurements per month is not uniform throughout the year and there are no observations during June–July 2005, due to malfunctioning of the lidar system. It can be observed that the number of occurrences of SSLs is less in August and November, when the number of hours of measurements is more. The SSL events are quite frequent during the winter months (December, January and February). There is no sin-gle SSL event observed in March, April and May.
In order to show the formation and decaying of sodium layers, we present in Fig. 3 two examples in which the dura-tions of the SSL events are different. In the figure, the sodium density profiles are plotted in steps every 20 min for 11 uary 2005 (top panel) and in steps every 6 min for 15 Jan-uary 2005 (bottom panel). It can be observed in the top panel that a thin dense Na layer is superposed on the normal Na layer during 02:32–05:34 IST (Indian Standard Time, which is ahead of Local Time (LT) by 13.2 min). The duration of the event is around 3 h. The thickness of this layer (FWHM) is about 1.62 km. The duration of the event shown in the
1762 P. Vishnu Prasanth et al.: Lidar observations of sporadic Na layers over Gadanki
Fig. 1. Two examples of SSL profiles on 12 February 2005 (solid)
and 2 January 2006 (dashed).
Fig. 2. Histogram of the number of hours of sodium density
ob-servations (solid bar) and SSL events (grey bar) for each month of January 2005–May 2006.
bottom panel is relatively shorter (about 70 min), as the dense Na layer appears during 21:15–22:22 IST. The thickness of the layer is about 1.3 km. In both cases, both evolution and decaying of the SSL events can be observed. It can be noted that the evolution of the SSL event in both cases is slower, when compared to its decaying phase. This result is in con-trast with the earlier reports, namely, Batista et al. (1989) from low latitude and Gong et al. (2002) from mid-latitude.
A statistical analysis of a few important parameters esti-mated for the available SSL events is carried out and the re-sults are shown in Figs. 4a–d. Though there are, in total, 63 events available, to bring out the statistics, we selected the SSL events for which the beginning, evolution and ending of the events can be detected within the observation period
Fig. 3. Successive profiles of sodium density showing evolution
and decay of an SSL event on 11 January 2005 (top panel) and 15 January 2005 (bottom panel).
and in this way, we have only 35 events. The distribution of the SSL peaks with height is shown in Fig. 4a. From the figure, we can infer that most of the SSL events are located in the altitude range of 91–98 km with a maximum occur-rence of 6 events, each at 92 and 93 km. It may be noted that the SSL event appears in one case, even at altitudes as low as 88 km. These results are similar to those reported by Batista et al. (1989) and Gong et al. (2002) from low and mid-latitudes respectively. However, it is different from that reported by Hansen and von Zahn (1990) from high latitudes, where SSL peaks were observed to be in the range of 100– 110 km. Figure 4b shows the histogram of the layer thickness (FWHM, i.e. peak width of all 35 SSL events) versus num-ber of events. In some SSL events (about 7), the peak width is around 1.5–2 km and in some other events, it is around 4– 5 km. It may be recalled that the maximum FWHM is limited to 5 km in one of the criteria; we adopted this to identify an SSL event.
To define the strength factor we use the same definition as that used by von Zahn and Hansen (1988). According to
(a) (b)
(c) (d)
Fig. 4. Histograms of (a) peak location (b) peak width (c) strength factor and (d) duration of 35 SSL events observed.
them, it is the ratio between the sodium peak density at the maximum SSL evolution, and the density of the average layer at the same height before the start of the enhancement. From the histogram shown in Fig. 4c, we can infer that the strength factors of all 35 SSL events are distributed with a more fre-quent value of 2–4, which is similar to that reported by Gong et al. (2002). Batista et al. (1989) have also shown that most of the events have strengths between 2.5 and 3. Figure 4d shows the distribution of the sporadic sodium event duration. Most of the events continued for a few minutes to one hour. Some SSL events last for 2–4 h. Our observations could find one special event, which continued for about 7 h. These re-sults are consistent with those reported earlier (Kwon et al., 1988; Batista et al., 1989).
Other important parameters related to an SSL event are the rise and fall times of the layer. These parameters are defined as the time elapsed between the first appearance of a peak and
its reaching maximum amplitude and from maximum ampli-tude to the last profile where the peak was still distinguish-able (Batista et al., 1989). Figure 5 shows a histogram of the number of events as a function of their duration. Solid bars refer to the rise time and open bars to the fall time. From the figure, we can infer that in about 12 events each, the rise and fall times are less than 10 min. In each SSL event, we exam-ine the rise and fall times and can find that out of 35 events, the rise time is longer than the fall time in 21 events and is shorter in only 11 events. In the remaining three events, both rise and fall durations are nearly equal. The average rise time in all 35 events is around 48 min and is longer than the aver-age fall time, which is found to be around 30 min. This result is in contrast to that reported by Batista et al. (1989), Kwon et al. (1988), who observed a shorter rise time and longer decay time.
1764 P. Vishnu Prasanth et al.: Lidar observations of sporadic Na layers over Gadanki
Fig. 5. Frequency distribution of the rise (solid bars) and fall (open
bars) times of the sporadic events.
Fig. 6. Trajectories of the height of sporadic peaks.
Figure 6 shows a superposed plot of the height time histo-ries of SSL events observed at Gadanki. A downward motion of the peaks is observed in the majority of the events, al-though in a few cases, an upward movement is apparent. The average downward velocity is computed by fitting linearly the entire individual profiles, to be nearly 1 km/h. Batista et al. (1989) found a rate of fall of about 1 km/h at 23◦S,
whereas Kwon et al. (1988) showed typical rates of about 2 km/h at 19.5◦N.
Earlier observations showed that the SSLs are mainly ob-served at heights above 90 km in the upper part of the normal sodium layer (Clemesha, 1995, for example). We examine the location of SSLs relative to the normal sodium layer in our observation. Figure 7 shows the height distribution of 63 SSL events (grey bars) observed over Gadanki. The fig-ure shows that most of the SSLs over Gadanki were observed between 91 and 98 km with maximum occurrence at 93 km,
Fig. 7. Height distribution of sporadic Na layers (grey bars) and a
one-year averaged (January–December 2005) normal sodium den-sity profile.
Fig. 8. Histogram of the time of occurrence of SSL events for
early morning (01:00–06:00 IST) observations (top panel) and en-tire night (19:00–06:00 IST) observations (bottom panel).
whereas a one-year averaged (January–December 2005) nor-mal sodium layer peaks at 92 km (solid curve). This result is similar to that reported by Clemesha (1995). Hansen and von Zahn (1990) reported a similar distribution of SSLs over An-doya (69◦N, 16◦E), except during winter, when SSLs were
observed above 100 km, in many cases.
As the time of occurrence of SSLs appears to vary con-siderably with the location of the observations, we are inter-ested in bringing out the statistics over Gadanki. Figure 8 shows the time variation in the occurrence of SSLs observed at Gadanki. Since Na density observations were conducted for an entire night (19:00–06:00 IST) in some of the days and restricted to the early morning hours for the rest of the days (01:00–06:00 IST), we divided the observations into two
cases, namely, entire night observations (19:00–06:00 IST) and early morning observations (01:00–06:00 IST) and cal-culated the number of SSL peaks which occurred during each hour for the two cases separately. We obtained 32 events in the early morning observations and 31 events in the en-tire night observations. Figure 8 shows the histogram of the number of SSL events as a function of time for early morn-ing observations (top panel) and for entire night observations (bottom panel). From the figure, we can observe that the number of SSL peaks is larger during 03:00–05:00 IST. For example, 13 out of 32 events in the top panel and 5 out of 31 events in the bottom panel fall during these hours. Kwon et al. (1988) found that 11 of the 16 SSLs which they observed at 20◦N formed between 21:00 and 23:00 LT, whereas the
remaining layers occurred close to 04:00 LT. Our observa-tions are more consistent with those reported by Batista et al. (1989) at 23◦S, who observed SSLs between 15:00 and
09:00 LT, with a broad maximum at 03:00 LT. At mid- and high-latitudes, the distribution of SSLs has been found to be quite different from the low latitudes. Hansen and von Zahn (1990) showed a much narrower distribution for layers seen at Andoya, as all of their events occurred around 22:00 LT. Gong et al. (2002), at 31◦N, have shown that most of the
SSLs occurred in the early evening and midnight hours.
4 Discussions and conclusion
Past observations show that the sporadic Na layers have been observed frequently at low latitudes (Kwon et al., 1988, at Hawaii (20◦N), Batista et al., 1989, at S˜ao Jos´e dos Campos
(23◦S), Kane et al., 1993, at Arecibo (18◦N)) and high
lati-tudes (Hansen and von Zahn, 1990, at Andoya (69◦N),
Col-ins et al., 1996, at Poker Flat (65◦N)). At mid-latitude only a
small number of SSL events were detected at Haute Provence (44◦N) in France by Megie (1988) and at Illinois (40◦N) in
United States by Senft et al. (1989), although more than 10 years of lidar observations were conducted at both locations. The mean rate of SSL occurrence at high latitudes is one event per 5 h at 69◦N. At mid-latitudes, no single SSL event
was reported before 1995. Nagasawa and Abo (1995) first observed a lot of sporadic events at Hachioji (35◦N) and
found a mean occurrence rate of one event per 10 h. Gong et al. (2002) reported a similar mean occurrence rate of one event per 9 h at Wuhan (31◦N). At low-latitudes, the mean
rate of occurrences has a high value of about one event per 2 h at 20◦N (Kwon et al., 1988). At a similar latitude in the
Southern Hemisphere (Sao Jose dos Campos, 23◦S), the
oc-currence rate was reported earlier to be about one event in 17 h (Batista et al., 1989). Simonich et al. (2005) pointed out that the statistics used in Batista et al. (1989) were from data obtained with a low signal-to-noise ratio. With the re-cent data of more height resolution (250 m), acquired with a more powerful laser, they obtained the SSL occurrence rate of 29.5% for the nights. Our observations from the
low-latitude site, Gadanki (13.5◦N) shows that out of 102 nights
of observations, SSL events could be observed in 43 nights and hence the occurrence rate is around 42% of the nights. We also obtained the mean rate of SSL occurrence of about one event per 7 h. It may be noted that the occurrence rate at Gadanki is higher than that reported from other low-latitude sites.
Nagasawa and Abo (1995) suggested that the rate of SSL occurrence could depend on the geomagnetic latitude rather than the geographic latitude and the location site, Hachioji, at a low geomagnetic latitude of 26◦N, might be the reason for
the high occurrence rate observed. Our observations from the low geomagnetic site, Gadanki (6.3◦N), also shows a high
SSL occurrence.
The SSL layers occurring over Gadanki have, in general, a longer formation time than decay time. As shown in Fig. 5, the rise (evolution) time is less than 10 min in most of the events. In other events, it varies between 10 and 150 min, with an average value around 48 min. The decay time is, on average, around 30 min. The average rise time obtained in the present study is greater than that obtained for Mauna Kea (20◦N) and is less than the value for Brazil (23◦S). This
result is not in agreement with that reported from other low-latitude sites. For example, Batista et al. (1989) found that the average rise time (50 min) is less than the average fall time (174 min). Similarly, Kwon et al. (1988) obtained an average rise time of 15 min and fall time of 28 min.
We made comprehensive statistics on SSL events using nearly two years of sodium density observations, using a Na resonance lidar installed and operated over Gadanki. We could find that the statistical results on peak width, peak lo-cation, strength factor, etc., of the SSL events observed over Gadanki are in agreement with those reported earlier from low latitudes. However, we could observe longer formation time in most of the SSL events than decay time, and this re-sult is in contrast to earlier reports.
Acknowledgements. Authors would like to thank Department of
Space, Government of India for providing necessary infrastructure to carryout the present study.
Topical Editor U.-P. Hoppe thanks B. Williams and another anonymous referee for their help in evaluating this paper.
References
Batista, P. P., Clemesha, B. R., Batista, I. S., and Simonich, D. M.: Characteristics of the sporadic sodium layers observed at 23 de-gree S, J. Geophys. Res., 94, 15 349–15 358, 1989.
Beatty, T. J., Collins, R. L., Gardner, C. S., Hostetler, C. A., and Sechrist Jr., C. F.: Simultaneous radar and lidar observations of sporadic E and Na layers at Arecibo, Geophys. Res. Lett, 16, 1019–1022, 1989.
Bhavani Kumar, Y., Siva Kumar, V., Rao, P. B., Krishnaiah, M., Mizutani, K., Aoki, T., Yasui, M., and Itabe, T.: Middle atmo-spheric temperature measurements using ground based
instru-1766 P. Vishnu Prasanth et al.: Lidar observations of sporadic Na layers over Gadanki
ment at a low latitude, Ind. J. Rad. Space Phys., 29, 249–257, 2000.
Bhavani Kumar, Y., Siva Kumar, V., Jain, A. R., and Rao, P. B.: MST Radar and Polarization lidar observations of tropical cirrus, Ann. Geophys., 19, 873–883, 2001,
http://www.ann-geophys.net/19/873/2001/.
Bhavani Kumar, Y., Narayana Rao, D., Sundara Murthy, M., and Krishnaiah, M.: Resonance lidar system for mesospheric sodium measurements, Opt. Eng., 46(8), 1, doi:10.1117/1.2767271, 2007a.
Bhavani Kumar, Y., Vishnu Prasanth, P., Narayana Rao, D., Sun-daramurthy, M., and Krishnaiah, M.: The first lidar observations of the nighttime sodium layer at low-latitudes, Gadanki (13.5◦N, 79.2◦E), Earth Planets Space, 59, 601–611, 2007b.
Bowman, M. R., Gibson, A. J., and Sandford, M. C. W.: Atmo-spheric sodium measurements by a tuned Laser Radar, Nature, 221, 456–457, 1969.
Clemesha, B. R., Kirchhoff, V. W. J. H., Simonich, D. M., and Taka-hashi, H.: Evidence of an Extraterrestrial Source for the Meso-spheric Sodium Layer, Geophys. Res. Lett., 5, 873–876, 1978. Clemesha, B. R., Kirchhoff, V. W. J. H., Simonich, D. M.,
Taka-hashi, H., and Batista, B. P.: Spaced lidar and nightglow ob-servations of an atmospheric sodium enhancement, J. Geophys. Res., 85, 3480–3484, 1980.
Clemesha, B. R., Batista, P. P., and Simonich, D. M.: Concerning the origin of enhanced sodium layers, Geophys. Res. Lett, 16, 1267–1270, 1988.
Clemesha, B. R.: Sporadic neutral metal layers in the mesosphere and lower thermosphere – Review paper, J. Atmos. Terr. Phys., 57, 725–736, 1995.
Clemesha, B. R., Batista, P. P., and Simonich, D. M.: Formation of sporadic sodium layers, J. Geophys. Res., 101, 19 701–19 706, 1996.
Collins, R. L., Hallinan, T. J., Smith, R. W., and Hernandez, G.: Li-dar observations of a large high-latitude sporadic Na layer during active aurora, Geophys. Res. Lett., 23, 3655–3658, 1996. Cox, R. M., Plane, J. M. C., and Green, J. S. A.: A modeling
in-vestigation of sudden sodium layers, Geophys. Res. Lett., 20, 2841–2844, 1993.
Gardner, C. S., Senft, D. C., and Kwon, K. H.: Lidar observations of a substantial sodium depletion in the summertime Arctic meso-sphere, Nature, 332, 142–144, 1988.
Gardner, C. S., Kane, T. J., Senft, D. C., Qian, J., and Papen, G. C.: Simultaneous observations of sporadic E, Na, Ca layers at Ur-bana, Illinois: Three case studies, J. Geophys. Res., 98, 16 865– 16 873, 1993.
Gardner, C. S.: Sodium resonance fluorescence lidar applications in atmospheric science and astronomy, IEEEP, 77, 408–418, 1989.
Gong, S. S., Yang, G. T., Wang, J. M., Liu, B. M., Cheng, X. W., Xu, J. Y., and Wan, W. X.: Occurrence and characteristics of spo-radic sodium layer observed by lidar at a mid-latitude location, J. Atmos. Terr. Phys., 64, 1957–1966, 2002.
Hansen, G. and von Zahn, U.: Sudden sodium layers in polar lati-tudes, J. Atmos. Terr. Phys., 52, 585–608, 1990.
Heinselman, C. J., Thayer, J. P., and Watkins, B. J.: A high latitude observation of sporadic sodium and sporadic E – layer formation, Geophys. Res. Lett., 25, 3059–3062, 1998.
Kane, T. J., Gardner, C. S., Zhou, Q., Mathews, J. D., and Tepley, C. A.: Lidar, radar and airglow observations of a prominent spo-radic Na/ spospo-radic E layer event at Arecibo during AIDA – 89, J. Atmos. Terr. Phys., 55, 499–511, 1993.
Kirkwood, S. and von Zahn, U.: On the role of auroral electric fields in the formation of low altitude sporadic-E and sudden sodium layers, J. Atmos. Terr. Phys., 53(5), 389–407, 1991.
Kwon, K. H., Senft, D. C., and Gardner, C. S.: Lidar observations of sporadic sodium layers at Mauna Kea Observatory, Hawaii, J.Geophys. Res , 93(20), 14 199–14 208, 1988.
Megie, G.: Observations of Trace Metals in the Upper atmosphere in laser Remote chemical Analysis, edited by: Measures, R. M., Wiley, New York, pp. 333–408, 1988.
Nagasawa, C. and Abo, M.: Lidar observations of a lot of sporadic sodium layer in mid-latitude, Geophys. Res. Lett., 22, 263–266, 1995.
Senft, D. C., Collins, R. L., and Gardner, C. S.: Mid-latitude li-dar observations of large sporadic sodium layers, Geophys. Res. Lett., 16, 715–718, 1989.
Simonich, D., Clemesha, B., and Batista, P. P.: Sporadic Sodium Layers and the average vertical distribution of atmospheric sodium, Adv. Space Res., 35, 1976–1980 , 2005.
von Zahn, U., von der Gathen, P., and Hansen, G.: Forced release of sodium from upper atmosphere dust particles, Geophys. Res. Lett., 14, 76–79, 1987.
von Zahn, U. and Hansen, T. L.: Sudden neutral sodium layers: A strong link to sporadic E layers, J. Atmos. Terr. Phys., 50, 93– 104, 1988.
Von Zahn, U. and Murad, U. E.: NaHCO3: a source of Na atoms for sudden sodium layers?, Geophys. Res. Lett., 17, 147–149, 1990. Williams, B. P., Berkey, F. T., Sherman, J., and She, C. Y.: Coinci-dent extremely large sporadic sodium and sporadic E layers ob-served in the lower thermosphere over Colorado and Utah, Ann. Geophys., 25, 3–8, 2007,
http://www.ann-geophys.net/25/3/2007/.
Zhou, Q., Mathews, J. D., and Tepley, C. T.: A proposed tem-perature dependence mechanism for the formation of sporadic sodium layer, J. Atmos. Terr. Phys., 55, 513–521, 1993.