HAL Id: hal-00318198
https://hal.archives-ouvertes.fr/hal-00318198
Submitted on 21 Nov 2006
HAL is a multi-disciplinary open access
archive for the deposit and dissemination of
sci-entific research documents, whether they are
pub-lished or not. The documents may come from
teaching and research institutions in France or
abroad, or from public or private research centers.
L’archive ouverte pluridisciplinaire HAL, est
destinée au dépôt et à la diffusion de documents
scientifiques de niveau recherche, publiés ou non,
émanant des établissements d’enseignement et de
recherche français ou étrangers, des laboratoires
publics ou privés.
Comparison of long-term Moscow and Danish NLC
observations: statistical results
P. Dalin, S. Kirkwood, H. Andersen, O. Hansen, N. Pertsev, V. Romejko
To cite this version:
P. Dalin, S. Kirkwood, H. Andersen, O. Hansen, N. Pertsev, et al.. Comparison of long-term Moscow
and Danish NLC observations: statistical results. Annales Geophysicae, European Geosciences Union,
2006, 24 (11), pp.2841-2849. �hal-00318198�
www.ann-geophys.net/24/2841/2006/ © European Geosciences Union 2006
Annales
Geophysicae
Comparison of long-term Moscow and Danish NLC observations:
statistical results
P. Dalin1, S. Kirkwood1, H. Andersen2, O. Hansen2, N. Pertsev3, and V. Romejko4
1Swedish Institute of Space Physics, Box 812, SE-981 28 Kiruna, Sweden
2The Danish Association for NLC research, Lyngvej 36, Kølvr˚a, 7470 Karup J., Denmark
3A. M. Obukhov Institute of Atmospheric Physics, Russian Academy of Sciences, Pyzhevskiy per., 3, Moscow, 119017,
Russia
4The Moscow Association for NLC research, Moscow, Russia
Received: 12 April 2006 – Revised: 25 August 2006 – Accepted: 20 September 2006 – Published: 21 November 2006
Abstract. Noctilucent clouds (NLC) are the highest clouds in the Earth’s atmosphere, observed close to the mesopause at 80–90 km altitudes. Systematic NLC observations conducted in Moscow for the period of 1962–2005 and in Denmark for 1983–2005 are compared and statistical results both for sea-sonally summarized NLC parameters and for individual NLC appearances are described. Careful attention is paid to the weather conditions during each season of observations. This turns out to be a very important factor both for the NLC case study and for long-term data set analysis. Time series of sea-sonal values show moderate similarity (taking into account the weather conditions) but, at the same time, the compari-son of individual cases of NLC occurrence reveals substan-tial differences. There are positive trends in the Moscow and Danish normalized NLC brightness as well as nearly zero trend in the Moscow normalized NLC occurrence frequency but these long-term changes are not statistically significant. The quasi-ten-year cycle in NLC parameters is about 1 year shorter than the solar cycle during the same period. The char-acteristic scale of NLC fields is estimated for the first time and it is found to be less than 800 km.
Keywords. Geomagnetism and paleomagnetism (Time vari-ations, secular and long term) – Atmospheric composition and structure (Aerosols and particles) – Meteorology and at-mospheric dynamics (Middle atmosphere dynamics)
1 Introduction
Noctilucent clouds (NLC) can be seen during night in sum-mer, from May until September. These night clouds are com-prised of small ice particles that scatter sunlight and thus NLC are readily seen against the twilight arch. Several sta-tistical studies of the NLC occurrence rate over the last
sev-Correspondence to: P. Dalin
(pdalin@irf.se)
eral decades have been carried out up to the present time (Vestine, 1934; Schr¨oder, 1965, 1966; Vasilyev, 1967; Fogle and Haurwitz, 1974; Gadsden, 1990, 1998; Sugiyama, 1998; Zalcik, 1998; Thomas and Olivero, 2001; Thomas, 2003; Kirkwood and Stebel, 2003; Romejko et al., 2003). How-ever questions concerning secular trends in NLC characteris-tics, the relationship between NLC and solar activity as well as global change effects, discrepancies in the NLC statisti-cal behavior between different observational sites and many others are still unanswered. Although some of these ques-tions are certainly due to the complexity of the problem, it is also possible that NLC statistical features may to some ex-tent be explained by non-equivalent time series obtained with diverse observational techniques, where weather conditions have often been neglected. Generally speaking, this means the observations have non-equal statistical weights. Thus an important problem for further statistical research (and on the whole for an understanding of NLC phenomena) is to trans-form time series from different databases to a standardized form to be able to carry out statistically significant analysis.
In this work we present new statistics of NLC observations from Denmark for a period of more than 20-years, 1983– 2005, which provide a comprehensive estimation of NLC parameters including daily (during a NLC season) registra-tion of meteorological condiregistra-tions. This allows for a statisti-cally reliable correlation analysis with the Moscow database which also includes an estimation of tropospheric cloudiness. It should be noted that the Danish database contains a con-tinuous time series beginning from 1957 but data sets for the period of 1957–1982 are not as well documented (and in this sense, these data are not regular and have much larger sta-tistical error) and do not include the weather factor, which is very important, as it will be shown below. Therefore we do not consider Danish observations before 1983 in the present study.
2842 P. Dalin et al.: Comparison of long-term Moscow and Danish NLC observations 19600 1965 1970 1975 1980 1985 1990 1995 2000 2005 2 4 6 8 10 12 14 16 18 20 22 Years NLC number Moscow Denmark
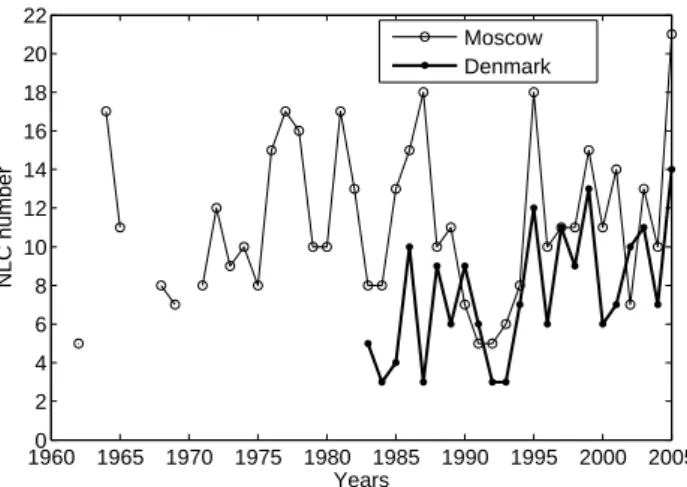
Fig. 1. Yearly variations in the total number of nights with NLC in
Denmark and Moscow. The thick line is for the Danish data, the thin line is for Moscow observations.
2 Available databases
Here we describe the technique of Danish NLC observa-tions and the corresponding database. The technique of NLC observations near Moscow (56◦N, 37◦E) can be found in Romejko et al. (2003).
Observations in Denmark are mainly conducted at three places: Vildbjerg (56N12, 08E46), Troelstrup (56N50, 09E32) and Kølvr˚a (56N17, 09E08). These and other obser-vational sites are located geographically close to each other and we may consider that these observations are made as from one position. Observations do show that in the case of NLC occurrence, they are observed simultaneously at all these points, with nearly the same weather conditions.
Observations in Denmark are carried out every year from 22 May to 11 August and an observer examines the twilight sky every 15 min, usually from 23:00 to 04:00 LT. The fol-lowing parameters are visually estimated as NLC occur:
– date and time of the observation;
– time of appearance and disappearance of NLC; – NLC brightness by a 3-point scale;
– morphological forms;
– left and right, upper and lower angular borders of the NLC field;
– meteorological conditions during the night.
As a rule, visual NLC observations are accompanied by pho-tographic registrations which provide a comprehensive, valu-able database of a high temporal resolution. This technique of visual observation is very close to that used in Moscow with two exceptions that for the latter there are no angular characteristics of the NLC field, and NLC brightness is esti-mated by a five-point scale. Therefore we have scaled Danish
19600 1965 1970 1975 1980 1985 1990 1995 2000 2005 50 100 150 200 250 300 350 400 Years NLC brightness [marks] Moscow Denmark
Fig. 2. Yearly variations of the Danish and Moscow NLC integral
brightness. The thick line is for the Danish data, the thin line is for Moscow observations.
NLC brightness values to Moscow ones with the following conventional scale:
– The NLC brightness of 1 point in Danish observations is equal to 1 point of Moscow NLC brightness; – The NLC brightness of 2 points in Danish observations
is equal to 3 points of Moscow NLC brightness; – The NLC brightness of 3 points in Danish observations
is equal to 5 points of Moscow NLC brightness. As it will be shown below, this seems to be quite reasonable. The statistics of observations in Denmark for 1983–2005 are as follows:
– total number of duty nights is 1863; – number of NLC occurrences is 174; – total duration of NLC visibility is 329 h.
In this statistics we include only reliably recognized NLC displays. The number of questionable cases is 7. This is a negligible value and it does not change the total statistics.
3 NLC statistics
By following the procedure of statistical analysis for the Moscow database, we have investigated three seasonally av-eraged variables:
– number of nights with NLC occurrence (Nnlc);
– integral NLC brightness (B), i.e. the sum of all the 15 min estimations of NLC brightness for the whole sea-son;
– number of clear and semi-clear weather nights.
1960 1965 1970 1975 1980 1985 1990 1995 2000 20050 0.1 0.2 0.3 0.4 0.5 0.6 0.7 0.8 Years
Relative number of NLC cases
Moscow Denmark
Fig. 3. Time series of normalized NLC frequency (normalized by
the number of clear weather nights) in Denmark and in Moscow. The thick line is for the Danish data, the thin line is for Moscow observations.
The yearly accumulated time series of the Danish and Moscow NLC occurrence rate are presented in Fig. 1. One can see a big difference in absolute values for the Moscow and Danish data. The reason of this fact is not clear so far. The maximum of the cross-correlation function is 0.50 (at zero correlation lag) and its 95% confidence limits are 0.11 and 0.76. At the same time we see that the main yearly vari-ations (like the big minima of 1983–1984 and 1991–1993, as well as significant maxima in 1995, 1998 and 2005) are readily reproduced by the both databases.
Figure 2 illustrates sets of the NLC yearly accumulated integral brightness. The maximum of the cross-correlation function is 0.48 (at zero correlation lag) with 95% confidence limits of 0.09 and 0.75. Note that absolute values of the Dan-ish integral brightness are in good agreement with Moscow ones which suggests that the NLC brightness is evaluated nearly identically both in Moscow and Denmark, as well as that we have scaled the Danish NLC brightness (estimated by a 3-point scale) to the Moscow one in a reasonable way.
Now we include into consideration the number of clear and semi-clear weather nights. Let’s input two new variables (in the same manner as was done in Romejko et al., 2003):
– estimation of the probability of NLC occurrence in clear or semi-clear night (normalized occurrence frequency):
Nnlc/Ngood weather
– normalized integral NLC brightness, i.e. the estimation of probability of the NLC brightness during clear or semiclear night (normalized brightness):
B/Ngood weather 1960 1965 1970 1975 1980 1985 1990 1995 2000 20050 2 4 6 8 10 12 14 16 Years
relative NLC brightness [marks]
Moscow Denmark
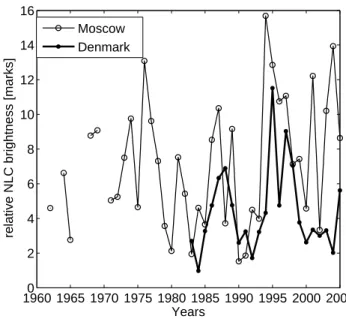
Fig. 4. Time series of normalized NLC integral brightness
(nor-malized by the number of clear weather nights) in Denmark and in Moscow. The thick line is for the Danish data, the thin line is for Moscow observations.
The comparison of yearly variations of the normalized NLC frequency in Denmark and Moscow data sets is shown in Fig. 3. We see the visual correspondence becomes better and actually the maximum correlation coefficient is 0.64 (95% confidence limits are 0.31 and 0.83) and occurs with a cor-relation lag equal to 1 year. However, the corcor-relation at zero lag is 0.42 which is within the 95% confidence limits of the value at 1-year lag, so the 1-year lag may be due to chance.
Figure 4 demonstrates normalized NLC brightness varia-tions. The maximum of the cross-correlation function is 0.61 (at lag equal to 1 year) with 95% confidence limits of 0.26 and 0.82. Thus, by regarding normalized NLC characteris-tics (i.e. taking into account weather conditions) the correla-tion between Moscow and Danish time series improves. This means that the weather factor disturbs the real signal in NLC data and the weather influence has to be removed for NLC statistics.
4 Ten-year cycle and secular change in NLC
character-istics
When considering long-term periodicities in NLC, two in-triguing questions arise every time: what mechanisms (apart from the solar cycle) are responsible for the quasi-ten-year cycle and is there a secular trend in NLC parameters? Con-sideration of these questions has a long and incomplete his-tory and is a challenge for present and future investigations.
Vestine (1934) collected the NLC reports from 1885–1933 and first noted that the greatest enhancements in occurrence frequency of these clouds (1887, 1899, 1911 and 1932)
2844 P. Dalin et al.: Comparison of long-term Moscow and Danish NLC observations
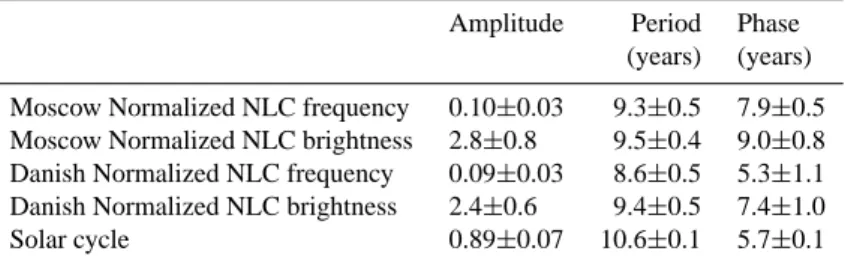
Table 1. Amplitude, period and phase of sinusoids extracted from Moscow and Danish data sets of the normalized NLC occurrence frequency
and normalized NLC brightness. Phase is defined relative to 1983, i.e. the beginning of the Danish database. Standard deviation for each value is shown. Solar cycle is represented by the Lα radiation averaged for June and July each year from 1962 to 2005.
Amplitude Period Phase
(years) (years)
Moscow Normalized NLC frequency 0.10±0.03 9.3±0.5 7.9±0.5
Moscow Normalized NLC brightness 2.8±0.8 9.5±0.4 9.0±0.8
Danish Normalized NLC frequency 0.09±0.03 8.6±0.5 5.3±1.1
Danish Normalized NLC brightness 2.4±0.6 9.4±0.5 7.4±1.0
Solar cycle 0.89±0.07 10.6±0.1 5.7±0.1
were near sunspot minima. Schr¨oder (1966) did not find any significant correlation of NLC activity with the sunspot cycle when considering German observations from 1884– 1964. According to the analysis of Vasilyev (1967), for epochs 1920–1941 and 1950–1960, the NLC decadal oscil-lation leads the solar activity cycle by 3 years and 1 year, respectively. Fogle and Haurwitz (1974) analyzed NLC time series from different catalogues covering the period of 1885– 1970. They found no persistent relationship between NLC and solar activity. However, these authors demonstrated a strong enhancement of the NLC activity of 1955–1960 that is exactly in phase with the solar cycle. Gadsden (1998), an-alyzing the NW European NLC data of 1964–1996, found a 10.4±0.1 year cycle with two-year time lag. He found an obvious secular trend in the NLC occurrence rate, but it has later been shown that this is an artefact of including of the Finnish NLC observations since 1984 (Kirkwood and Stebel, 2003). Klostermeyer (2002) reinvestigated the NW Europe NLC time series and concluded that NLC brightness increased by a factor of 5 between the periods 1964–1974 and 1985–1994, but this has been questioned as the data set lacks uniformly in local time (Gadsden, personal commu-nication). Thomas and Olivero (2001) analyzed series of NLC observations from Europe, the USSR and North Amer-ica and found a near 10-year periodic component and a two to three-year time lag of NLC maximum following solar cy-cle minimum. These authors found a strong upward trend in the period of 1964–1986. Later, by carefully analyzing Moscow observations of 1962–2002, Thomas (2003) argued that there was “. . . no significant long-term trend in NLC numbers but an increase in their average brightness”. Shet-tle et al. (2002) investigated polar mesospheric clouds, PMC (these are NLC but seen from space at high latitudes) and found that the brightest PMC increased in number from the period of 1983–1986 to the period of 1993–1996. DeLand et al. (2003), using long-term satellite measurements of 1978– 2002, found anticorrelaton between PMC and solar activity, with a phase lag ±1 year. These authors demonstrated that PMC have brightened over the period considered. Kirkwood and Stebel (2003) showed that changes in the phase of
sta-tionary planetary waves (with wave number 1) show a good correlation with the solar cycle with a 1–2 year shift. More-over, these authors showed that the influence of stationary planetary waves could account for as much as 50% of vari-ability in the decadal cycle in NLC. However the remain-ing half of NLC decadal changes remains unexplained up to now. Also these authors have demonstrated that there is no significant secular trend in the NLC occurrence frequency. Romejko et al. (2003) demonstrated that over Eastern Eu-rope the NLC occurrence and their brightness show a remark-able near-decadal cycle (9.4±0.2 years) with a period signif-icantly distinguishable from that of the solar-activity cycle (10.4±0.2 years). By analyzing three different data sets from 1960–2002 von Zahn (2003) concluded that there was no ev-idence for a long-term trend in the NLC occurrence rate. He emphasized that NLC data sets must cover a period of more than 50 years in order to establish any significant long-term trend.
In the present study we investigate quasi-decadal oscil-lations and secular trends in the NLC occurrence rate and NLC brightness by reanalyzing the Moscow extended data of 1962–2005 and by analyzing the Danish database of 1983– 2005.
As we have seen, the normalized NLC parameters (nor-malized by the number of clear weather nights) demonstrate better correlations than non-normalized characteristics. So it makes sense to investigate further exactly these time series.
We apply the least-squares technique for all time series to extract the best quasi-ten-year periods. Table 1 demon-strates amplitude, period and phase of sinusoids extracted from Moscow and Danish data sets of the normalized NLC occurrence frequency and normalized NLC brightness. We see that almost all quasi-decadal periods found are signifi-cantly shorter (by about 1 year) than the period of the so-lar cycle of 10.6±0.1 year. The soso-lar cycle is expressed in terms of the Lyman-α (Lα) radiation at 121.6 nm (http: //lasp.colorado.edu/lisird; Woods et al., 2000), averaged for June and July each year. The only exception is the period of the normalized Danish NLC frequency that is shorter than the solar cycle by 2 years. As all the NLC periods are shorter
1960 1965 1970 1975 1980 1985 1990 1995 2000 2005 −0.4 −0.2 0 0.2 0.4 Years
Normalized NLC occurrence frequency residuals
1960 1965 1970 1975 1980 1985 1990 1995 2000 2005 −0.4 −0.2 0 0.2 0.4 Years 1960 1965 1970 1975 1980 1985 1990 1995 2000 2005 −0.4 −0.2 0 0.2 0.4 Years
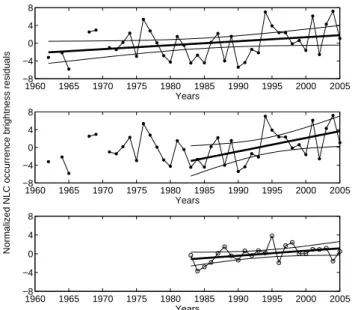
Fig. 5. Residuals (after the subtraction the variation correlated with
the Lα flux) of the normalized NLC frequency. The thick line rep-resents the secular trend and its 95% confidence interval. The upper panel demonstrates the Moscow linear fit for 1962–2005, the cen-tral panel is for the Moscow linear fit for 1983–2005 and the lower panel is for the Danish data for 1983–2005.
than the period of solar activity the lag between the max-imum of solar cycle and the minmax-imum of NLC activity is found to vary from 0 to 3 years depending on decade. Proba-bly this is why different investigators obtained various phase shifts when considering data sets from different epochs. Thus besides a dominating role of the solar cycle there should be presented other mechanisms responsible for yearly variations in NLC characteristics and the main candidate is thought to be dynamical effects in temperature caused by the planetary wave activity (Kirkwood and Stebel, 2003). These authors found that there is a strong correlation between the phase of the stationary waves and the 10–11 year cycle of solar activ-ity (with one year lag) that may produce an observed shift between the NLC activity and solar cycle.
Now we consider the question concerning the presence of secular trends in the analyzed data sets. The yearly varia-tions in the Lα flux were linearly scaled and shifted by the best correlation lag to match the NLC time series in least square sense. This variation was then subtracted from yearly variations in normalized NLC characteristics and a linear re-gression made to the residual data. Figures 5 and 6 show residuals of the normalized NLC frequency and normalized NLC brightness, respectively. The upper and central panels demonstrate linear trends for Moscow NLC time series for 1962–2005 and for 1983–2005, respectively, and the lower panels illustrate the Danish data for 1983–2005. We have also analyzed the data by subtracting the quaten-year si-nusoidal signals (in Table 1) from normalized NLC charac-teristics and made the same regression analysis for residuals
1960 1965 1970 1975 1980 1985 1990 1995 2000 2005 −8 −4 0 4 8 Years
Normalized NLC occurrence brightness residuals
1960 1965 1970 1975 1980 1985 1990 1995 2000 2005 −8 −4 0 4 8 Years 1960 1965 1970 1975 1980 1985 1990 1995 2000 2005 −8 −4 0 4 8 Years
Fig. 6. Residuals (after the subtraction the variation correlated with
the Lα flux) of the normalized NLC brightness. The thick line rep-resents the secular trend and its 95% confidence interval. The upper panel demonstrates the Moscow linear fit for 1962–2005, the cen-tral panel is for the Moscow linear fit for 1983–2005 and the lower panel is for the Danish data for 1983–2005.
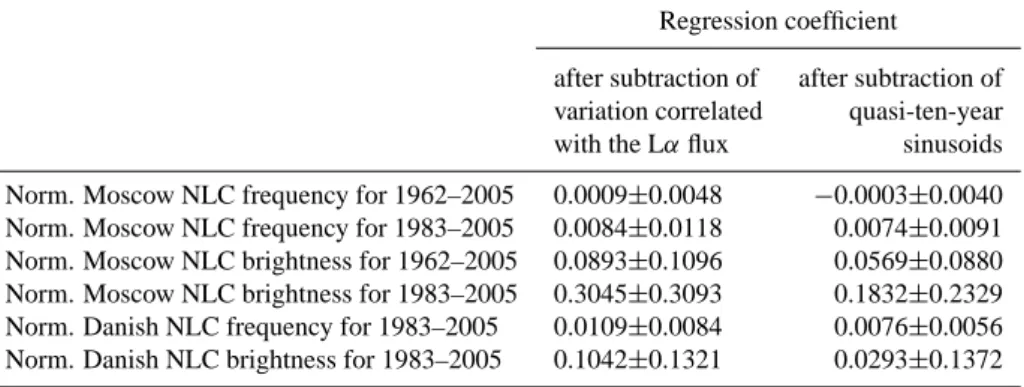
(these results are not shown in any Figure). Table 2 illustrates the regression coefficient and its 95% confidence interval in for each data set. One can see there are positive trends for both the Moscow and Danish normalized NLC frequency and brightness for 1983–2005. By considering Moscow data sets for the period of 1962–2005, the positive trend is observed in the normalized NLC brightness and nearly zero trend is present in the normalized NLC occurrence frequency. It is important to note that 95% confidence intervals of these lin-ear fits are wide and thus these long-term changes have no statistical significance. The only exception is for the Danish normalized NLC frequency demonstrating large and statisti-cally significant positive trend for 1983–2005. Note that sub-traction of both real solar cycle and quasi-ten-year sinusoidal signals from yearly NLC variations leads to qualitatively the same result: all trends are positive excepting the trend in the Moscow normalized NLC occurrence frequency for 1962– 2005 which is slightly negative after subtracting a sinusoidal signal. However the trends found lack statistical significance. If we combine the Moscow and Danish data sets for the pe-riod of 1983–2005 then we obtain average trends in the NLC occurrence frequency and NLC brightness (Table 3). In this case, the statistical significance is increased (due to doubled number of points) and trends for all the NLC characteristics become slightly positive and significant (more than 95%) for about 20 years. However, we should note that there is no evidence for statistically significant (more than 95%) secular changes of NLC activity for more than 40 years of observa-tions in the period of 1962–2005.
2846 P. Dalin et al.: Comparison of long-term Moscow and Danish NLC observations
Table 2. Regression coefficient and its 95% confidence interval for residuals of the normalized frequency and normalized brightness of
Moscow and Danish NLC data sets.
Regression coefficient
after subtraction of after subtraction of
variation correlated quasi-ten-year
with the Lα flux sinusoids
Norm. Moscow NLC frequency for 1962–2005 0.0009±0.0048 −0.0003±0.0040
Norm. Moscow NLC frequency for 1983–2005 0.0084±0.0118 0.0074±0.0091
Norm. Moscow NLC brightness for 1962–2005 0.0893±0.1096 0.0569±0.0880
Norm. Moscow NLC brightness for 1983–2005 0.3045±0.3093 0.1832±0.2329
Norm. Danish NLC frequency for 1983–2005 0.0109±0.0084 0.0076±0.0056
Norm. Danish NLC brightness for 1983–2005 0.1042±0.1321 0.0293±0.1372
Table 3. Regression coefficient and its 95% confidence interval for residuals of the normalized frequency and normalized brightness for the
combined Moscow and Danish NLC data set for the period of 1983–2005.
Regression coefficient
after subtraction of after subtraction of
variation correlated quasi-ten-year
with the Lα flux sinusoids
Norm. NLC frequency (Moscow+Denmark) 0.0097±0.0072 0.0075±0.0053
Norm. NLC brightness (Moscow+Denmark) 0.2044±0.1682 0.1063±0.1352
5 Day-to-day comparison of NLC appearance in
Moscow and Denmark
As we have mentioned there is not yet sufficient informa-tion available on NLC distribuinforma-tion around the globe and what their characteristic scales are. A little knowledge is obtained with model simulations and with NLC/PMC observations from space. However, there are certain limitations to observ-ing NLC/PMC from space. Satellites capable of NLC/PMC observations make about 15 orbits per day around the globe which implies a very large gap of 900–1500 km between mapped points in the latitude range of 70◦–55◦. Also, such observations are of a low spatial resolution (several hundreds km). Ground-based observations made, for example, from NW Europe cannot answer questions concerning the NLC homogeneity because all available observational sites are lo-cated close to each other. It is necessary to compare simul-taneous observations from positions separated by a large dis-tance (it is better if points are along the same latitude circle). Besides, the compared data sets should be made using the same technique and should include meteorological descrip-tions for observadescrip-tions because an individual NLC appearance depends on tropospheric cloudiness. The Moscow and Dan-ish databases satisfy all these requirements and can be used to investigate individual NLC displays in detail.
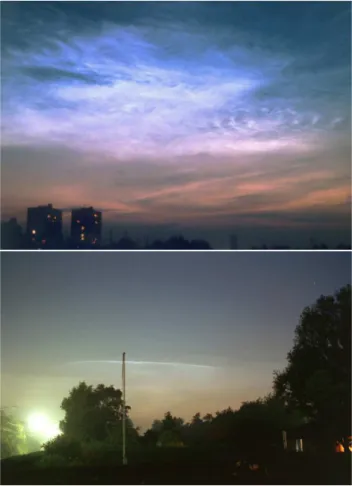
For this purpose all nights when there was good weather both in Denmark and Moscow were selected, i.e. these were “potential favorable” nights in which NLC could simultane-ously be observed. Then the number of nights with NLC displays in Moscow or/and Denmark has been calculated as well as the number of nights with simultaneous NLC obser-vations at both sites. The result is presented in Fig. 7. We can see there are only a few nights with simultaneous NLC cases. The lower panel shows that NLC have been observed in the same night, on average, in 20–40% of all favorable nights except for 1995 when the ratio reaches 70%. Actu-ally there are many cases when even extremely bright NLC were observed from one point only. Plate 1 illustrates the importance of the geographical location factor. These pho-tographs were taken on 7–8 July 2002 in Moscow (upper panel) and Denmark (lower panel) at local times representing maximal (for that night) brightness of NLC at each site. One can see completely different NLC activity in the same night. The Moscow NLC were observed as very bright (5 points) and extended in a big square. The Danish NLC display was represented only by several bands of quite low brightness (2 points). Actually these photos demonstrate physically differ-ent NLC fields, due to the large distance between Moscow and Denmark, but nevertheless we could expect nearly the same physical conditions in the mesopause to form similar
19800 1985 1990 1995 2000 2005 2 4 6 8 10 12 14 Years NLC number 19800 1985 1990 1995 2000 2005 10 20 30 40 50 60 70 Years Percentage NLC in DK or/and in MOS NLC both in DK and in MOS
Fig. 7. Upper panel: Comparison of each case of NLC occurrence
between Denmark and Moscow. The black bars are NLC displays observed in Denmark or/and in Moscow. The white bars are NLC cases observed simultaneously in the same night. Lower panel: The percentage ratio of white to black bars.
clouds in the longitudinal sector of 8◦–37◦. But this is clearly not the case. Thus we can make a very important conclu-sion: NLC are locally formed but not on continental scales. It means there are some physical processes in the mesopause that are functions of longitude.
We can roughly estimate the characteristic scale of the NLC field in the following way. But first, we have to clar-ify what we mean by the term “characteristic scale”. Char-acteristic (or typical, or correlation) scale can be estimated if there are multi-point observations and a large statistical sam-ple of suitable observations. The characteristic scale of NLC is a product of all the processes taking place in the formation and movement of NLC, such as, dynamics (small-, medium-and large-scale gravity waves, planetary waves, solar thermal and lunar gravitational tides), chemistry, transport, solar cy-cle dependence, amount and distribution of water vapour and condensation nuclei and so on. Previous works have dealt with one (or a few) of these factors. For example, there have been many studies dealing with the effect of gravity waves on NLC. It is clear that NLC, as a tracer of conditions at the mesopause, should reflect all the scales of gravity waves present there (from 10 to 1000 km). But it does not mean that gravity waves alone control the characteristic scale of NLC. All physical and chemical processes contribute to the formation and dynamics of NLC around the globe. We have not found any reliable conclusions about characteristic scales of NLC in the literature, excepting the paper by Carbary et al. (2003) in which satellite data of high spatial resolution were used. Carbary et al. (2003) demonstrated the geograph-ical distribution of PMC and found that horizontal scales of PMC were more than 100 km. But this result has been
Plate 1. Photographs demonstrating different NLC activity above
Moscow (the upper panel, photo by Peter Dalin) and Denmark (the lower panel, photo by Holger Andersen) in the same night on 7–8 July 2002.
obtained by using the only 23 passes made by the UVISI imager for 1997–1999. This should be regarded as a case study and this result cannot be regarded as typical horizontal scales of PMC, because physical and chemical processes in the mesopause vary from time to time and from year to year. Now we can make a rough estimate of the characteris-tic scale of NLC. The average latitude of NLC as observed from a position at 56◦is about 60◦. The distance along the
great circle between points located at 60◦with the longitudes of Moscow and Denmark is equal to 1600 km. By taking into account the fact that NLC have been observed on the same night, on average, in 20–40% of all nights with a good weather, we can estimate the characteristic (or correlation) scale as less than half this distance (800 km) beyond that, NLC are poor correlated. We have to note that horizontal scales of PMC found in Carbary et al. (2003), as more than 100 km, are consistent with our estimation of the character-istic scale of NLC as less than 800 km.
Usually, NLC are observed within the azimuth range of
±60 degrees of the north. In principle, this could provide the
2848 P. Dalin et al.: Comparison of long-term Moscow and Danish NLC observations 400 and 1300 km. But NLC are seen, on average, close to
the north and from the statistical point of view (as far as we regard a great number of simultaneous observations between Moscow and Denmark) it is reasonable to consider NLC with the azimuth close to zero. Therefore, the characteristic scale of less than 800 km seems to be reasonable.
Advection of NLC fields might influence the estimation of the characteristic scale if the same cloud of a small scale, moving due to the background zonal wind, was observed at two sites at different times (time delay due to advection). In this case such a small cloud might look like a big cloud ob-served on the same night (but not at the same time) in two sites. One can estimate the role of the advection by taking the mean zonal easterly wind equal to 40 m/s (as the upper limit) in the sub-polar summer mesopause (Andrews et al., 1987) and maximal duration of observations of 5 h, and plus 2 h due to the time difference between Moscow and Denmark (totally 7 h). Then we obtain the advection of the cloud as about 1000 km (as the upper limit) along the latitude circle. This distance is theoretically enough for the cloud to be ob-served in two sites (separated by 1600 km) but, in this case, the cloud should be observed in early evening hours at the left edge of the twilight sky in Moscow and then it should be seen in morning hours at the right edge of the twilight sky in Denmark. We could not find such a case in our observations: almost all NLC displays, seen both in Moscow and Denmark in the same night, have been observed during a few hours close to or around local midnight. It means that NLC, seen from these sites, are spatially different fields (patches) but which can be as a part of the large-scale NLC area covering the distance between Moscow and Denmark. Summarizing, advection does not significantly influence the estimation of the NLC characteristic scale in the present study.
Further investigation with a more detailed network of ground-based observations is needed to further quantify this rough estimation. Nevertheless, the correlation length of less than 800 km seems to be reasonable as a first approximation.
6 Conclusions
We have compared in detail Danish and Moscow NLC char-acteristics both for seasonally accumulated values and for in-dividual cases of NLC appearance and can conclude the fol-lowing:
1. The weather conditions are found to be important for the statistical characteristics of NLC. We confirm this re-sult, found in Romejko et al. (2003), using an extended (Moscow) data base as well as new (Danish) data which have not been considered before.
2. Yearly averaged, non-normalized NLC characteristics (occurrence rate and brightness) show moderate corre-lations of 0.50 and 0.48, respectively. By considering the normalized NLC occurrence rate and normalized
brightness (normalized by the number of clear weather nights) the correlations between the two sites are in-creased up to 0.64 and 0.61, respectively.
3. All quasi-ten-year periods found are significantly shorter (by about 1 year) than the period of solar activity (10.6 year). This leads to a slowly moving lag between the maximum of the solar cycle and the minimum of NLC activity, varying from 0 to 3 years depending on decade.
4. Positive trends are observed in the Moscow and Danish normalized NLC frequency and brightness for 1983– 2005. At the same time the Moscow data demonstrate nearly zero trend in the normalized NLC occurrence frequency and a positive trend in the normalized NLC brightness for the period of 1962–2005. All these long-term changes lack statistical significance. Summariz-ing, there is no evidence for statistically significant sec-ular changes of NLC activity, neither for occurrence fre-quency nor for brightness.
5. The day-to-day comparison of simultaneous NLC oc-currences in Denmark and Moscow reveals significant differences. Analysis shows that NLC observed over NW Europe and Moscow are seen primarily indepen-dently and not simultaneously. NLC have been ob-served in the same night, on average, on 20–40% of all nights with good weather. This indicates that the char-acteristic scale of NLC fields is less than 800 km along the latitude circle of 60◦N. This must be due to varying physical conditions in the mesopause around the globe.
Acknowledgements. Topical Editor U.-P. Hoppe thanks S. Chernouss and another referee for their help in evaluating this paper.
References
Andrews, D. G., Holton, J. R., and Leovy, C. B.: Middle atmo-sphere dynamics, Academic Press, San Diego, 1987.
Carbary, J. F., Morrison, D., and Romick, G. J.: Maps of
polar mesospheric clouds, J. Geophys. Res., 108(D8), 8446, doi:10.1029/2002JD002255, 2003.
DeLand, M. T., Shettle, E. P., Thomas, G. E., and Olivero, J. J.: So-lar backscattered ultraviolet (SBUV) observations of poSo-lar meso-spheric clouds (PMCs) over two solar cycles, J. Geophys. Res., 108(D8), 8445, doi:10.1029/2002JD002398, 2003.
Fogle, B. and Haurwitz, B.: Long term variations in noctilucent cloud activity and their possible cause, in: Climatological Re-search, edited by: Fraedrich, K., Hantel, M., Claussen Korff, H., and Ruprecht, E., Bonner Meteorologische Abhandlungen, 7, 263–276, Bonn, Germany, 1974.
Gadsden, M.: A secular change in noctilucent clouds occurrence, J. Atmos. Terr. Phys., 52, 247–251, 1990.
Gadsden, M.: The North-West Europe data on noctilucent clouds: a survey, J. Atmos. Solar-Terr. Phys., 60, 1163–1174, 1998.
Kirkwood, S. and Stebel, K.: Influence of planetary waves on noc-tilucent cloud occurrence over NW Europe, J. Geophys. Res., 108(D8), 8440, doi:10.1029/2002JD002356, 2003.
Klostermeyer, J.: Noctilucent clouds getting brighter, J. Geophys. Res., 107(D14), doi:10.1029/2001JD001345, 2002.
Romejko, V. A., Dalin, P. A., and Pertsev, N. N.: Forty years
of noctilucent cloud observations near Moscow: database
and simple statistics, J. Geophys. Res., 108(D8), 8443, doi:10.1029/2002JD002364, 2003.
Schr¨oder, W.: Ergebnisse und probleme der erforschung der leucht-enden nachtwolken, Gerlands Beitr¨age zur Geophysik, 1, 45–55, 1965.
Schr¨oder, W.: Noctilucent clouds over Germany, J. Geophys. Res., 71(13), 3284, 1966.
Shettle, E. P., Thomas, G. E., Olivero, J. J., Evans, W. F. J., Debres-tian, D. J., and Chardon, L.: Three satellite comparison of polar mesospheric clouds: evidence for long-term change, J. Geophys. Res., 107(D12), 4134, doi:10.1029/2001JD000668, 2002. Sugiyama, T.: Statistical study of Noctilucent cloud occurrence in
Western Europe, Proc. NIPR Symp. Upper Atmos. Phys., 11, 81– 87, 1998.
Thomas, G. E. and Olivero, J.: Noctilucent clouds as possible in-dicators of global change in the mesosphere, Adv. Space Res., 28(7), 937–946, 2001.
Thomas, G. E.: Are noctilucent clouds harbingers of global change in the middle atmosphere?, Adv. Space Res., 32(9), 1737–1746, doi:10.1016/S0273-1177(03)00674-4, 2003.
Vasilyev, O. B.: Astrophysical research of noctilucent clouds, (in Russian), 86 pp., Astronomicheskii Sovet AN SSSR, Moscow, 1967.
Vestine, E. H.: Noctilucent clouds, J. Roy. Astron. Soc. Can., 28, 249–272, 303–313, 1934.
von Zahn, U.: Are noctilucent clouds truly a “miner’s canary” for global change?, EOS TRANS. AGU, 84(28), 261, 264, 2003. Woods, T. N., Tobiska, W. K., Rottman, G. J., and Worden, J. R.:
Improved solar Lyman α irradiance modeling from 1947 through 1999 based on UARS observations, J. Geophys. Res., 105(A12), 27 195–27 215, 2000.
Zalcik, M.: A possible increase in mid-latitude sightings of noctilu-cent clouds?, J. Roy. Astron. Soc. Can., 92, 197–200, 1998.