HAL Id: insu-01252789
https://hal-insu.archives-ouvertes.fr/insu-01252789
Submitted on 12 Jan 2016
HAL is a multi-disciplinary open access
archive for the deposit and dissemination of
sci-entific research documents, whether they are
pub-lished or not. The documents may come from
teaching and research institutions in France or
abroad, or from public or private research centers.
L’archive ouverte pluridisciplinaire HAL, est
destinée au dépôt et à la diffusion de documents
scientifiques de niveau recherche, publiés ou non,
émanant des établissements d’enseignement et de
recherche français ou étrangers, des laboratoires
publics ou privés.
Imaging polarimetry of comet
73P/Schwassmann-Wachmann 3 main fragments during
its 2006 apparition
Edith Hadamcik, Anny Chantal Levasseur-Regourd
To cite this version:
Edith
Hadamcik,
Anny
Chantal
Levasseur-Regourd.
Imaging
polarimetry
of
comet
73P/Schwassmann-Wachmann 3 main fragments during its 2006 apparition.
Planetary and
Space Science, Elsevier, 2016, 123, pp.51-62. �10.1016/j.pss.2015.12.012�. �insu-01252789�
Imaging polarimetry of comet 73P/Schwassmann-Wachmann 3 main
fragments during its 2006 apparition
E. Hadamcik
a*and A.C. Levasseur-Regourd
bSorbonne Universités, UPMC Univ. Paris 06; Université Versailles St-Quentin, CNRS/INSU, LATMOS-IPSL
a11 bld d’Alembert, 78280 Guyancourt, France; b
BC 102, 4 place Jussieu, 75005 Paris edith.hadamcik@latmos.ipsl.fr phone 00 33 (0)180285278
Abstract
We have observed the dust ejected by parts of the nucleus (so-called fragments or components) of comet 73P/Schwassmann-Wachmann 3 during seven consecutive nights from 2006, April 27 to May 3 by imaging polarimetry using the 0.8 m telescope at OHP (Observatoire de Haute-Provence, France). Three fragments were observed, B and C main fragments on all nights and G fragment on two nights at 24 h interval. Fragment C, which almost behaves as a normal comet, presents some night-to-night evolution on polarization maps together with some sunward-jets morphology. Fragment B, as noticed by numerous observers, continues to fragment, with clues to the presence of large secondary fragments, tailward on the intensity images; an increase of activity is noticed on May 2. Jets and fans are observed sunward, with a larger extension in fragment C than in B. Fragment G is fainter and, as fragment B, it continues to fragment. A short sunward jet is detected on the rotational gradient image together with an important tailward structure. The integrated polarization for the two main fragments is typical of polarization of high-Pmax comets. An important evolution is
observed from night-to-night on the polarization maps. Fragment C presents, in two nights at 48 h interval, a lower polarization in the inner coma, neither observed in the intermediate night nor later. A high polarization is also observed on the two sides of the lower polarization regions. In fragment B, the regions around the secondary fragments have a higher polarization than the surrounding coma, They are easily detected in the treated intensity images. As usually, the polarization increases when the phase angle increases. Numerous observers have found similar chemical compositions for the two main fragments together with differences in their optical properties, suggesting heterogeneities in the physical properties during the aggregation of the original nucleus and/or changes after the ejection of dust particles.
Keywords: comets; individual; comet 73P/Schwassmann-Wachmann 3; dust; fragmentation; linear polarization.
1- Introduction
Comet 73P/Schwassmann-Wachmann 3 (hereafter SW3) passed close to Earth (perigee on May 12 at 0.079 au) in April-May 2006, allowing a high spatial resolution imaging and numerous remote observations. It is a very active Jupiter-Family Comet (JFC) with an orbital period of 5.36 years and an orbit inclination of 11.39°. Its increasing activity in 1995 was detected by radio observations (Crovisier et al., 1995). The existence of at least four fragments (named A, B, C, D) was revealed in December 1995 by photometry in the red wavelength domain and thermal observations (Boehnhardt et al., 1995). In 2001, the recovered fragments B and C and a new fragment E appeared well separated (Boehnhardt, 2002). Altogether, more than sixty fragments were detected in 2006, although evidence for none of them was found around the main fragment C, which was the primary component (Toth et al., 2006). Dello Russo et al. (2007) studying the volatile composition of fragments B and C found similar compositions, qualified as carbon-chain depleted (DiSanti et al., 2007).
The linear polarization of the solar light scattered by dust around main fragments (B and C) was also studied in the visible and the near Infrared (Bonev et al., 2008; Jones et al., 2008; Kiselev et al., 2008). Linear polarization studies, which are independent of the number of particles in the field of view (for optically thin media), provide complementary clues on the optical and physical properties of dust inside a coma (see e.g. Levasseur-Regourd, 1999). Polarization values depend not only on the dust properties, but also on the phase angle and the wavelength of observations. Using all the available data in the literature, in wavelength ranges as free as possible of gaseous emission contaminations, a classification of comets by their polarization at large phase angles and large apertures was built with two classes called high-Pmax comets and low-Pmax comets
(Levasseur-Regourd et al., 1996).
Both laboratory simulations (see e.g. Hadamcik et al., 2007a, 2011) and numerical simulations (e.g. Kimura et al., 2006; Lasue et al., 2009; Kolokolova and Kimura, 2010) provide realistic interpretations of the observations. They are confirmed by correlations with results obtained by other observational techniques such spectroscopy (with silicate infrared emission features). The high
polarization values for high-Pmax comets are usually interpreted by the presence of sub-micron sized
grains, which can be parts of fluffy aggregates (Hadamcik and Levasseur-Regourd, 2003a). Low-Pmax comets may present no jet activity at all or just a few jets in a limited region of the inner coma,
with an important decrease in polarization as the aperture increases, as for 9P/Tempel 1 before Deep Impact (Hadamcik et al, 2007b). This high polarization in the inner part can be interpreted by large dark particles, which move slowly. Some comets with an important seasonal effect, as comet 67P/Churyumov-Gerasimenko, may behave like low-Pmax comets before perihelion and present more
jets (with smaller grains) at perihelion or after it (Hadamcik et al., 2010). The presence of large particles (100 m or more) before 2015 perihelion has been confirmed by the first results from COSIMA and GIADA experiments onboard Rosetta spacecraft (e.g. Schulz et al., 2015; Rotundi et al. 2015).
In the present paper, after a description of our observations and data reduction method, the results are presented with emphasis on particular structures or events. The intensity images allow to follow the morphologies. Differences in optical properties are underlined in the linear polarization maps. Comparisons with other comets establish that the two main fragments belong to the high-Pmax class
comets and have similar optical properties than other splitting comets.
2- Observations and data reduction method
The observations have been performed with an imaging polarimetric technique with the Cassegrain 0.8 m telescope at Observatoire de Haute-Provence (OHP) in France. Four polaroid filters are mounted on a rotating wheel, with their fast axis oriented at 45° from one another. During each night, polarized and unpolarized standard stars are observed to control the non-polarization of the instrument and to determine the origin of the instrumental reference system (0 corresponding to the
position angle (PA) of the polarization of one polarized filter). The intensity, the measured polarization degree P (which has not sign), the measured position angle , the position angle of the polarization plane and finally the values of the polarization Pr (which can be positive or negative), and the position angle r in the coordinate system referring to the scattering plane are calculated by
the following expressions:
P
200
(I
0
I
90)
2
(I
45
I
135)
2I
0
I
90
I
45
I
135 (2)
0.5arctan
I
45
I
135I
0
I
90 (3)
r
0
(
90)
(4)The polarized intensities are measured in the instrumental reference system. r =( - 0) is the
position angle of the polarization plane in the equatorial reference system. The position angle of the scattering plane () is known at each date. For symmetry reason it is defined between 0° and 180°
and can be deduced from the value of the Sun-comet radius vector position angle (Sun-C PA in Table 1). The sign between the parentheses, in Equation 4, is chosen to ensure the condition 0° < (
± 90°) < 180°. r is generally of about 90° for comets observed at phase angles larger than 25°
(Levasseur-Regourd et al., 1996). A more detailed description of the instrument and method can be found in Hadamcik et al. (2007b).
The exposure time for each polarized image was short (10 s to 60 s) to avoid any tracking problem. Numerous images were recorded to build the polarized components for the different fragments and finally the intensity and polarization maps. The log of the observations is presented in Table 1. The weather and sky conditions were remarkably clear, except during some hours with faint clouds and/or wind. These periods are not used in the data. The region blurred by seeing remained smaller than 200 km radius (and often than 120 km) on the comet. To reduce the contaminations by the gaseous emissions, a Thuan-Gunn ‘r’ filter has been used (655 nm, = 90 nm; Thuan and Gunn, 1976). Results obtained with this filter were validated during previous studies of different comets e.g. comet 103P/Hartley 2 which is a low-Pmax comet; comparisons with results obtained through ESA cometary
continuum narrow band filters (684 nm, = 9 nm and 443 nm, = 4 nm) haveshown the absence of any major contamination when using the broad Thuan-Gunn filter (Hadamcik et al., 2013; 2014). Nevertheless, the continuum may be contaminated by the O1D band at 630 nm and in a lower ratio at 633.4 nm, NH2 bands (0,8,0) at 633.5 nm, (0,7,0) at 665 nm and (0,5,0) at 695 nm. In the spectrum
(unfortunately limited to 650 nm), published by Kanda et al. (2008) for observations on 2016/05/02), gas emission bands may be present, but with a relatively small contribution as compared to the continuum. This will be discussed with the polarization results and comparison with other observations.
A center gravity algorithm is used to find the position of the optocenter of the comet on each polarized image. To avoid artifacts in the polarization maps, the polarized components are centered with a precision of 0.1 pixel before any addition or calculation. The sky background estimated in a region outside the coma (in the solar direction at more than 2 arcmin) is subtracted from each image and controlled. The fluxes through apertures of 12 and 24 pixels diameters are measured for each polarized component, and the stability of intensity values is controlled for the whole series. If a difference greater than 2 % is detected, the image is rejected. For some of the observations a median sum is applied to series of six images in case of numerous star tracks to suppress them from the images. This method is efficient but the flux level is reduced and as a consequence the S/N is smaller as compared to just the sum of all the images.
3- Results
In a purpose of comparison, intensity images and polarization maps are presented for the three fragments in Fig 1. The intensity variations and coma morphologies, the linear polarization maps for SW3-C and SW3-B are presented with their evolution during the period of observations in Fig. 1a and 1b. Observations were made at different times during the night, to try to highlight short-term evolutions, which could be observed night after night. Fig. 1c presents the results obtained for fragment SW3-G on April 29, taking into account the fact that the sky was partly cloudy on April 30.
Figures 1a and 1b and 1c
3.1 Intensity images
Figures 1,a,b,c, intensity images show, from left to right, the overall shape of the coma, the isophotes (in log scale for intensity) and some structures emphasized through rotational gradient technique (Larson and Sekanina, 1984), with orientation controlled on isophotes images. For each image an azimuthal averaged radial profile in intensity is built and compared to the sunward and tailward profiles. Fig. 2a and Fig. 2b present profiles on April 27, April 28 and May 3 for fragment C, on April 27, May 2 and May 3 for fragment B. They confirm the presence of structures in the coma. Large variations in slopes are noticed on all profiles. While a value of -1 is expected on the averaged radial decreases for steady-state dust outflow, it is never obtained here at relatively large optocentric
distance. Changing slope on the profiles suggest changes in the local optical properties of the particles (e.g. size, size distribution, albedo) and/or in their number density.
3.1.1 Fragment C
It may be noticed in Fig. 1a that jets are detected sunward, at least one is always present, Its position angle changes day after day during the observations, and remains within ± 6° of the solar direction. Outside the inner coma, jets may get curved under the solar radiation pressure; and be separated by 20° to 30°, with position angles between 35° clockwise and 62° anticlockwise from the solar direction. An important tailward structure is present on all the images at a position angle of 188°± 2° anticlockwise from the solar direction, i.e. North from the projected antisolar direction. Except in the inner coma, on the three dates presented in Fig. 2a, the average profiles are steeper than for a steady state outflow (slope > -1), suggesting a change in size distribution or more absorbing dust particles. In the inner coma (less than 400 km from the optocenter and out of the region blurred by seeing (130 km in average), all the profiles present smaller slopes than -0.7 most likely because of the presence of multi-jets mainly on April 28 and May 3, with breaking of the particles and dynamical effects. These later interpretations were also suggested by Jones et al. (2008), who observed also a flattened slope in the inner coma. The three sunward profiles become steeper for optocentric distances larger than 3000 km with a very important increase of the slope on May 3 suggesting that particles leave the coma pushed back by the solar radiation pressure and can be found tailward. As expected, the slope of decrease on the tailward profiles is smaller than on the other ones and slightly increases on May 3 at optocentric distances larger than 1000 km. To tentatively interpret the polarization results for April 27 and 28, two profiles (E and W), perpendicular to the solar-antisolar direction, are respectively presented. The four profiles are relatively close to the sunward profiles, mainly on April 27 on the East direction. Dust particles are present but without important gradient around the perpendicular directions i.e. they does not originate from radial jets; they may be eventually directly released by the nucleus and/or they may come from the sunward direction when the particles are pushed back by the radiation pressure. On April 28, important dust ejection is detected in the sunward profile; further away the slope is steeper, dust is probably pushed tailward. On May 3, out of the sunward jets, the slope becomes very important (-3) at distances larger than 2000 km showing the end of the coma in that direction. On the perpendicular profiles,
except in the inner coma (below 300 km, the intensity decrease is steeper than on April 27. On April 29, the profiles (not presented here) are comparable to those found on April 27.
Figure 2a
3.1.2 Fragment B
In Fig. 1b, short sunward jets may be noticed. A conspicuous tailward jet is situated at a position angle of 220° ± 2° in projection on the sky. Smaller secondary fragments are clearly detected on the treated images, North from the antisolar direction, with position angle within 220°-240°, there is a discontinuity between the dust coming from the nucleus and the dust coming from secondary fragments. More specifically, on May 2, the intensity increases and the overall coma shape changes (Fig 1b); the sunward jets are all around the optocenter (position angles equal 29° ‘solar direction’, 45°, 90°, 150°, 273°, 305°, 342°); a spike, on the intensity image, extends in the tailward direction. One fragment is visible on the whole set of images at a position angle of 234° and at an optocentric distance of about 3000 km (noted sf on Fig. 1b isophotes and on Fig. 2b averaged profile). The difference in magnitude in a 170 km diameter circular aperture between the main fragment and the above-mentioned secondary fragment is about 3.8. A large region extending in the tail direction, with probably other fainter fragments that are more difficult to precisely localize, surrounds it.
In Fig. 2b, the profiles for April 27 and May 3 are similar; the tailward profiles present smaller slopes than the other ones. Some faint bumps are observed, which can indicate some secondary fragments. An important increase of the slope between 500 km and 1500 km is noticed sunward on April 27 and between 400 and 800 km on May 3; further away the slopes are less steep. On May 2, the slope of the average profile is small in the inner coma due to jets and small fragments. It increases between 200 and 1200 km and progressively decreases further away due to the presence of secondary fragment(s) and of their ejected dust. A spike at about 3000 km indicates its position (noted sf). The slope is very small sunward due to presence of important short jets. It is steep between 300 km and 700 km and decreases progressively for larger distances. On the tailward profile the slope decreases in the region where dust is emitted by the secondary fragment. The dust particles ejected by the secondary fragments, which are not all directly detected may be responsible of the changes in slopes.
Figure 2b
3.1.3 Fragment G
This fragment being fainter, its extension on the images, as seen in Fig. 1c, quite small (just the central coma is visible). One fan between position angles 62° and 93° and a faint jet at about a position angle of 30° are detected sunward (Fig 1c). The quite well developed tailward structure at an average position angle of 213° has a curved shape; the irregularities on this structure may originate in noise and/or in smaller secondary fragments.
The slope of the averaged profile is -0.9 between 160 and 500 km, it is -2.3 between 500 and 3000 km, indicating the end of the coma. In the inner coma where jets are observed, the slopes are smaller than -0.6. At distances larger than 500 km from the optocenter, the slope is -1.1 between 500 and 1100 km; the tailward slope is -0.9 between 500 and 3000 km with a bump at about 1800 km probably resulting of some secondary fragment.
Figure 1c
3.2 Linear polarization
3.2.1 Polarization angle
From the standard stars observation, in average 0 is found to be equal to -5° ± 2°. The instrumental
polarization is found to be smaller than 0.1 %. The position angle of the polarization plane (r) in the
equatorial reference system (related to the solar position angle and calculated by the equations 3 and 4) is in average 90° ± 10° for all the observations without any variations close to the optocenter; in consequence Pr is about equal to P
3.2.2 Aperture polarization
The polarization values, P, are calculated through increasing apertures (Table 2). In the inner coma important variations are observed mainly for fragment C. The variation of polarization for a specific aperture is studied as a function of the phase angle.
3.2.2.1 Polarization vs aperture
Except in the inner coma, the polarization slightly decreases with increasing apertures up to about 6000 km where it gets rather constant, then takes a value, usually called whole coma polarization (Table 2, Fig. 3).
Figure 3 (a and b)
In Fig. 3a variations in polarization values as a function of aperture are presented for fragment C at = 45° (April 27) with a low polarization in the inner coma (4.5 % at optocenter) and at = 46.4° (April 28) with a high polarization in the inner coma (13 % at optocenter) and finally at = 55.5° (May 3) with a higher polarization in the inner coma (18 % at optocenter). Since the optocententers are in the regions blurred by seeing, the error bars on the corresponding polarization values are large. The phase angle is about the same on the two first dates, the polarization taking about the same values through large apertures (more than 6000 km); then P is about constant as the aperture increases and as expected increases with phase angle.
To better characterize the variation in polarization P when the optocenter distance increases, Fig 3b shows P variation in consecutive concentric annuli as a function of the diameter of the annuli. The decrease in polarization is about 2% (3% for May 3), when the annuli diameter increases from 1500 km to 9000 km. Note that at optocentric distances larger than 500 km radius, out of the inner coma, on April 27 and 28, the polarization values decrease are similar. These decreases may be due to a change in properties of the particles (size, albedo) with e.g. decrease of the albedo induced by a decrease of amorphous C abundance as compared to silicates with increasing nucleus distance (Sitko et al., 2011) or eventually small gas contaminations as suggested by Bonev et al. (2008).
3.2.2.2 Polarization vs phase angle
The variation of the polarization in the inner coma is compared to the variation of P in the whole coma in Fig. 4. In this phase angle range [40°-60°], the whole coma polarization increases about linearly with the phase angle, as expected from other polarimetric observations (see section 4 and Fig. 5).
As seen for three consecutive nights, the inner coma polarization oscillates of about ± 3 % around the whole coma polarization, which changes only by less than 0.5 %. For higher phase angles, the inner coma polarization is higher by 3-6 % than the whole coma polarization and increases with a comparable rate to that of the whole coma when the phase angle increases. Within the documented phase angle range, whole coma polarization data are almost on the synthetic phase curve corresponding to high-Pmax comets (Fig. 4a).
Figure 4a
Fragment B
The inner coma polarization is higher than the whole coma polarization by in average 2.5 % and it increases with a rate similar to that of the whole coma when the phase angle increases. The whole coma polarization is slightly below the synthetic phase curve for high-Pmax comets by 0.7 % in
average (Fig. 4b). Figure 4b
Fragment G
On April 29, the inner coma polarization is higher by about 2 % than the whole coma polarization. However, taking into account the resolution, it is difficult to characterize any structure except a higher polarization for the sunward jet and in the tailward structure. The whole coma polarization (6.4 ± 2.0) % is close to the low-Pmax class of comets (7.2 %), the value for high-Pmax comets being 9.5 % at the
same phase angle. On April 30, the inner coma polarization increases slightly and the whole coma polarization seems to have about the same value but with large error bars due to faint stars close to the comet.
3.2.3 Polarization maps
The polarization maps allow characterizing structures, which are not always apparent on the intensity images. A good correlation is usually observed between high polarization structures and jets and fans (Fig. 1a and b). On SW3-C (Fig. 1a), April 27 and 29 polarization maps, two structures present a high polarization (up to 13.5 % at about 250 km from the optocenter in directions perpendicular to the Sun-tail directions) around the lower polarization central regions (down to 5 %).
From the polarization maps and the intensity slopes, it can be inferred that these high polarization regions (also not pointed out by a rotational gradient analysis) contain dust ejected on the sunward side probably along the jets curved under the radiation pressure (Fig. 1a). The dust particles from these regions are different from those present elsewhere in the coma, possibly fragmenting producing smaller aggregates and sublimating changing the albedo. On April 27, the lower polarization region is elongated in a position angle of about 45°, the optocenter being at the center of this region. The region extends on 130 km width and 280 km length. On April 29, the lower polarization region has about the same position angle; it is slightly longer and larger than on April 27. On SW3-B polarization maps, regions with higher polarization than the surrounding coma are also found around the secondary fragments, while polarization values are not so high than in the jets. Some fragments in the projected antisolar direction may be present in the tailward structure close to the nucleus and not detected in the images. An increase of activity as on May 2 for SW3-B may be the result of some fragmentation, with an increase of polarization close to the nucleus (Fig. 1b). Comparison with other polarimetric observations of SW3 fragments and other comets will be discussed in the following section.
4- Discussion
4.1 Morphology and changes within a coma
In a coma, the dust particles are pushed tailward by the solar radiation pressure. Its effect is observable for SW3-C curved jets in the sunward direction (Fig. 1a, third column). In the images, relatively day-to-day variations are observed.
On May 2, some secondary fragments are detected tailward in comet SW3-B coma, while they are progressively pushed further away from the nucleus. Fifty-four fragments were observed on May 3 with the 8 m telscope by Fuse et al., (2007); some of these fragments are likely to be within our images. This behavior was previously demonstrated by Desvoivres et al. (2000), using their dynamical model to represent the fragmentation of the nucleus of comet C/1996 B2 (Hyakutake). Secondary fragments are easy to notice in the coma of SW3-B, North from the tail where the intensity is low and the contrast is quite high. The North-East position of secondary fragments at more than 1000 km from the optocenter is probably the result of rocket effect (speed vector in
South-West direction (see e.g. Ishiguro et al., 2009). The changes in the morphology of the coma on May 2 with an antisunward spike is reminiscent of Hyakutake observations, possibly because some fragments are too small to be detected. Ishiguro et al. (2009) and Bertini et al. (2009) observed also a small outburst in SW3-B on May 2. In the image taken about 12 hours before the present observations by Bertini et al. (2009), a fragment was observed in the antisolar direction at about 340 km from the main nucleus.
4.2 Comparison between polarimetric observations of SW3 and those of other comets
As shown in Fig. 5 similar polarization results were found in the red wavelength domain at about 60° phase angles but not exactly on the same dates, by Bonev et al. (2008) with the narrow band ESA continuum filter and Kiselev et al. (2008) with a red filter, confirming the small, if any, contamination of our Thuan-Gunn broad-band filter (the differences between the three series of measurements being in the error bars). However, at larger phase angles, where phase curves are possibly less constrained, the polarization values seem to be below the high-Pmax phase curve. In near infrared
domain (H and I bands), at about 36°, the data points by Jones et al., (2008) are above the high-Pmax
phase curve in red wavelength as usually observed for comets (Hadamcik and Levasseur-Regourd, 2003b; Kelley et al., 2004) and called ‘positive polarimetric spectral gradient’, but at larger phase angles than 40° (80°-90°, Bonev et al., 2008; Jones et al., 2008; Kiselev et al., 2008), they are below the synthetic red phase curve (negative polarimetric spectral gradient). The more neutral or slightly negative spectral gradient in the near infrared domains as observed for the two SW3 fragments at large phase angles, was previously observed for different comets e.g. comet Hale-Bopp (Hadamcik et al., 2003b; Kelley et al., 2005). The infrared data in the I band obtained by Kiselev et al. (2008) are always below the red ones on the whole phase angle ranges 38°-73° for both fragments, and are very low as compared to values obtained by Jones et al. (2008) These values seem to contradict the other results (Fig. 5). The ‘I’ filter pass-band is not specified, meaning that the results are difficult to compare with other results. It can be noticed that the near infrared polarimetric values at large phase angles are similar to those obtained in red for comet comet C/1995 V1 (West), C/1996 B2 (Hyakutake) and comet C/1999 S4 (LINEAR) after its complete disruption. The very important increase in polarization, observed during disruption of the latter in the red domain (data points not taken into account in the synthetic fit) progressively disappeared. A negative (or neutral) polarimetric
spectral gradient was also observed during disruption (Hadamcik and Levasseur-Regourd, 2003c). Kiselev et al. (2008) have studied the spectral gradient on a longer period and found a very important variability before and after complete disruption. Some other comets presented the inverse spectral gradient, or permanently as for comet 21P/Giacobini-Zinner (Kiselev et al., 2000) or just on one night as for comet C/1989 X1 (Austin) (Eaton et al., 1992). The inverse spectral gradient seems to often characterize particles freshly ejected from inside the nucleus. A negative spectral gradient was observed in the inner coma of comet 1P/Halley by HOPE instrument on board the Giotto spacecraft (Levasseur-Regourd et al., 2009). A similar effect was noticed just after Deep Impact in the plume ejected from comet 9P/Tempel 1 (Harrington et al., 2007).
Figure 5
As on the polarimetric observations on April 27 and 29 of fragment C, a slightly lower polarization in a region of about 300 km diameter, around the optocenter, was observed in the H band by Jones et al. (2008) on May 12. Lower polarization in the inner coma, at phase angles larger than 30°, was observed in different comets such as comet 1P/Halley (Levasseur-Regourd et al., 1999), comet 81P/Wild 2 and comet C/1995 O1 Hale-Bopp (Hadamcik and Levasseur-Regourd, 2003a). For comet 2P/Encke an increase in polarization through increasing concentric annuli around the nucleus was noticed by Jewitt (2004). For the same comet, a decreasing P was later observed by Jockers et al. (2005) meaning that P in the inner region varies a lot, depending e.g. on the nucleus rotation or on seasonal effects. Jockers et al., (2005) nevertheless showed that a decrease in polarization when gas contamination is significant, not only through broadband filters but also through narrow band filters, whenever the central wavelength and the band-pass are not properly chosen. Besides, central region (often called polarization halo) can be partially hidden by jets or angularly small to be detected (Renard et al., 1992; Hadamcik and Levasseur-Regourd, 2003a). Different interpretations have been suggested, difference in the size distribution in the inner coma or higher number density of the particles inferring multiple scattering, presence of relatively transparent particles (silicates, low absorption organics, ices; see e.g. Hadamcik et al., 2011; Zubko et al., 2012, 2013). Jewitt (2004) interpreted the increasing polarization with increasing nucleus distance by a fading of the particles (fragmentation and sublimation of ices). Jones et al. (2008) suggested a similar interpretation for the
lower polarization region in SW3-C on May 12. Short-term day-to-day variability in the dust production rate was observed in SW3-C (Bertini et al., 2009; Sitko et al. (2011). This high variability mainly in the inner coma polarization maps is also displayed in the intensity images (Fig. 1a). At the opposite the whole coma polarization remains stable, depending only on the phase angle for the two fragments.
Jets are often observed in the inner coma. They can be made of very small sub-micrometer sized grains in eventually large high-porous aggregates with high-speed ejection, allowing them to be found far from the nucleus (Hadamcik and Levasseur-Regourd, 2003a). For some comets, a high polarization is observed in a restricted area due to the low speed of large relatively dense particles. These large particles are often found in low-Pmax comets with an important decrease when the
aperture size increases (Kiselev et al., 2015). An important decrease of P is observed for SW3-G but it is difficult to definitely conclude, the S/N ratio being low. The particles are ejected from SW3-C nucleus mainly by jets activity; they may undergo sublimation and/or fragmentation in the coma. Some particles in SW3-B are ejected within jets, while others result from successive fragmentations, inducing a large size distribution (e.g. from submicron-sized to large millimeter-sized particles). A comparison with observations with other techniques is necessary to go further in the interpretation of physical properties.
4.3. Color of the dust
Changes in the dust properties in the coma, as derived from the polarimetric observations, are also suggested by the study of the color of the dust (Bertini et al., 2009). The color depends on the size of the particles and in aggregates on their constituent grains. The surface composition of the grains may be also responsible of some change in color if the complex refractive index dependence on the wavelength is significant as for many organics and for some iron-bearing materials. Bertini et al. (2009) observed spectroscopically the three fragments through a slit oriented North-South as a function of the optocentric distance in the visible domain (between red and blue continuum). They found important variations in dust color in the comae, depending on the fragment and the date of observations. Fragment B was observed on May 2 (about 12 hours before our observations). The normalized reddening is higher in the South direction than in North direction mainly at 750 km and 6000 km from the optocenter. These differences of reddening could be related to large particles
resulting of fragmentation in the South direction and to small particles ejected along jets in the North direction. Nevertheless, for other dates (out of our period of observations), Bertini et al. (2009) found an inverse color meaning that a more detailed analysis could be done, For fragment G, on April 29, an average reddening was measured, with a higher normalized color in North than in South, but the difference is in the error bars. In conclusion, changes in color are correlated to changes in structure and polarization but color maps would be necessary at the same dates.
4.4 Correlation between high polarization and mid-infrared emission features
A correlation was found between dust-rich comets (i.e., comets with a high positive branch of their polarization phase curve) and the strength of 10 and 18-22 m silicates emission features (Chernova et al., 1993). An excellent correlation has been found between the very high polarization and high polarization regions as in the jets and arcs of comet C/1995 O1 Hale-Bopp (Hadamcik et al., 1997; Hadamcik and Levasseur-Regourd, 2003a), with well structured 10 m emission features partially due to crystalline silicates (Kolokolova et al., 2004; Harker et al., 2008). Similar results were found in the ‘plume’ ejected by Deep Impact at comet 9P/Tempel 1 (Hadamcik et al., 2007; Harker et al., 2005). Jupiter Family Comets are usually low-Pmax comets with weaker continuum thermal emission and weak or inexistent silicate emission features (Kiselev et al., 2015). The usual explanation is the presence of large dark compact particles (> 5 m). From the thermal emission in mid-infrared, physical properties of the particles are inferred. They are used to interpret the light scattering and polarization results for SW3.
Harker et al. (2011) used observations at 10 m with Gemini, and Sitko et al., (2011) used the Spitzer Space telescope at 16 m and 22 m. They both, through dust models, confirm similarities in mineralogy and grain properties between SW3-C and SW3-B. Amorphous carbon and amorphous silicates dominate the composition of the two fragments, with an excess of amorphous carbon as compared to other comets. In the anti-solar direction, Harker et al., (2011) found a carbon abundance between 45 and 23 % in weight for SW3-B and 60 to 42 % for SW3-C, with a carbon abundance of 21 % for Hale-Bopp and 28 % for the plume of 9P/Tempel 1. They found a slightly higher, model-dependent, silicate-to-carbon ratio in SW3-B than in SW3-C, increasing with the nucleus distance for both fragments. Sitko et al. (2011) noted that while the emissivity spectra of amorphous carbon and nano-phase Fe are both similar and featureless in thermal infrared, the
abundance of amorphous carbon in SW3 may be slightly smaller than previously estimated. For the polarization results, this difference has no influence. The crystalline mass fraction of silicates with a modest population of crystalline olivine (25-30 %) is about the same in SW3-B and SW3-C, for sub-micrometer and sub-micrometer sizes (Harker et al., 2011). Sitko et al. (2011) found a slight difference in the grain size distribution with a slope of -4.0 for SW3-C coma similar to that found for active comets with strong jets, and -3.5 for SW3-B, (close to that expected for dust in collisional equilibrium). The peak size distribution was 0.5 m in radius for SW3-B and 0.3 m for SW3-C, slightly larger than the peak for Hale-Bopp (0.15-0.20 m) and for the plume of 9P/Tempel 1 (0.18 m) (Williams et al., 1997; Harker et al., 2002; 2005).
The small grains in fluffy aggregates allow the emission of high continuum for the silicate IR thermal emission and important emission features when small crystalline silicates are present e.g. in Hale-Bopp or Tempel 1 after Deep impact. In these two comets the crystallinity is higher than in SW3. The high thermal continuum is consistent with the small size of grains in relatively porous (fluffy) particles and with the high abundance of amorphous carbon (Harker et al. 2011).
Sitko et al. (2011) relate ground-based observations showing for SW3-C an important variability in mid-infrared and tentatively interpret it by two kinds of dust particles, one from ‘old’ surface alterning with dust with different properties from the ‘new’ surface. This variability observed also in the intensity images and polarization maps is more important for SW3-C than for SW3-B.
The polarization is consistent with mid-infrared results for high Pmax comets, but lower than for
Hale-Bopp and for Tempel 1 after Deep Impact. SW3 is thus an exception among Jupiter Family comets with a high continuum in mid-infrared and a high polarization in large apertures. The small difference in polarization between SW3-C and SW3-B could be related to the differences in the size distribution of the grains and/or the slightly higher carbon-to-silicate ratio in SW3-C (or an eventual small gaseous contamination through the Thuan-Gunn filter for SW3-B). The small decrease in polarization, out of the inner coma, with increasing nucleus distance could result from the decrease in the carbon-to-silicate ratio. In a similar way, an alternative interpretation of the low polarization values in the innermost coma could be related to an anomalous lower carbon-to-silicate ratio on April 27 and April 29 and eventually on May 12 (Jones et al., 2008 observations) and/or to large particles, which progressively fragment.
5- Summary
Three main fragments of comet 73P/Schwassmann-Wachmann 3 were extensively observed at OHP in France, in April-May 2006. Observations of main fragments C and B during seven consecutive nights allowed us to observe the evolution of the different structures in intensity images and linear polarization maps, while the smaller fragment G was observed during two nights. Fragment SW3-C, in spite of behaving like a comet with a high maximum in polarization, showed important variations, mainly in the inner coma. Fragment SW3-B continued to fragment and variations were noticed mainly in the tailward direction.
The rotational gradient treated intensity images allowed us to underline different structures in the jets and the presence of secondary fragments. A clear deviation from -1 in the slope of the azimuthally averaged radial profile for the two main fragments (C and B) proves that the dust particles behavior is far from a free expanding outflow. Significant changes in the slopes suggest changes in the spatial distribution of the particles and in their properties.
The whole coma integrated polarization seems to indicate that the two main fragments belong to the high-Pmax class of comets. Contaminations by gas emissions seem to be very small accounting for
less than 1 % on the whole coma polarization. The polarization results are perfectly consistent with the high thermal emission in the mid-infrared. The color of the dust, in SW3-B suggests that the particles are larger than within the jets and/or are fragmenting on short time scales. The high polarization regions correspond to jets and to fragments regions. Besides, for SW3-C, dust along the jets, pushed back by solar radiation pressure presents an even higher polarization due to fragmentation, and a lower polarization is observed in the inner coma. Numerous secondary fragments and fragment regions are observed tailward in the coma of the fragment SW3-B in the treated intensity images but also in the polarization maps. Correlated results for the same observing dates by different techniques help to interpret the observations.
Comet SW3 fragments provide unique results. The variation of the light scattering properties through the coma and their evolution may give an insight on the properties of inner nuclei; differences in their optical properties suggests heterogeneities in the physical properties during the aggregation of the original nucleus and/or changes after the ejection of dust particles.
Acknowledgements
The authors thank D. Bardin for his help during the observations.
We thank OHP for time allocation, PNP (Programme National of Planetologie) and CNES for partial funding, and CNES and ESA for funding the PROGRA2 microgravity flights.
References
Bertini I., Lara L.M., Vincent J.-B., Boehnhardt H., Küppers M., Rodrigo R. (2009). Activity evolution, outbursts and splitting events of comet 73P/Schwassmann-Wachmann 3. A&A 496, 235-247.
Bonev T., Boehnhardt H., Borisov G. (2008). Broadband imaging and narrowband polarimetry of comet 73P/Schassmann-Wachmann 3, components B and C, on 3, 4, 8, and 9 May 2006, A&A 480, 277-287.
Boehnhardt H., Kaufl H.U., Keen R., Camilleri P., Carvajal J., Hale A. (1995). Comet 73P/Schwassmann-Wachmann 3. IAUC 6274
Boehnhardt H., Holdstock S., Hainaut O., Tozzi G.P., Benetti S., Licandro J. (2002). 73P/Schwassmann-Wachmann 3- One orbit after break-up: Search for fragments. Earth, Moon &
Planets 90, 131-139.
Chernova G.P., Kiselev N.N. (1993) Polarimetric characteristics of dust particles as observed in 13 comets: Comparisons with asteroids. Icarus 103, 144-158.
Crovisier J., Biver N., Bockelée-Morvan D., Colon P., Gerard E., Jorda L., Rauer H. (1995). Comet 73P/Schwassmann-Wachmann 3. IAUC 6227.
Dello Russo R.J., Vervack Jr, Weaver H.A., Biver N., Bockelée-Morvan D., Crovisier J., Lisse C.M. (2007). Compositional homogeneity in the fragmented comet 73P/Schwassmann-Wachmann 3.
Nature 448, 172-175.
Desvoivres E., Klinger J., Levasseur-Regourd A.C., Jones, G.H. (2000). Modelling the dynamics of cometary fragments: Application to comet C/1996 B2 Hyakutake. Icarus 144, 172-181.
DiSanti M.A., Anderson W.M., Villanueva G.L., Bonev B.P., Magee-Sauer K., Gibb E.L., Mumma M.J. (2007). Depleted carbon monoxide in fragment C of the Jupiter-Family comet 73P/Schwassmann-Wachmann 3. Astrophys. J. 661, L101-L104.
Eaton N., Scarrott S.M., Gledhill T.M. (1992) Polarization studies of comet Austin. Mon. Not. R.
astr. Soc. 258, 364-386.
Fuse T., Yamamoto N., Kinoshita H., Watanabe JI (2007). Observations of fragments split from Nucleus B of comet Schwassmann-Wachmann 3 with Subaru telescope. PASJ 59, 381-386.
Hadamcik E., Levasseur-Regourd A.C., Renard J.B. (1997). CCD imaging polarimetry of comet Hale-Bopp, Earth Moon Planets 78, 365-371.
Hadamcik E. and Levasseur-Regourd A.C. (2003a). Dust evolution of comet C/1995 O1 (Hale-Bopp) by imaging polarimetric observations. A&A 403, 757-768.
Hadamcik E., Levasseur-Regourd A.C. (2003b). Imaging polarimetry of cometary dust: different comets and phase angles. J. Quant. Spectrosc. Radiat. Transfer 79-80, 661-678.
Hadamcik E. and Levasseur-Regourd A.C. (2003c). Dust coma of comet C/1999 S4 (LINEAR): imaging polarimetry during nucleus disruption, Icarus 166, 188-194.
Hadamcik E., Renard J.-B., Rietmeijer E.J.M., Levasseur-Regourd A.C., Hill H.G.M., Karner J.M., Nuth J.A. (2007a). Light scattering by fluffy Mg-Fe-SiO and C mixtures as cometary analogs (PROGRA2 experiment). Icarus 190, 660-671.
Hadamcik E., Levasseur-Regourd A.C., Leroi V., Bardin D. (2007b). Imaging polarimetry of the dust of comet Tempel 1 before and after Deep Impact at Haute-Provence observatory. Icarus 190, 459-468.
Hadamcik E., Sen A.K., Levasseur-Regourd A.C., Gupta R., Lasue J. (2010). Polarimetric observations of comet 67P/Churyumov-Gerasimenko during 2008-2009 apparition. A&A 517, A86.
Hadamcik E., Renard J.-B., Levasseur-Regourd A.C., Lasue J. (2011). Laboratory measurements of light scattered by clouds and layers of solid particles using imaging technique, In: Polarimetric detection, characterization, and remote sensing (Mishchenko M., Yatskiv M.I., Rosenbush V.K., Videen G., Eds), NATO Science, Springer.
Hadamcik E., Sen A.K., Levasseur-Regourd A.C., Gupta R., Lasue J., Botet R. (2013). Dust in comet Hartley 2 coma, during EPOXI mission. Icarus 222, 774-785.
Hadamcik E., Sen A.K., Levasseur-Regourd A.C., Roy Choudhury S., Lasue J., Gupta R., Botet R. (2014). Dust coma of comet C/2009 P1 (Garradd) by imaging polarimetry. Met.&Planet. Sci. 49, 36-44.
Harker D.E., Wooden D.H., Woodward C.E;, Lisse C.M. (2002) Grain properties of comet C/1995 O1 (Hale-Bopp). Astrophys. J. 580, 579-597.
Harker D.E., Woodward C.E., Wooden D.H (2005). The dust grains from 9P/Tempel 1 before and after encounter with Deep Impact. Science 310, 278-280.
Harker D.E., Woodward C.E., Kelley M.S., Sitko ML., Wooden D.H., Lynch D.K., Russell R.W. (2011). Mid-infrared spectrophotometric observations of fragments B and C of comet 73P/Schwassmann-Wachmann 3 (2011). Astrophys. J. 141, 26-37.
Harrington D.M., Meech K., Kolokolova L., Kuhn J.R., Whitman K. (2007). Spectropolarimetry of the Deep Impact target Comets 9P/Tempel 1 with HiVIS. Icarus 191, 381-388.
Ishiguro M., Usui F., Sarugaku Y., Ueno M. (2009). 2006 fragmentation of comet 73P/Schasswann-Wachmann 3B observed with Subaru/Suprime-Cam. Icarus 203, 560-570.
Jewitt D. (2004). Looking through the HIPPO: Nucleus and dust in comet 2P/Encke. Astron. J. 128, 3061-3069.
Jockers K., Kiselev N., Bonev T., Rosenbush V., Shakhovskoy D., Antonyuk K. (2005). CCD imaging and aperture polarimetry of comet 2P/Encke: Are there two polarimetric classes of comets?
A&A 441, 773-782.
Jones T.J., Stark D., Woodward C.E., Kelley M.S., Kolokolova L., Clemens D., Pinnick A. (2008). Evidence of fragmenting dust particles from near-simultaneous optical and near-infrared photometry and polarimetry of comet 73P/Schwassmann-Wachmann 3. Astron. J. 135, 1318-1327.
Kanda Yu-I., Mori A., Kobayashi H., Kawakita H. (2008) Optical spectroscopic observations of comet 73P/Schwassmann-Wachmann 3. PASJ 60, 1191-1198.
Kelley M.S., Jones T.J., Reach W.T., Johnson J. (2004). Near-infrared polarimetry and photometry of recent comets. Astron. J. 127, 2398-2405.
Kimura H., Kolokolova L., Mann I. (2006). Light scattering by cometary dust numerically simulated with aggregate particles consisting of identical spheres. A&A 449, 1243-1254.
Kiselev N.N., Jockers K., Rosenbush V.K., Velichko F.P., Bonev T., Karpov N. (2000) Anomalous wavelength dependence of polarization of comet 21P/Giacobibi-Zinner. Planet. Space Sci. 48, 1005-1009.
Kiselev N., Rosenbush V., Kolokolova L., Antonyuk K. (2008) The anomalous spectral dependence of polarization in comets. J. Quant. Spectrosc. Radiat. Transfer 109, 1384-1391.
Kiselev N., Rosenbush V., Levasseur-Regourd A.C., Kolokolova L. (2015). Polarimetry of comets,
In: Polarimetry of stars and planetary systems, Cambridge University Press, 379-397.
Kolokolova L., Hanner M., Levasseur-Regourd A.C., Gustafson B.A.S. (2004). Physical properties of cometary dust from light scattering and thermal emission. In: Comets II (Festou, M.C., Keller H.U., Weaver H.A., Eds), Univ. of Arizona Press, 577-604.
Kolokolova L., Kimura H. (2010). Comet dust as a mixture of aggregates and solid particles: model consistent with ground-based and space-mission results. Earth, Planet and Space 62, 17-22.
Larson S.M., Sekanina Z. (1984) Coma morphology and dust-emission pattern of periodic comet Halley. I. High resolution images taken at Mount Wilson in 1910. Astrophys. J. 89, 571-606.
Lasue, J., Levasseur-Regourd, A.C., Hadamcik, E., Alcouffe, G. (2009). Cometary dust properties retrieved from polarization observations, Application to C/1995 O1 Hale-Bopp and 1P/Halley, Icarus 199, 129-144.
Levasseur-Regourd A.C., Hadamcik E., Renard J.-B. (1996). Evidence of two classes of comets from their polarimetric properties at large phase angles. A&A 313, 327-333.
Levasseur-Regourd A.C. (1999). Polarization of light scattered by cometary dust particles: observations and tentative interpretations. Space Sci. Rev. 90, 163-168.
Levasseur-Regourd A.C., McBride N., Hadamcik E., Fulle M. (1999). Similarities between in situ measurements of local dust scattering and dust flux impact data within the coma of 1P/Halley. A&A 348, 636-641.
Renard J.-B., Levasseur-Regourd A.C., Dollfus A. (1992). Polarimetric imaging of comet Levy (1990c). Ann. Geophys. 10, 288-292.
Rotundi A., Sierks H., Dello Corte V., Fulle M., Gutierrez P.J., and 76 coauthors (2015). Dust measurements in the coma of comet 67P/Chruryumov-Gerasimenko inbound to the Sun. Science 347, issue 6320, 6 pp.
Schulz R., Hiltenbach M., Langevin Y., Kissel J., Silen J., and 20 coauthors (2015). Comet 67P/Churyumov-Gerasimenko sheds dust coat accumulated over the past four years. Nature L. 518, 216-218.
Sitko M.L., Lisse C.M., Kelley M.S., Polomski E.F., Lynch D.K., Russell R.W;, Kimes R.L., Whitney B.A., Wolff M.J., Harker D.E. (2011) Infrared spectroscopy of comet 73P/Schwassmann-Wachmann 3 using the Spitzer space telescope. Astron. J. 142, 80-102.
Thuan T.X. and Gunn J.E. (1976) A new four-color intermediate-band photometric system. PASP 88, 543-547.
Toth I., Lamy P., Weaver H.A., Noll K.S., Mutchler M.J. (2006). Hubble Space telescope observations of fragment C of the split comet 73P/Schwassmann-Wachmann 3 in 2001 and 2006.
Williams D.M., Mason C.G., Gehrz R.D., Jones T.J., Woodward C.E, Harker D.E., Hanner M.S., Wooden D.., Witteborn F.C., Butner H.M. (1997) Measurements of submicron grains in the coma of comet Hale-Bopp C/1995 O1 during 1997 February 15-20 UT. Astrophys. J. 489, L91-L94.
Zubko E., Muinonen K., Shkuratov Y., Hadamcik E., Levasseur-Regourd A.C., Videen G. (2012). Evaluating the carbon depletion found by the Stardust mission in Comet 81P/Wild 2. A&A 544, L8-L11.
Zubko E., Muinonen K., Shkuratov Y., Videen G. (2013). Characteristics of cometary dust in the innermost coma derived from polarimetry by Giotto. Mon. Not. R. Astr. Soc 430, 118-1124.
Figure captions
Figures 1
1a. Fragment C; 1b. Fragment B; 1c. Fragment G.
From April 27 to May 3, 2006, for fragments C and B, and on April 29, 2006, for fragment G.
Dates, intensity images, isophotes in log scale for the intensity, rotational gradient treated images and polarization maps. All fields of view equal to 9000 km x 9000 km. North is up and East on the left side, solar direction is shown on the isophotes by a segment. For each display, the level is chosen to emphasize the different structures (thus, levels of intensity and polarization not comparable from one night to another, red color is for high values, blue for small ones, in each image and polarization map). On SW3-B isophotes: sf = secondary fragment also visible on all images.
Figures 2
2a. Fragment C: April 27 and 28, May 3; 2b. Fragment B: April 27, May 2 and 3.
Radial profiles: azimuthally integrated intensity, sunward, tailward, and for fragment C, perpendicular to the solar direction West and East for the 2 first dates. SW3-B: sf = spike corresponding to the secondary fragment observed on the images. The HWHM of the point-spread function averaged on the whole observing time, for each date and fragment, as measured using stars in each field is indicated by a vertical line.
Figure 3
3a. Fragment C variations of polarization vs aperture diameter. The error bars (smaller than 0.5 % except at the optocenter in the region blurred by seeing) are smaller than the symbols.
3b. Fragment C variations of polarization vs annulus diameter. Note that the decreases with optocenter distance are remarkably similar except in the inner regions where important variations are noticed.
Figures 4
4a. Fragment C; 4b. Fragment B
Comparison between whole coma and inner coma polarizations vs phase angle. The error bars are smaller than the symbols. The synthetic curve is for high-Pmax comets in the red wavelength domain.
Figure 5
Fragments C, B, G polarimetric phase curves. Comparison with other comets and classification. Red domain and near-infrared.
The synthetic phase curves are fits of all available observations for whole coma in the red wavelength domain excluding comet C/1999 S4 LINEAR during its disruption (Hadamcik and Levasseur-Regourd, 2003). Observations by Bonev et al. (2008) are noted Cb and Bb; observations by Jones et al. (2008) are noted Cj, Bj; observations by Kiselev et al., (2008) are noted Ck and Bk. Fragmented comets C/1975 West, C/1996 B2 Hyakutake and C/1999 S4 LINEAR data are also shown for comparison.
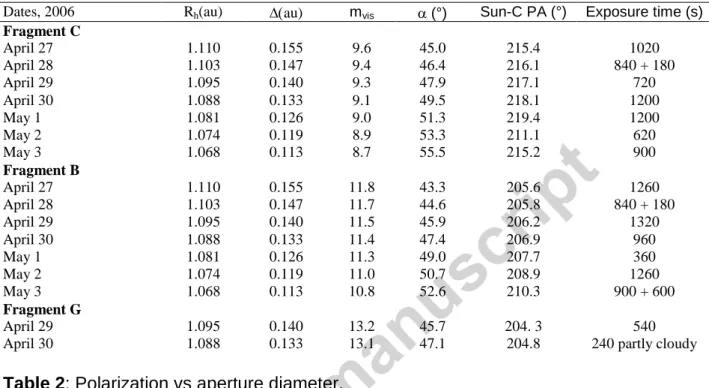
Table 1. Log of the observations
Dates correspond to the beginning of each night e.g. April 27 = 27-28 night. Rh = heliocentric distance,
= geocentric distance, mvis = visual magnitude, (°) = phase angle, Sun-C PA = extended Sun-comet
radius vector position angle (JPL Horizons ephemeris); Exposure time= total exposure time for each polarized component.
Dates, 2006 Rh(au) au) mvis (°) Sun-C PA (°) Exposure time (s)
Fragment C April 27 1.110 0.155 9.6 45.0 215.4 1020 April 28 1.103 0.147 9.4 46.4 216.1 840 + 180 April 29 1.095 0.140 9.3 47.9 217.1 720 April 30 1.088 0.133 9.1 49.5 218.1 1200 May 1 1.081 0.126 9.0 51.3 219.4 1200 May 2 1.074 0.119 8.9 53.3 211.1 620 May 3 1.068 0.113 8.7 55.5 215.2 900 Fragment B April 27 1.110 0.155 11.8 43.3 205.6 1260 April 28 1.103 0.147 11.7 44.6 205.8 840 + 180 April 29 1.095 0.140 11.5 45.9 206.2 1320 April 30 1.088 0.133 11.4 47.4 206.9 960 May 1 1.081 0.126 11.3 49.0 207.7 360 May 2 1.074 0.119 11.0 50.7 208.9 1260 May 3 1.068 0.113 10.8 52.6 210.3 900 + 600 Fragment G April 29 1.095 0.140 13.2 45.7 204. 3 540
April 30 1.088 0.133 13.1 47.1 204.8 240 partly cloudy
Table 2: Polarization vs aperture diameter.
phase angle,
scattering plane PA,
obs
= measured polarization angle. Error
bars correspond to a confidence level of 95 % (2
At optocenter, but in the region
blurred by seeing. NA = not available, G too faint and diffuse.
DATES (°) (°) obs (°) Center (%) 500 km (%) 1000 km (%) 2000 km (%) 4000 km (%) 6000 km (%) SW3-C April 27 45.0 35.4 43 ±2 4.8±1.3 7.1 ±0.1 9.6 ±0.1 10.2 ±0.1 10.1 ±0.1 9.9 ±0.2 April 28 46.4 36.1 45 ±3 13±1.0 12.4 ±0.1 11.6 ±0.1 11.1 ±0.2 10.9 ±0.2 9.8 ±0.2 April 29 47.9 37.1 47 ±3 8.5±1.2 7.5 ±0.2 9.1 ±0.1 10.0 ±0.1 10.6 ±0.2 10.1 ±0.2 April 30 49.5 38.1 49 ±5 16.1±0.5 15.7 ±0.3 13.1 ±0.3 11.5 ±0.3 10.7 ±0.3 10.2 ±0.4 May 1 May 2 51.3 53.3 39.4 41.1 50 ±4 51 ±4 21.0±2.0 19.6±1.0 17.2 ±0.1 18.1 ±0.2 14.5 ±0.1 16.1 ±0.2 13.5 ±0.1 14.8 ±0.2 12.8 ±0.2 14.0 ±0.2 12.3 ±0.2 13.5 ±0.2
May 3 55.5 45.2 53 ±3 18.0±1.3 17.9 ±0.1 17.0 ±0.1 16.2 ±0.1 15.1 ±0.1 14.1 ±0.1 SW3-B April 27 43.3 25.6 32 ±3 10.6± 1.0 10.5 ±0.1 9.1 ±0.1 9.6 ±0.1 9.4 ±0.2 8.7 ±0.2 April 28 44.6 25.8 32 ±4 9.9±1.0 9.8 ±0.1 10.4 ±0.1 10.0 ±0.1 9.5 ±0.2 9.3 ±0.2 April 29 45.9 26.2 33 ±3 12.01.3 11.8 ±0.2 11.3 ±0.2 10.2 ±0.2 9.8 ±0.2 9.4 ±03 April 30 47.4 26.9 33 ±6 12.9±1.3 12.5 ±0.3 13.1 ±0.2 10.2 ±0.2 9.7 ±0.3 9.4 ±0.4 May 1 May 2 May 3 49.0 50.7 52.6 27.7 28.9 30.3 36 ±5 43 ±4 36 ±3 12.4±1.3 15.0±1.2 14.4±2.0 12.4 ±0.2 15.0 ±0.2 15.1 ±0.1 11.8 ±0.2 13.3 ±0.2 15.0 ±0.2 11.1 ±0.2 12.7 ±0.2 14.8 ±0.2 10.4 ±0.3 11.9 ±0.3 13.5 ±0.2 10.4 ±0.3 11.2 ±0.3 12.1 ±0.2 SW3-G April 29 45.7 24.3 30±5 NA 9.7 ± 0.5 9.8 ±0.5 8.1 ±0.5 7.6 ±0.6 6.4 ± 2;0 April 30 47.1 24.8 33±8 NA 11.1± 0.5 11.2 ± 1 7 ± 2 Stars -
Figure 1a
Figure 2a
Figure 2b