MITLibraries
Document Services Room 14-0551 77 Massachusetts Avenue Cambridge, MA 02139 Ph: 617.253.5668 Fax: 617.253.1690 Email: docs@mit.edu http://libraries. mit.edu/docsDISCLAIMER OF QUALITY
Due to the condition of the original material, there are unavoidable
flaws in this reproduction. We have made every effort possible to
provide you with the best copy available. If you are dissatisfied with
this product and find it unusable, please contact Document Services as
soon as possible.
Thank you.
Some pages in the original document contain color
A Device for Testing the Electronic and Mechanical Properties of Conducting
Polymers with Electron Paramagnetic Resonance Spectroscopy
by
Nicholas R. Powley S.B. Mechanical Engineering
Massachusetts Institute of Technology, 2004
SUBMITTED TO THE DEPARTMENT OF MECHANICAL ENGINEERING IN PARTIAL FULFILLMENT OF THE REQUIREMENTS FOR THE DEGREE OF
BACHELOR OF SCIENCE IN MECHANICAL ENGINEERING AT THE
MASSACHUSETTS INSTITUTE OF TECHNOLOGY
MAY 2004
-©2004 Nicholas R. Powley. All rights reserved. The author hereby grants to MIT the permission to reproduce
and to distribute publicly paper and electronic copies of this thesis document in whole or in part.
Signature~~ ofAto:, __________
b'epartment of Mechanical Engineering May 5, 2004
Certified
by:
6 //'
Ian W. Hunter Professor of Mechanical Engineering Thesis Supervisor
Accpte1
-
b
-Accepted
by:
-r
-
iI
Ernest Cravalho Professor of Mechanical Engineering Chairman, Undergraduate Thesis Committee
, I
.1
ACKNOWLEDGMENTS
I would like to thank Patrick Anquetil, Prof. Ian Hunter, Prof. Timothy Swager, Mark Wall, and David Bray for their many contributions and continued support.
A Device for Testing the Electronic and Mechanical Properties of Conducting Polymers with Electron Paramagnetic Resonance Spectroscopy
by
Nicholas R. Powley
Submitted to the Department of Mechanical Engineering on May 5, 2004 in Partial Fulfillment of the Requirements for the Degree of Bachelor of Science in
Mechanical Engineering
ABSTRACT
Conducting polymers have the potential to serve the technical and commercial communities with novel actuators, sensors, and biomimetic devices. The conjugated structures of these polymers and the addition of dopants enable conduction. [1] One current goal in the conducting polymer field is to observe and understand the events by which these polymers carryout their active mechanical functions (contraction and expansion) upon the application of a potential. This thesis presents the design and a prototype of a new device for investigating the relationship between the mechanical and electronic properties of conducting polymers with EPR Spectroscopy.
The performance of the testing device was explored with a controlled experiment. The results of this experiment suggest that the response of conducting polymer actuators to mechanical inputs can be examined with EPR Spectroscopy.
Thesis Supervisor: Ian W. Hunter
TABLE OF CONTENTS Content Page TITLE PAGE 1 ACKNOWLEDGMENTS 2 ABSTRACT 3 TABLE OF CONTENTS 4-5 TABLE OF FIGURES 6 1. INTRODUCTION 7 2. BACKGROUND 8-10
2.1 Mechanical Properties of Actuators 8
2.2 Conducting Polymer Actuation Processes 8
2.3 Electron Paramagnetic Resonance Spectroscopy 9
3. DESIGN OF APPARATUS 11-19
3.1 Introduction of Film Tensioning Device Components and Software 11
3.2 Functional Requirements for Apparatus 12
3.3 Design and Manufacture of Apparatus 12
3.4 Manufacture of Components 16
3.5 Functional Requirements for Software 18
3.6 Design of the Data Acquisition Software 19
4. SET-UP OF APPARATUS AND EXPERIMENTAL METHOD 20-21
4.1 Set-Up of Apparatus 20
4.2 Experimental Method 20
5. CALIBRATION AND CHARACTERIZATION 22-24
5.1 Load Cell Calibration 22
5.2 EPR Signal Characterization of Rexolite 23
5.3 EPR Signal Characterization of Mechanical Testing Device 23 5.4 EPR Signal Characterization of the Mechanical Testing Device and 23 Unstressed PPY
6. EXPERIMENTS AND DISCUSSION 25-26
6.1 Characteristic experiment (in-situ stretching of PPY in the EPR 25 cavity)
Appendix A.1: The drawings of the apparatus whence the load cell
micrometer connector was made.
Appendix A.2: The drawings of the apparatus whence the bottom clamp
load cell connector was made.
Appendix A.3: The drawings of the apparatus whence the top clamp stop
was made.
Appendix A.4: The drawings of the apparatus whence the clamps were
made.
Appendix A.5: The drawings of the apparatus whence the collets were
made.,
APPENDIX B.
Appendix B.I: Calibration setup for the load cell. APPENDIX C.
Appendix C.1: Experiments conducted, outcomes, and selected observations. REFERENCES 28 29 30 30 31 32 32 33-34 33 35
TABLE OF FIGURES
Figure Page
Figure 2.2.1: The process of r - r stacking and resulting bulk actuation. [3] 8
Figure 2.3.1: Orthogonal view of solid model of a Bruker EPR instrument. 9
Figure 2.3.2: A section view of a solid model of a Bruker EPR instrument. 10
Figure 3.1.1: A close up view taken from a solid model of the film-tensioning 11
device.
Figure 3.1.2: A screen image of the data acquisition software's home screen. 12
Figure 3.3.1: Prototyped assembly of clamps, collets, connecters, load cell. 13
Figure 3.3.2: Prototyped clamp, collet, and collet peg assembly. 14
Figure 3.3.3: The Rexolite clamping mechanism is depicted with a conducting 15
polymer film attached.
Figure 3.4.1: The solid model of the load cell micrometer connector. The 16
drawings of the apparatus whence this part was made can be seen in Appendix A.1.
Figure 3.4.2: The solid model of the bottom clamp load cell connector. The 17
drawings of the apparatus whence this part was made can be seen in Appendix A.2.
Figure 3.4.3: The solid model of the top clamp stop. The drawings of the 17
apparatus whence this part was made can be seen in Appendix A.3.
Figure 3.4.4: The solid model, typical of the top and bottom clamps. The 18
drawings of the apparatus whence this part was made can be seen in Appendix A.4.
Figure 3.4.5: The solid model, typical of the top and bottom collets. The 18
drawings of the apparatus whence this part was made can be seen in Appendix A.5
Figure 4.1.1: A close up view taken from a solid model of the film-tensioning 20
device.
Figure 4.2.1: Status bars of a calibrated EPR device. 21
Figure 5.2.1: The EPR signal for rexolite alone. 22
Figure 5.3.1: The EPR signal intensity recorded while the rexolite clamps were 23
moved with the mechanical tester between 0.0 mm and 0.834 mm.
Figure 5.4.1: The EPR signal intensity as a function of time and sample 24
position.
Figure 6.1.1: The EPR Signal, applied force, and position plotted versus time. 25
1. INTRODUCTION
Conducting polymers have the potential to serve the technical and commercial communities with novel actuators, sensors, and biomimetic devices. The conjugated structures of these polymers and the addition of dopants enable conduction. [1] Hexafluorophosphate is one such dopant that appears in the conducting polymer actuator Polypyrrole. One present goal in the conducting polymer field is to observe and understand the way these polymers carryout their active mechanical functions (contraction and expansion) upon the application of a potential. This thesis explores a new method for determining the relationship between the mechanical and electrical properties of conducting polymer actuators.
Currently, Polypyrrole (PPY) is one of the most successful conducting polymer actuators. PPY can exhibit 2% strain and actuation forces of up to 40 MPa via ion intercalation. That stress, generated by the material, is quite large but the strain rate is low in comparison to mammalian muscle that exhibits 20% strain. Expectations for the next generation of polymer actuators far exceed the specifications that are now possible. New polymers that implement molecular mechanisms, designed by Prof. Timothy Swager (Department of Chemistry, MIT), are predicted to exhibit strains equal to that of mammalian muscle.
Ultimately, knowledge of the relationship between electric activation and mechanical strain is desired. Electron Paramagnetic Resonance Spectroscopy (EPR) of polymers has provided evidence for actuation via r-7r stacking, but significant information remains unknown. Specifically, it has been difficult to identify a link between the mechanical activation and the electronic response of conducting polymer actuators. As a result, this thesis presents the design and prototype of a new device and a method for investigating the relationship between the mechanical and electric properties of conducting polymers.
2. BACKGROUND 2.1 Mechanical Properties of Actuators:
Polypyrrole based conducting polymer actuators can generate stresses (40 MPa) two orders of magnitude greater than that of human muscle while exhibiting an equal power to mass ratio (150 W/kg). In addition these actuators require low drive voltages, offer limited active strain (2%), and a limited active strain rate (2%/s) [1].
2.2 Conducting Polymer Actuation Processes:
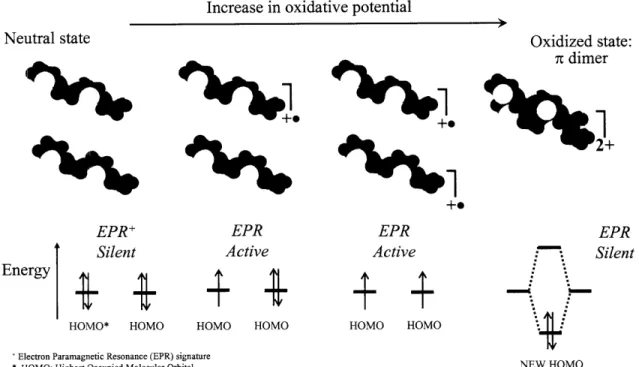
The methods of actuation vary between different conducting polymers. It is assumed that polypyrrole actuates via the intercalation of ions in and out of the polymer backbone [2]. For poly(quarterthiophene) the actuation mechanism is thought to be ion intercalation as well as r - stacking between monomers [3].
Ionic intercalation is the result of ion diffusion created by bulk electrochemical oxidation. The significant outflow of ions from the polymer film typically results in the volumetric change of the polymer film [2]. The i - n stacking method is identified by the formation
of - c bonds between polymer monomers for the maintenance of electro-neutrality [3]. Figure 2.1 demonstrates the hypothesized process of - c stacking and the resulting macro-scale shape change.
Increase in oxidative potential
Neutral
state
Oxidized
Oxidized state:state:~~~
rc dimer2+
~~j .~
~ EPR+ Silent HOMO* HOMO EPR Active HOMO HOMO* Electron Paramagnetic Resonance (EPR) signature
* HOMO: Highest Occupied Molecular Orbital
Figure 2.2.1: The process of i - ir stacking
EPR
· I'* Silent
...-.
NEW HOMO
and resulting bulk actuation (taken from [4]). Energy EPR Active
+
HOMO HOMO Neutral state 0 +0 I2.3 Electron Paramagnetic Resonance Spectroscopy:
An Electron Paramagnetic Resonance Spectrometer (EPR), also known as an Electron Spin Resonance Spectrometer (ESR), is an instrument that can detect the electronic states of materials. Unpaired electrons result in an EPR active signal while paired electrons result in an EPR silent signal. [5] Thus it is conceivable that ion intercalation and 7
-stacking might be observed using EPR Spectroscopy. In this thesis, a Bruker EMX EPR spectrometer [6] was used to examine the actuation mechanisms for conducting polymers.
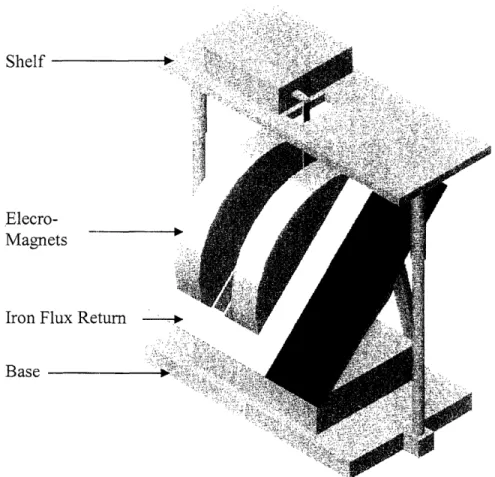
In the Bruker EMX EPR spectrometer, as in other typical EPR instruments, a klystron tube generates microwave radiation at 9.75 GHz. The microwave radiation travels down a waveguide to the sample, which is held in place in the EPR Cavity, and that, in turn is suspended between the poles of the EPR magnets. The EPR spectra are obtained by measuring the absorption of the microwave radiation while sweeping the magnetic-field strength. EPR spectra are usually displayed in their derivative form to improve the signal-to-noise ratio [7]. Figure 2.3.1 presents an orthogonal view of a solid model of a Bruker EMX EPR instrument. Labeled components include the magnets, flux return, and EPR base.
C1-i. ir
Dllull
Elecro-Magnets
Iron Flux Return
Base
Figure 2.3.1: Orthogonal view of solid model of a Bruker EPR instrument, created with
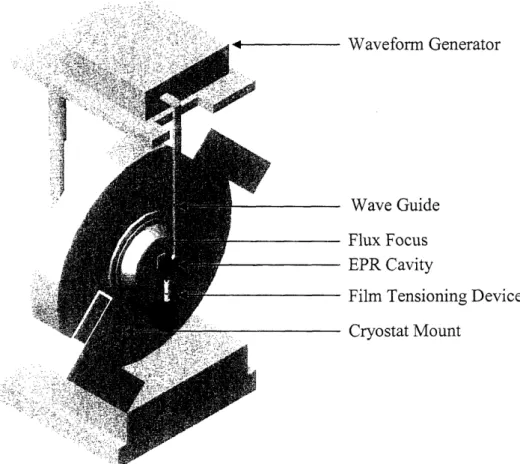
Figure 2.3.2 shows a section view of the solid model of a Bruker EPR instrument. Labeled components include the waveform generator, wave guide, flux focus, EPR cavity, tensioning device, and the cryostat mount.
~_____ vv avl/IVlllu .Jl'lIl
Wave Guide Flux Focus EPR Cavity
Film Tensioning Device
- . ILCL. I±yJ4 V.L,.LL.L
Figure 2.3.2: A section view of a solid model of a Bruker EPR instrument.
-:I:
-l_ I _ r .
ZAl a5:T+A { _tn >tA
- ZA/ 'i /rnTrarrrl { Trusty Hr^> a rar
. . . 1. . - . __ . - . . I . . . .
-- I _i
3. DESIGN OF APPARATUS
3.1 Introduction of Film Tensioning Device Components and Software:
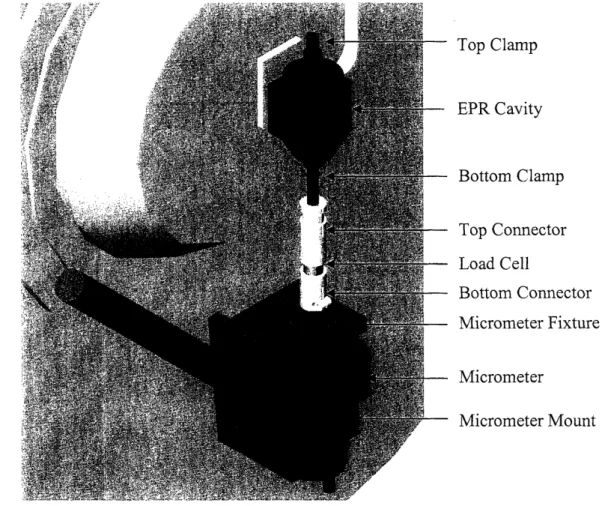
The film tensioning device was designed to apply and measure stresses and strains to and from polymer films within a Bruker EPR cavity. A physical device for film tensioning was designed in addition to the necessary data acquisition software. The film tensioning device is presented in Figure 3.1.1. Labeled components include the top clamp, EPR cavity, bottom clamp, top connector, load cell, bottom connector, micrometer fixture, micrometer, and micrometer mount.
- Top Clamp - EPR Cavity - Bottom Clamp - Top Connector - Load Cell - Bottom Connector - Micrometer Fixture - Micrometer - Micrometer Mount
Figure 3.1.1: A close up view taken from a solid model of the film-tensioning device.
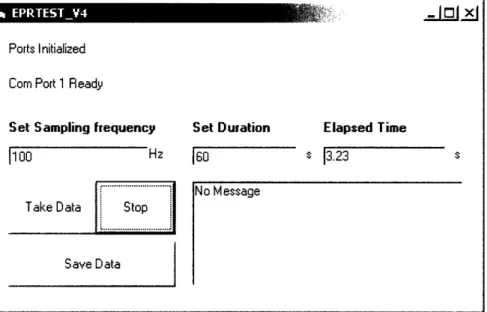
Data acquisition software was developed using Microsoft Visual Basic 6.0 [9]. This software was used to acquire position data and load cell data from the Mitutoyo micrometer and GS Sensors XFTC101-M5M-5 load cell, respectively. A screen image of the data acquisition software's home screen is presented in Figure 3.1.2. Entry fields include the field for setting the sampling frequency, the field for setting the duration, and the field for setting elapsed time. Buttons include the take data button, the stop button,
Ta e ao...
Take Data . Stop
I...
Save Data Ports Initialized Corn Port 1 Ready
Set Sampling frequency Set Duration Elapsed Time
100 Hz 160 s 1323 s
No Message
Figure 3.1.2: A screen image of the data acquisition software's home screen. 3.2 Functional Requirements for Apparatus:
The film tensioning device was designed to satisfy several functional requirements. The device was designed to be EPR silent, preserving an acceptable signal to noise ratio. The device was designed to fit within the EPR cavity and between the EPR magnets. The device was designed to withstand the magnetized environment within the EPR Instrument. Finally the clamps, collets, and collet pegs were designed to positively clasp the polymer film.
3.3 Design and Manufacture of Apparatus:
All parts of the device to be inserted into the EPR cavity were made from EPR silent materials. The clamps, collets and pegs were made from Rexolite [10], a cross-linked polymer containing very few unpaired electrons. The glass tube that shields the clamps within the EPR cavity (not visible in Figure 3.1.1) was composed of Wilmad 5PQ lab glass. The clamps and collet components and glass shielding were designed to fit within a 10 mm diameter cylindrical tube (the maximum radius accepted by the EPR cavity and fixture collets).
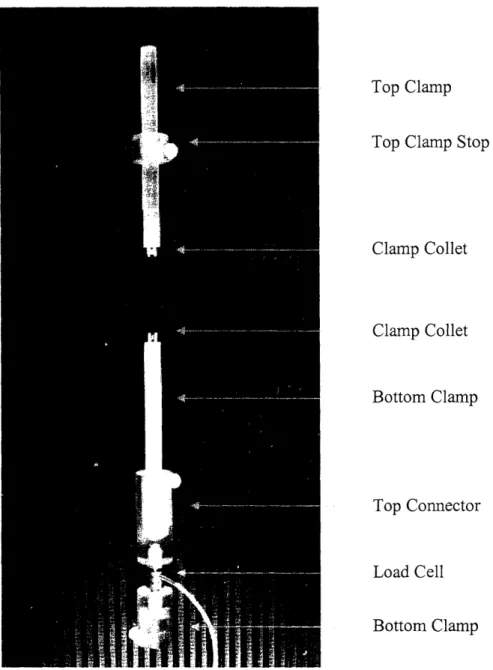
A close up of the prototyped clamping and connecting assembly is presented in Figure 3.3.1. Labeled components include the top clamp, top clamp stop, collets, bottom clamp, top connector, load cell, and the bottom connector.
Top Clamp
Top Clamp Stop
Clamp Collet Clamp Collet Bottom Clamp Top Connector Load Cell Bottom Clamp
Figure 3.3.1: Prototyped assembly of clamps, collets, connecters, load cell.
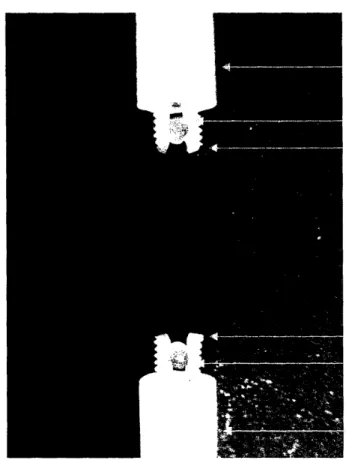
A close up view of the prototyped clamps and collets is presented in Figure 3.3.2. Labeled components include the top clamp, top collet and collet peg, bottom collet and
Top Clamp
Top Collet Peg Top Collet
Bottom Collet Bottom Collet Peg
Bottom Clamp
Figure 3.3.2: Prototyped clamp, collet, and collet peg assembly.
A Mitutoyo micrometer head with a width smaller then that of the spacing between the EPR magnets was used to actuate the application of strain unto the polymer film. The Mitutoyo micrometer was fixed in the micrometer fixture and attached to the micrometer mount with an adjustable six-axis-mounting-technique. The adjustability permitted the
alignment of the micrometer axis with that of the clamps and EPR cavity.
Rexolite is diamagnetic and therefore observes no magnetic attraction to or repulsion from the strong magnetic fields within the EPR instrument. The Mitutoyo micrometer contained paramagnetic materials and was fixed tightly to the cryostat mount to prevent movement towards or away from the EPR magnets.
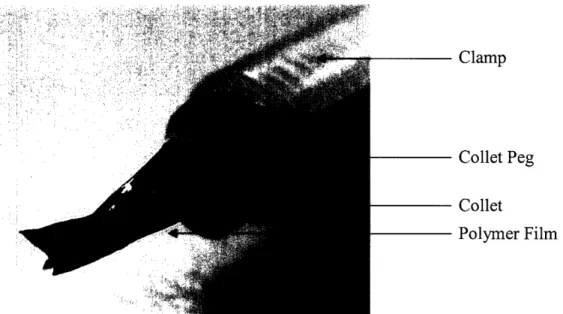
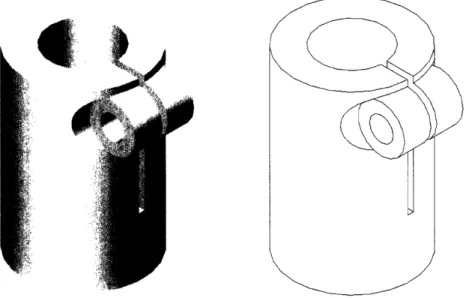
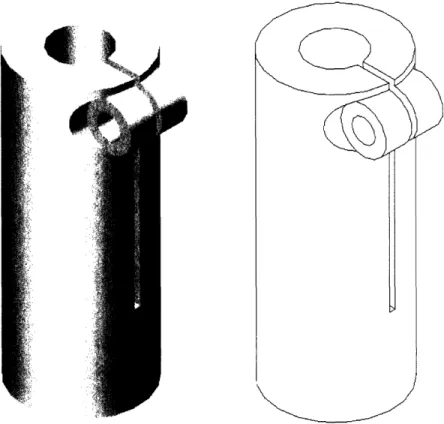
Finally the film clamping mechanism was designed to tightly clamp the polymer film for accurate stress and strain application. The collet provides a mechanical advantage for tightening and the collet pegs add the capstan effect for additional clamping strength. Figure 3.3.3 displays a polymer film clamped on one end using the designed device.
Clamp
Collet Peg Collet
Polymer Film
Figure 3.3.3: The Rexolite clamping mechanism is depicted with a conducting polymer
film attached.
3.4 Manufacture of Components:
The components presented in Figures 3.4.1 through 3.4.3 were made using a 3D Systems Viper Stereolithography Station. [11] The parts were designed using SolidWorks 2003 and built with the highest possible feature resolution (50 tm).
L
Figure 3.4.1: The solid model of the load cell micrometer connector. The height of this
part is 30 mm. The drawings of the apparatus whence this part was made can be seen in Appendix A.
Figure 3.4.2: The solid model of the bottom clamp load cell connector. The height of this
part is 50 mm. The drawings of the apparatus whence this part was made can be seen in Appendix A.
Figure 3.4.3: The solid model of the top clamp stop. The height of this part is 10 mm.
The drawings of the apparatus whence this part was made can be seen in Appendix A. The clamps were manufactured from 9 mm cylindrical rexolite. Two 80 mm long pieces were cut from a 9 mm diameter rexolite cylinder. A 6 mm diameter coaxial hole was drilled 15 mm into one end of each of the two rexolite pieces. The holes were then tapped with an M6 thread. The solid model of the clamps is presented in Figure 3.4.4.
(~~~~~~
Figure 3.4.4: The solid model, typical of the top and bottom clamps. The length of this
part is 80 mm. The outer diameter of the part is 9 mm. The hole in the clap presented above was tapped using an M6 tap. The drawings of the apparatus whence this part was made can be seen in Appendix A.
The collets were manufactured from 5 mm cylindrical rexolite. First, 18 mm of the 5 mm bar was threaded with an M5 die. Then, two 2 mm holes were drilled through the cylindrical axis. One hole was placed 2.5 mm from the free end, and the other was placed 10 mm from the free end. Finally, a 1 mm wide, 10 mm long, through slot was machined from the free end of the rexolite cylinder and was coplanar with the plane formed by the two axes of the holes. The drawings of the apparatus are presented in Figure 3.4.5.
Figure 3.4.5: The solid model, typical of the top and bottom collets. The outer surface of
this part was threaded using a M5 die. The drawings of the apparatus whence this part was made can be seen in appendix A.
The collet pegs were cut to 5 mm lengths from 2.5 mm diameter cylindrical rexolite.
3.5 Functional Requirements for Software:
time for the current experiment was also required. Finally prompts for initiating data acquisition, terminating data acquisition, and saving the data acquired were necessary.
3.6 Design of the Data Acquisition Software:
The data acquisition software was built with the necessary buttons, fields, and displays to accommodate the functional requirements. Fields included those for setting the sampling frequency, the duration of the experiment, and the display of the elapsed time. Take data, stop, and save data buttons were placed on the graphical user interface to satisfy the data acquisition prompt requirements.
4. SET-UP OF APPARATUS AND EXPERIMENTAL METHOD 4.1 Set-Up of Apparatus: - Top Clamp - EPR Cavity - Bottom Clamp - Top Connector - Load Cell - Bottom Connector - Micrometer Fixture - Micrometer - Micrometer Mount
Figure 4.1.1: A close up view taken from a solid model of the film-tensioning device.
The load cell was screwed into the load cell micrometer connector and the load cell bottom clamp connector. This assembly was then connected to the micrometer with the load cell micrometer connector.
The EPR-silent-glass-tube was slipped into the top collet of the EPR cavity and the collet was gently tightened. The clamp and film assembly was then lowered, bottom-clamp-down, into the glass tube that was used shield the EPR cavity. Sliding terminated when the top clamp stop came into contact with the shielding glass.
4.2 Experimental Method:
The conducting polymer film was trimmed to the prescribed length. One end of the polymer film was wrapped once around the collet peg. The dowel peg was pinched by
polymer film. The top clamp stop was then slid to the prescribed position on the top clamp and screwed securely into place.
Calibration and tuning of the EPR device was performed, such that the EPR status bars read "OPERATE," "LEVELED," "CALIBRATED." The status bars for a properly calibrated and tuned EPR device are presented in Figure 4.2.1.
-~~~~~~~~~
* File Parameter Acquisition Processing View Options Window Info
Ifl l ! l
l ,
1 71
Frequency: 9.350164 GHz AFC Receiver Level
Attenuation: 20 dB EIIKIZI I
Power: 2.007 mW Diode Hall Field
Q -Value: 4900 I III E"
Figure 4.2.1: Status bars of a calibrated EPR device. Ideally the AFC and Diode
indicator bars would be in the middle of the green fields; instead they are shown in the yellow fields.
The EPR device was then initiated to take data. The user then walked from the EPR device console to the mechanical device. After a set amount of time, which was 10 seconds, the user then selected the "Take Data" button on the data acquisition software. The micrometer was then actuated and the experiment conducted. Upon completion of the experiment the user terminated actuation and selected the "Stop Data" key. The data were then saved by selecting the "Save Data" key, thereby marking the experiment complete.
5. CALIBRATION AND CHARACTERIZATION
The instrumentation was calibrated and characterized for the purpose of insuring repeatable and validated results.
5.1 Load Cell Calibration:
A GS Sensors model XFTC101-M5M-5 load cell was calibrated using the setup presented in Appendix B.1. The discovery of a 0.410616 NV-1calibration factor for the
GS Sensor Load cell was the result of the described procedure
5.2 EPR Signal Characterization of Rexolite:
The intrinsic EPR signal for rexolite was characterized by placing a rexolite bar into the cavity and measuring the resulting signal. The EPR signal that resulted is presented in Figure 5.2.1.
* File Parameter Acqusition Proessing View Options Window Info
alol- ,lal'l 21x1<1><1 ::+l [ *>l lo. IM-I, I 41L~1 ::1 ll
Freqmc.,y: 9.350184 Hz AFC Rec. eier Level.
Att.ua..on: 20 dB :- I I
Pwer: 2 007 mW Diode Hall Feld
- QVaue 4900 .i- _
Magnetic Field (G)
Figure 5.2.1: The EPR signal for rexolite alone. (Note that 104Gauss (G) = 1 Tesla (T))
The EPR signal presented in Figure 5.2.1 demonstrates that rexolite is EPR silent. Typical EPR intensities range from a few hundred to tens of thousands of intensity units.
I I- -~
5.3 EPR Signal Characterization of Mechanical Testing Device:
The influence of the mechanical tester on the EPR signal was discovered by observing the EPR signal while moving the film tensioning device within the cavity. Figure 5.3.1 shows nearly 3 minutes of EPR signal, during which time the bottom clamp of the mechanical tester was moved between 0.0 mm and 0.834 mm and returned to 0.0 mm.
-IL on_____I _ -IZU 1 -(I)2: C . W -130 -135 -140 -145 -150 -155 0 20 40 60 80 100 120 140 160 18C Time (s)
Figure 5.3.1: The EPR signal intensity recorded while the
with the mechanical tester between 0.0 mm and 0.834 mm.
rexolite clamps were moved
The EPR signal presented in Figure 5.3.1 demonstrates that the rexolite clamps are EPR silent, and the movement of the micrometer had no effect on the EPR signal. This proves that any signal observed while the clamps are in use must be the result of additional materials and/or phenomenon existing within the EPR cavity.
5.4 EPR Signal Characterization of the Mechanical Testing Device and Unstressed PPY:
The influence of PPY on the EPR signal was determined by moving an unstressed sample of PPY within the EPR cavity using the mechanical testing device. The EPR signal as a function of time and sample position is presented in Figure 5.4.1.
- I e. ~.. I , , , I I 0 1 4 --- --- I - --- - ---- - ----I I
J
i. I
11".-1-3930 3925 3920 C 3915 X 3910 .-W 3905 CL 3900 3895 3890 0.8 0.6 0.4 0.2 0 0 5 10 15 20 25 30 35 40 45 Time (s)
Figure 5.4.1: The EPR signal intensity as a function of time and sample position.
The mechanical testing device was used to move the PPY sample within the EPR cavity from 0.000 mm to +0.20 mm, back to 0.00 mm and then to -0.20 mm. The EPR signal intensity followed the movement as it first decreased by 18 intensity units, then increased by 9 intensity units, and finally increased by another 9 intensity units. The signal returned to the initial signal strength but only after a position shift of -0.20 mm. The cause of hysteresis in this experiment is unknown. Most importantly this experiment indicates that a signal change of between 45 and 90 EPR intensity units per each 1 mm of PPY sample movement is suggested by this experiment. This further quantifies the measurement tolerance.
6. EXPERIMENTS AND DISCUSSION
Seventeen experiments were conducted with the assistance of Patrick Anquetil (MIT, BioInstrumentation Lab), including the two characterization experiments presented in Figures 5.3.1 and 5.4.1. The seventeen experiments and the parameters varied in each are presented in Appendix C. Additional comments on the outcome of each experiment are also presented in Appendix C.
6.1 Characteristic experiment (in-situ stretching of PPY in the EPR cavity):
A PPY sample measuring 1.76 mm (+/- 0.1 mm) wide by 68 Jtm (+/- ltm) thick was fully clamped within the cavity. The EPR signal was then recorded while the PPY sample was strained by increasing its overall length by 0.893 mm. The EPR Signal, applied force, and position versus time are presented in Figure 6.1.1.
10 15 20 25 30 35 40 Time (s) - 3 - 2.5 -2 15 1 '-- .5 _0 .E ° m. 0 . -0.5 45 50 55 60
Figure 6.1.1: The EPR Signal, applied force, and position plotted versus time.
The EPR signal plotted versus force is presented in Figure 6.1.2.
25000 20000 (n C t C '= C 03 03 LLI 15000 10000 EPR Intensity - Force ___- Position (mm) 4 F~~~~~~~~~~~~~ 0 S .0 S 0-0~~~~ 90~ 9 ~ ~ ~~ 5000 0 0 5 - -__ _7 -_ ---,--- -1--- - - - ---- ---- -,-- -. '_-''_____ INNEW - - -
W __
-
: u --- I---I---I---I --- 11 -./-...- T... ...T...---- -... ... ….i... --- I--- --- --- --- i~~~~~~~~~~~~~~~~~~~~~~~~~~~~~~~~~~~~~~~~~~~~~~~~ 20 25 y = 95.666x + 20771 R2= 0.9602
Figure 6.1.2: EPR signal intensity plotted versus applied stress. A linear trendline was fit
using the least-squares method, where x is mechanical stress and y is EPR signal intensity. Variance accounted for (R2) by the linear model is also shown.
A linear relationship between EPR signal and stress is suggested by Figure 6.1.2. Specifically, a stretched PPY sample exhibited an increase in EPR signal intensity. This shows that the test performed and the mechanical device used to conduct that test is capable of conducting further tests for the purpose of determining the relationship between the mechanical and chemical properties of conducting polymers.
23500 23000 -22500 000 -500 22 .0C | 21 o Itl 21UUU -20500 20000 0 5 10 15 Stress (MPa) - -I I I --- --- --- --- -- I --- ---W --- ---- --- ---- --- a---i I __ --- -i I i --- i --- I--- ---i I --- --- ---Ii I
7. CONCLUSION
The testing method and the mechanical testing device presented in this thesis are novel in character. A new apparatus was developed for the investigation of the conducting polymer field and a new application for existing EPR technology was explored.
Specifically this thesis succeeded in several ways. The first accomplishment was the validation of the mechanical testing device and procedure for the later determination of the relationship between the mechanical and chemical properties of conducting polymers. While that relationship was not explicitly determined, the experiments conducted did suggest the capabilities of this testing procedure. For example, the observed signal to noise ratio was approximately 100 to 1 in one experiment, instilling confidence that successful testing is quite possible. Another success was the identification of conducting polymer testing applications for EPR Spectroscopy.
With this experimental apparatus, the immediate goal was to determine the relationship between electric activation and mechanical strain. In the past EPR spectroscopy has shown the reduction and oxidation of conducting polymers, which is evidence of -stacking. However, with past methods it was difficult to observe mechanical activation simultaneously. With the method presented in this thesis the response of conducting polymer actuators to mechanical inputs can be examined with EPR Spectroscopy.
Further experimentation might investigate the relationship between other sets of conducting polymer properties. In addition, other conducting polymer materials could be investigated.
APPENDIX A.
Appendix A.1: The drawings of the apparatus whence the load cell micrometer
connector was made. The provided dimensions are in millimeters.
f
I
-I
_ _ O Z~~Appendix A.2: The drawings of the apparatus whence the bottom clamp load cell
connector was made. The provided dimensions are in millimeters.
Appendix A.3: The drawings of the apparatus whence the top clamp stop was made. The
provided dimensions are in millimeters.
20o
I
I-I 05
--t~~~
1
12
Appendix A.4: The drawings of the apparatus whence the clamps were made. The
provided dimensions are in millimeters. The outer diameter of the part is 9 mm. The hole shown in the right side of the part was tapped with a M6 tap.
I
ZZZII,
i
(P, 04.1c) l .I-V
I -2-6. X! .40Appendix A.5: The drawings of the apparatus whence the collets were made. The
provided dimensions are in millimeters. The outer surface of the part was threaded with a M5 tap.
<7)5
/11
APPENDIX B.
Appendix B.1: Calibration setup for the load cell. Labeled components include the load
cell, cable, pulley, and variable mass.
Cable Pulley
I
Variab Load Cell FixtureThe load cell was connected to the fixture table. A supple, lightweight cable was then attached to the load cell and strung over a low friction pulley. The free end of the cable was then attached to a bucket in which masses were later placed (above, this component is labeled "Variable Mass"). The exhibition of a 0.410616 N.V- calibration factor for the
APPENDIX C.
Appendix C.1: Experiments conducted, outcomes, and selected observations.
# Title Setup and Parameters Outcome/Observations
1 Glass Control EPR signal was detected for No EPR signal was detected. frequency spectrum. BNC cable was not connected
to EPR cavity.
2 Rexolite Control Rexolite was fixed in cavity. No EPR signal was detected. EPR signal was detected for
frequency spectrum.
3 Strong EPR Signal A 1-diphenyl-2-picryl- An EPR signal was detected. hydrazyl(DPPH) sample was A total spin count of 9106
placed in cavity and the EPR was observed. signal detected.
4 PPY Hanging in PPY was hung in the cavity An EPR signal was detected. Cavity and the EPR signal detected. A total spin count of 29x106
was detected.
5 Clamped PPY EPR signals was detected for The signal peak was observed frequency spectrum at 0.3421 T.
6 Force Test on EPR signal was detected The EPR frequency was Clamped PPY while the PPY sample was observed to increase with the
strained. application of force and strain.
7 PPY Hanging in PPY was hung loosely inside The EPR calibration failed Cavity and Moved the cavity and moved. yielding no discernable signal. 8 PPY Hanging in PPY was hung loosely inside The EPR calibration remained Cavity and moved the cavity and moved. within acceptable limits. The
10 mm 0.3445 T peak remained
constant throughout the test. The EPR intensity was weak in comparison to Experiment 6.
9 PPY Hanging in PPY was hung loosely inside The EPR signal intensity cavity and moved the cavity and moved +/- 2 indicated movement and
+/- 2 mm mm. showed signs of hysteresis.
10 PPY Hanging PPY was hung loosely inside An EPR signal change of -18 loosely and moved the cavity and moved +1 was observed.
+1 mm mm.
11 PPY Hanging in PPY was hung loosely inside An EPR signal change of -18 cavity and moved the cavity and moved +1 mm was observed towards +1 mm and back to 0 mm. and a signal change of +9 was
observed after movement towards 0 mm.
12 PPY Hanging in PPY was hung loosely inside A rate of signal drift of cavity and not the cavity not moved. EPR 0.875/s was observed over a _ moved. signal drift was measured. period of 80 seconds.
Note: 104 Gauss (G) = 1 Tesla (T)
13 Force Test on PPY was strained by 0 mm The EPR signal followed no Clamped PPY to 0.4 mm twice with discernable pattern, but increments of 0.1 mm and returned to the signal intensity 0.05 mm respectively. at which it started.
14 Force Test on PPY was strained until The PPY film broke at 0.834
Clamped PPY breaking. mm. The peak frequency was
observed at 0.3443 T
15 EPR Signal Decay The sample from experiment The EPR signal intensity 14 was left in the cavity for 5 decayed linearly and by an additional minutes. The overall magnitude of 400. EPR signal was recorded.
16 PPY Hanging in The sample from experiment The EPR signal changed by cavity and moved. 14 was moved to +0.834 mm approximately 2/mm.
References:
[1] Madden J..D., Madden P.G. and Hunter I.W., "Polypyrrole Actuators: Modeling and
Performance", Electroactive Polymer Actuator and Devices Conference, SPIE 8th Annual
International Symposium on Smart Structures and Materials, Newport Beach, CA, 2001.
[2] Baughman R.H., Shacklette S.W., Plichta E.J. and Becht C., "Electromechanical Actuators Based on Conducting Polymers", Molecular Electronics, pp. 267-289, 1991. [3] Anquetil P.A. , Hsiao-hua Yub, Madden J.D.a, Madden P.Ga, Swager T.Mb and
Hunter I.W.a; aBiolnstrumentation Laboratory, Department of Mechanical Engineering;
bDepartment of Chemistry; Thiophene-based conducting polymer molecular actuators,
Massachusetts Institute of Technology, 77 Massachusetts Ave., Cambridge, MA, 02139, USA
[4] Courtesy of Patrick A. Anquetil, MIT.
[5] Electron Paramagnetic Resonance, Elementary Theory and Practical Applications,
Weil J.A., Bolton J.R., Wertz J.E. John Wiley and Sons, INC. New York, 1994. [6] http://www.bruker.com/ [7] http://web.mit.edu/speclab/www/eprtrain.html. [8] http://www.solidworks.com/ [9] http://www.microsoft.com [10] http://www.rexolite.com. [11] http://www.3dsystems.com/ [12] http://www.gssensors.com/