The Economics of Investing in Green Buildings
byCharbel Maroun Rizk
Submitted to the System Design and Management Program in Partial Fulfillment of the Requirements for the Degree of
Master of Science in Engineering and Management
at
theARCHIVES
Massachusetts Institute of Technology MASSACHUSETTS INSTITUTE OF TECHNOLOGY
February 2010
JUN 16 2010
C 2010 Charbel Maroun Rizk
LIBRARIES
All rights reserved
The author hereby grants to MIT permission to reproduce and to
distribute publicly paper and electronic copies of this thesis document in whole or in part.
Signature of Author
Charbel Maroun Rizk System Design and Management Program February 2009
Certified by
Dr. Ricardo Valerdi Research Associate Center for Technology, Policy & Industrial Development Lean Advancement Initiative Thesis Supervisor
Accepted by
Accpte by t 001Patrick . Hale
Director - System Design and Management Fellows Program
The Economics of Investing in Green Buildings
byCharbel Maroun Rizk
Submitted to the System Design and Management Program on February of 2009 in Partial Fulfillment of the Requirements for the Degree of
Master of Science in Engineering and Management
Abstract
This thesis discusses economics of green buildings. The need to reduce greenhouse gases emissions became clear. Buildings account for a large part of the greenhouse gases emissions, changing the atmosphere's composition. Climate changes will be unevenly distributed between regions; in early stages they might be beneficial for few but will eventually end up being costly for all.
Several worldwide rating systems were established with a common objective to determine metrics for measuring a building's performance and minimizing
environmental footprint. In this research we selected LEED-NC version 2.2 by U.S. Green Building Council (USGBC) for our analysis. V-2.2 consists of a set of credits distributed in categories. We identified credit's requirements and analyzed their impact on cost and environment. We supported our analysis by looking into cost and benefit studies performed by different organizations, and summarized our findings in providing heuristics on green buildings.
Finally, a major take away from this research project is that there are numerous factors affecting difficulty of achieving, cost, and benefits of LEED credits. In addition to that, the correlation between credits and the large number of combinations to qualify for LEED certification levels, make it unreasonable to generalize about the incremental cost for any certification level.
Thesis Supervisor: Dr. Ricardo Valerdi
Title: Research Associate. Center for Technology, Policy & Industrial Development, Lean Advancement Initiative
Acknowledgements
The assistance provided by Dr. Ricardo Valerdi made this thesis possible. Dr. Valerdi guided me through the thesis development and constantly provided valuable advice. I would also like to thank Dr. Olivier de Weck for giving me the opportunity to look at Masdar documents, and learn more about current green technologies.
Additionally, I would like to thank Dr. Anas Alfaris with whom I had several informative and beneficial discussions over the past several months.
SDM was a great learning experience for me. Classes' structure and materials made me enjoy the time spent in school. SDM fellows also contributed to my learning with the different background and experience they were bringing to the classroom. I would like to take this opportunity to thank all SDM administrators, who are putting a lot of efforts to ensure proper learning environment, particularly Pat Hale, the program director.
My friends played a key role in making this thesis possible. I would like to thank Janet Chwalibog and Chadi Kawkabani for editing and providing me feedback on the work done. Additionally, I would like to mention Jorge Amador, Antonio Del Puerto, Nisheeth Gupta, Karthikeyan Malli Mohan, Najy Nicolas, Sooraj Prasannan, and Amar Sharma, who have been good friends and helped cheering me up along the way.
Finally, I would like to thank my family for their enormous support. I would like to thank my sisters Nathalie and Nadine and their husbands Roger Aboukhalil and Chadi
Kawkabani for their continuous encouragement and for standing by me during my two years in the SDM program. I would also like to thank my mother May for all the help and guidance she provided and continues to provide. Lastly, I have been supported by the love and inspiration of my father Maroun; although he is not with us any longer he has guided me through this challenging process. I cannot thank him enough for making this happen, and I submit this work in his memory.
Table of Contents
Abstract
...---...---Acknowledgements ... III
List of Figures ...----..--.-...--... Vi List of Tables ...---.----..---... VII List of Pictures ... ... ...-... - ... vI
Acronyms ... VIII Chapter 1 ...-
.-1 - Introduction... - .. ...-- - -
-1.0 - Climate Change & Greenhouse Gases ... 2
1.1 - Construction Industry ... .... . ... ... 3 1.2 - Complexity of Construction ... 5 1.3 - Overview of Thesis ... .... ... 7 Chapter 2...-... . - -...--- ... 9 2 - Literature Review... ... - - --... 2.0 - Introduction...-...---.... ---.... --... 10
2.1 - Generic Sustainability Discussion ... 10
2.2 - Contemporary Sustainable Examples ... 14
2.3 - US Green Building History ... ... 16
2.4 - Barriers to Entry of Green Buildings ... 18
2.5 - Benefits of Green Buildings ... .... 19
2.6 - Co nclusio n ... ... ---... 22
Chapter 3.... ... ...-... ....-....- -3 - Green Buildings Standards...--- -3.0 - Introduction ... 24 3.1 - Incentives...--- ... - -- ...- -... ---... 24 3.1.1 Oil Prices...- ... .. - --- --- ---...24 3.1.2 W ater Availability...---...---..---..---.---...25 3.1.3 New Technologies...-... --- .. . ---... 26 3.1.4 Awareness... . ...--- -- --- -- -- --- -- -.. ---... 26
3.1.5 City and State Program s... .. ---...27
3.1.6 Attraction to Investors...--...---.--...- -.. ---... 27
3.1.7 Effort by Big Institutions... ... --... -- ...---.... . ---...27
3.2 - Summary of Existing Standards and Stan dar Selection ... 28
3.3 - W hy LEED ...--- ...-- . . ---... 34 3.4 - C osting ...- --.. . ---. .. ----... 35 3.5 - Co nclusio n ...-...---...- -... ---... 37 Chapter 4...-... 38 4 - LEED Standard...-.-...-- - -4.0 - Introduction ...- ... ---... . . ... 39 4.1 - Cost Discussion ... . ---... . ---... 40 4.2 - Certification Costs... .-. ... ...-41
4.3 - LEED Credit's Discussion ... ... .... ... 43
4 .3.2 W ater Efficiency...56
4.3.3 Energy and Atm osphere...61
4.3.4 M aterial and Resources...69
4.3.5 Indoor Environm ental Q uality...75
4.3.6 Innovation and Design Process...85
4.4 - Documentation Cost... 86
4.5 - Conclusion ... 87
Chapter 5... 88
5 - Green Buildings Analysis... 5.0 - Introduction...89
5.1 - Davis Langdon...90
5 .1.1 Introd uctio n ... 90
5.1.2 Point by Point A nalysis... 90
5.1.3 Cost A nalysis of Sim ilar Buildings... ... 102
5.1.4 Conclusion ... 104
5.2 - General Services Administration ... 107
5.2.1 Introd uction...107
5.2.2 credit cost Im pact...111
5.2.3 Scorecard of Recent Projects...113
5.2.4 Evaluation Process...115 5 .2.5 C o nclusio n ... 116 5.3 - Conclusion ... 117 Chapter 6... 118 6 -Case Studies ... 6.0 - Introduction ... 119
6.1 - Sloan Building - Project Description...120
6.2 - Macallen Building - Project Description...120
6.3 -Artist For Humanity Building - Project Description...121
6.4 - LEED Scorecards for all 3 Projects ... 122
6.5 - Lessons Learned & Conclusions...128
Chapter 7...129 7 - Heuristics/Conclusions ... 7.0 - Introduction ... 130 7.1 - Heuristics on LEED ... 130 7.2 - Conclusion ... 142 References... 144
List of Figures
Figure 1.1: Word Carbon Dioxide Emissions (US EPA,2009)... 3
Figure 1.2: World Greenhouse Gases Emissions by Sector (Source: Grid-Arendal)... 4
Figure 1.3: Building System Decom position ... 6
Figure 1.4: Sum m ary of W ork ... 8
Figure 2.1: Summary of Cost-Benefits of Green Buildings (Kats-MA,2003) ... 21
Figure 3.1: Crude Oil Price (Yahoo, 2009)... 25
Figure 3.2: Standard Selection (PNNL,2006)... 29
Figure 3.3: Ranking of Standards Weights per Category... 31
Figure 3.4: Summary of FPE phases. Source (WBDG)... 37
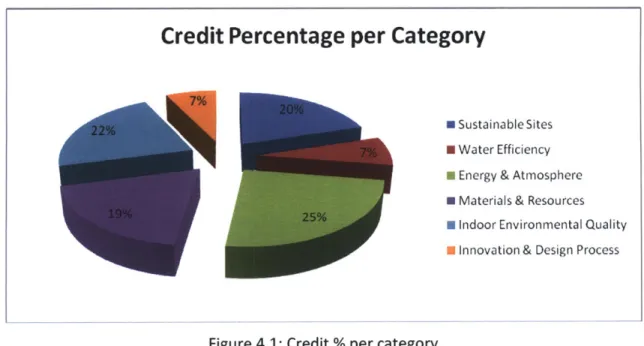
Figure 4.1: Credit % per Category... 39
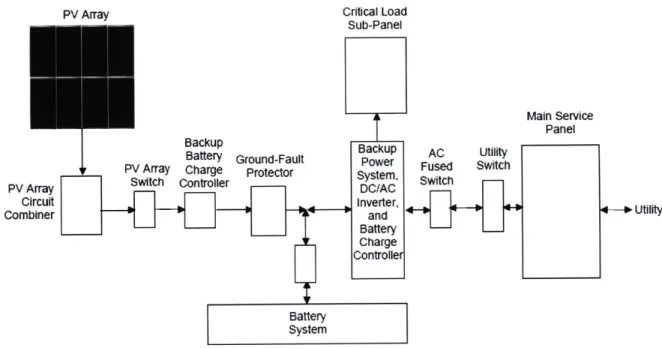
Figure 4.2: Typical PV System Components: A guide to PV system design and installation, California Energy Commission Consultant Report... 65
Figure 5.1: Sum m ary of Davis Research ... 89
Figure 5.2: Sum m ary of GSA Research ... 89
Figure 5.3: Ranges of %s for different certification levels. Note: ]xy], means x value excluded from range, y value included in range... 95
Figure 5.4: For all credits. % of projects meeting credit... 100
Figure 5.5: After excluding 'Easy' & 'Difficult'. % of projects meeting credit... 101
Figure 5.6: Sum m ary of GSA Study ... 111
Figure 5.7: Ranges of % of certification levels. Note: ]xy], means x value excluded from range, y value included in range ... 114
Figure 6.1: Sum m ary of % M et for all 3 Projects ... 128
List of Tables
Table 2.1: Green Products (Prepared by Author based on BuildingGreen,2009)... 13
Table 3.1: List of Standards. Source: W ikipedia... 28
Table 3.2 Technical Standard Com parison... 31
Table 3.3: Standards' Scorcards... 33
Table 4.1: Rates for LEED certification-New Construction ... 42
Table 4.2.1: 'Sustainable Sites' Credits... 44
Table 4.2.2: 'W ater Efficiency' Credits... 56
Table 4.2.3: 'Energy & Atmosphere' Credits... 61
Table 4.2.4: 'M aterials & Resources' Credits... 70
Table 4.2.5: 'Indoor Environmental Quality' Credits ... 76
Table 4.2.6: 'Innovation & Design Process' Credits ... 85
Table 5.1.1: SS- Summary of Langdon's Results. Source Davis Langdon... 92
Table 5.1.2: WE- Summary of Langdon's Results. Source Davis Langdon ... 92
Table 5.1.3: EA- Summary of Langdon's Results. Source Davis Langdon ... 93
Table 5.1.4: MR- Summary of Langdon's Results. Source Davis Langdon... 93
Table 5.1.5: IEQ- Summary of Langdon's Results. Source Davis Langdon... 94
Table 5.1.6: IDP- Summary of Langdon's Results. Source Davis Langdon... 94
Table 5.2: Summary # of credits met by projects. Source Davis Langdon... 94
Table 5.3.1: SS- Summary of GSA Results. Source GSA ... 108
Table 5.3.2: WE- Summary of GSA Results. Source GSA... 109
Table 5.3.3: EA- Summary of GSA Results. Source GSA... 109
Table 5.3.4: MR- Summary of GSA Results. Source GSA ... 110
Table 5.3.5: IEQ- Summary of GSA Results. Source GSA ... 110
Table 5.3.6: IDP- Summary of GSA Results. Source GSA... 111
Table 5.4: Num ber of Credits per category ... 112
Table 6.1.1: SS- Comparison Sloan, Macallen, & AFH... 123
Table 6.1.2: WE- Comparison Sloan, Macallen, & AFH ... 124
Table 6.1.3: EA- Comparison Sloan, Macallen, & AFH ... 125
Table 6.1.4: MR- Comparison Sloan, Macallen, & AFH... 126
Table 6.1.5: IEQ- Comparison Sloan, Macallen, & AFH... 126
Table 6.1.6: IDP- Comparison Sloan, Macallen, & AFH ... 127
Table 7.1: Low Cost Credits... 132
Table 7.2: H igh Cost Credits... 134
Table 7.3: Costs & Benefits of commisisioning LEED-NC buildings. Source Peter C. D 'A nto nio 5/2007 ... 139
Table 7.4: Com m on Easy Credits Davis & GSA... 140
Table 7.5: Common Difficult Credits Davis & GSA ... 141
List of Pictures
Picture 2.1: Passive House Example. W ikipedia ... 14
Picture 2.2: Masdar City Top View (Commetechservices.ca)... 15
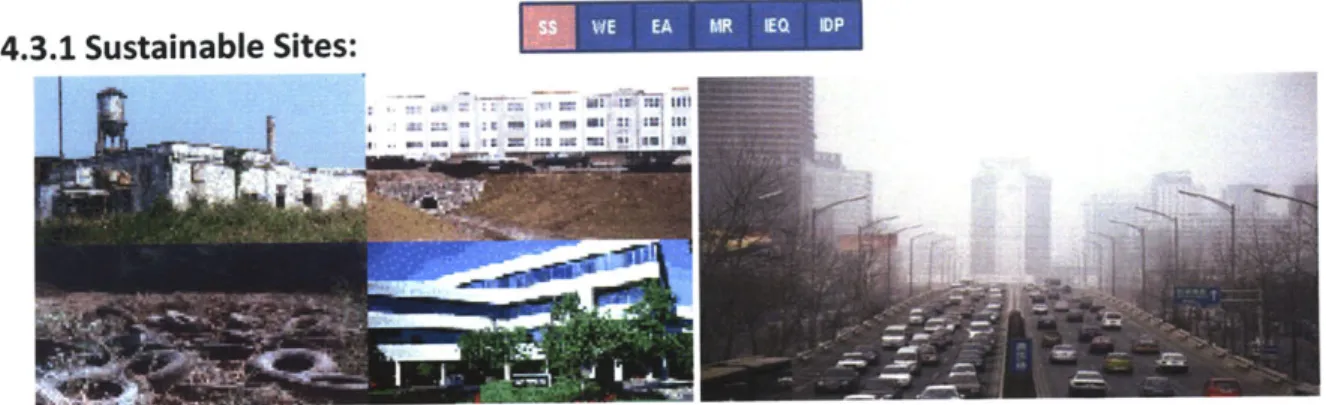
Picture 4.1: Brownfield Example. Source Wikipedia. And Transportation Pollution. Source chinadialog.ne... 44
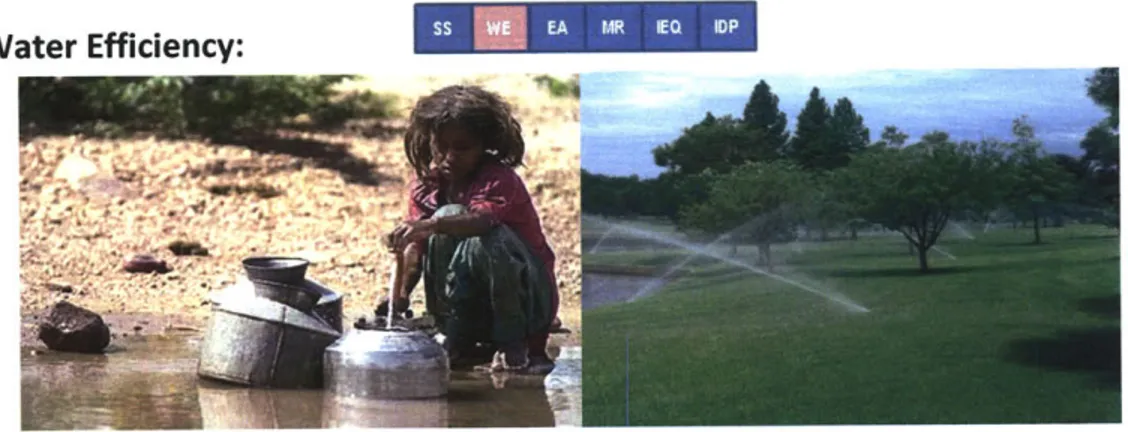
Picture 4.2: Water Efficiency. Left Source worldpress.org. Right h2oasisinc.com... 56
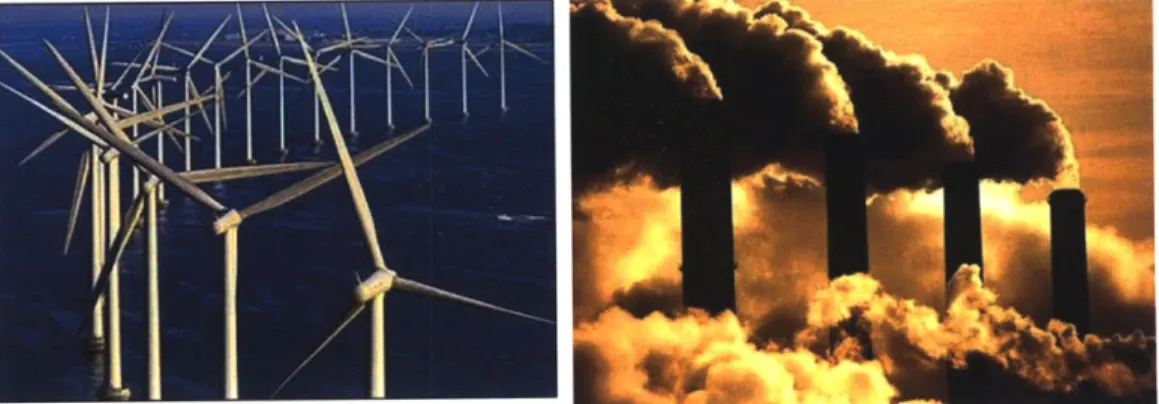
Picture 4.3: Wind Turbines. Source got2bgreen.com. Coal Power Plant. Source w o rld p ress.co m ... 6 1 Picture 4.4: Material Life Cycle. Source tca.gov.bc.ca ... 69
Picture 4.5: Components of Indoor Environments. Source fahcsia.gov.au... 75
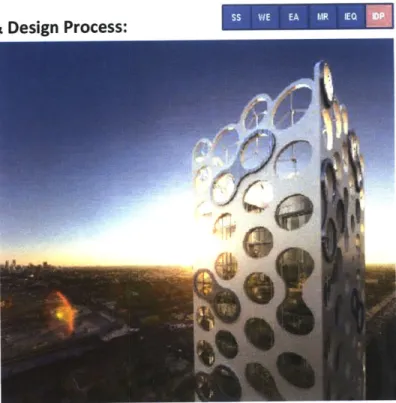
Picture 4.6: Innovative Green Tower, Miami. Source Daily commercials ... 85
Picture 6.1: Sloan Building, MIT - E62. Source MIT News... 120
Picture 6.2: Macallen Building, Boston. Source Archecord ... 120
Picture 6.3: AFH Headquarters, Boston. Source Buildinggreen ... 121
Acronyms
IDP: Innovation Design Process IEP: Indoor Environmental Quality MR: Material and Resources Poss.: Possible
Prerequ.: Prerequisite Pt/s: Point/s
SS: Sustainable Sites WE: Water Efficiency WE: Water Efficiency
The Economics of Investing in Green Buildings
Chapter 1
Introduction
Charbel Rizk Intro:01"at
Constructon Industry Chap 1&2 AiThe Economics of Investing in Green Buildings
1.0 Climate Change & Greenhouse Gases:
During earth's history, climate has changed multiple times with extremes ranging from ice ages to long periods of warmth. In the last decades, scientists have observed some rapid changes caused by climate. In addition to the natural reasons behind these changes, human activities have substantially added to the amount of greenhouse gases in the atmosphere, changing its composition (EPA, 2009). The composition of the atmosphere at global and
regional scales influences climate, air quality, stratospheric ozone, and precipitation, which in turn affect human health and the vitality of ecosystems (USGCRP, 2008). Greenhouse gases,
defined by particular behaviors such as trapping heat, which enter the atmosphere solely as a result of human activities, are (EPA, 2009):
- Carbon Dioxide (C02)
- Methane (CH4)
- Nitrous Oxide (N20)
- Fluorinated Gases
The challenging part and area of disagreement is in determining the fraction of climate change due to natural variability versus human activities.
The expected effects of climate change are unclear yet, however they may result in reduced diversity of ecosystems and the extinction of many species. Changes will be unevenly
distributed between regions; in early stages they might be beneficial for few but will eventually end up being costly for all. These effects include:
- Rise of sea level
- Extreme weather such as hurricanes, tornadoes
- Glacier retreat and disappearance
- Temperature rise
Studies of today's effect of climate changes are being performed all over the world. In many cases results are discouraging with statements from involved individuals such as "What we would want to have people take away is that climate change is happening now, and it's actually beginning to affect our lives," (Karl,2009) or "Climate change is already killing people in Africa,
Chapter 1
Page 2
The Economics of Investing in Green Buildings
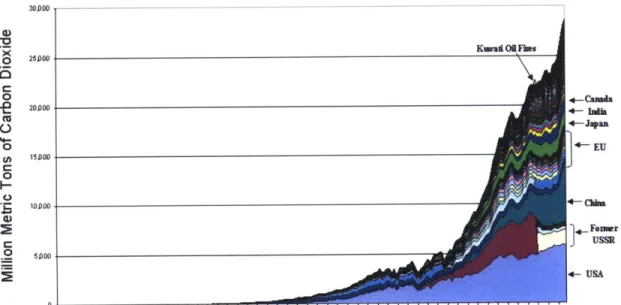
and this commitment is simply insufficient to tackle the climate crisis," (Mwenda, 2009). The need to reduce greenhouse gases emissions is clear; however each country's commitment to doing so varies and that due to several factors including economical impact. Figure 1.1 below shows the increase in emissions and shares of major contributors.
20000
0 0
6
0
(U +- USA
Fiur 1.1:0 WodCabn ixieEmsios(EA209
4-JV 0 E () 15JD00 0 I-d) 0 5900 1752 1782 1772 1782 1792 1802 181 1822 1832 1842 1852 1882 1872 1882 1882 1802 1912 1822 1822 1042 1952 1882 1872 1982 1982 2002
Figure 1.1: Word Carbon Dioxide Emissions (EPA,2009)
1.1 Construction Industry:
Realizing the importance of current climate changes, and being from a construction
background, thesis topic was born. My interest is in understanding the economics of Green Buildings, or more specifically to answer:
" What is the Capital Cost impact associated with building green? " What is the Operational Cost impact associated with building green? * What are the major difficulties faced when building green?
As an industry, construction is a major source of Greenhouse Gases. Public awareness of this fact is very low, with a majority thinking that transportation is the highest contributor. On a high level, building emissions are a result of fossil fuel use and land use. Some statistics about buildings in the US:
- Buildings Account for 38% of C02 emissions in the United States -more than either the
transportation or industrial sectors (USGBC, 2007)
Rizk, 2009 Page 3
The Economics of Investing in Green Buildings
- Over the next 25 years, C02 emissions from buildings are projected to grow faster than
any other sector, with emissions from commercial buildings projected to grow the fastest-1.8% a year through 2030 (USGBC, 2007)
- Buildings consume 70% of the electricity load in the U.S. (USGBC, 2007)
- 30% of raw materials use (GBRC,2009) - 30% of waste output (GBRC,2009)
- Buildings have a lifespan of 50-100 years during which they continually consume energy and produce C02 emissions. If half of new commercial buildings were built to use 50% less energy, it would save over 6 million metric tons of C02 annually for the life of the buildings-the equivalent of taking more than 1 million cars off the road every year (USGBC, 2007)
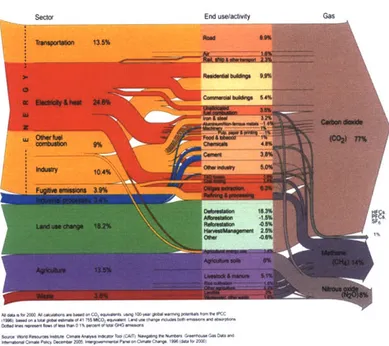
Worldwide studies align with the statistics above and emphasize that buildings have a large share in GHG emissions. An example would be the research prepared by Riccardo Pravettoni, UNEP/GRID-Arendal for the 'World Resources Institute, Climate Analysis Indicator Tool (CAIT)'. Results of the research are summarized in Figure 1.2 below.
World greenhouse gas emissions by sector
Sector End uselactivity Gas
,t996 besmo a tWOt gbl stni041 75MMICO,*tasetlnduetag cudsbt msnsadaipi
W _ce
nsrprsr1 sof Isa tie 0 1%prcn f oa GMG arasin
sorc krsRsuce nt Canl Analys inma TW (CAIT) KwgAtin Mh Numbere Grenh Ga. ta n inoabnlC 0ee or Decme 2005 intrgovm ena Pan" on Ci l C-age 1996 (da- br 20=)
Figure 1.2: World Greenhouse gases emissions by Sector (Source: GRID-Arendal)
Chapter 1
Page 4 Rizk, 2009
The Economics of Investing in Green Buildings
Figure shows that greenhouse gases emissions from transportation sector are about half those from Electricity & Heat. Additionally, looking at end use emissions, residential and commercial buildings emit more than all transportation systems.
1.2 Complexity of Construction
The majority of developments tend to be classified as complex systems. As defined by Ed Crawley (Crawley, 2008); a complex system is a system that is comprised of components and interconnections, interactions, or interdependencies, all of which are hard to describe,
understand, predict, manage, or change. We will explain the complexity of the system by using a discussion, it is necessary to simplify it by making some basic assumptions; however, a better understanding on the complexity of a building system does emerge:
From a holistic view, as soon as developers pick a lot for construction some decisions have been made with direct or indirect impact on the environment. The project will change the site condition, for better or worth, depending on the original status and development type/size
impact can be determined. In addition it will generate transportation needs, add loads to utilities, and might attract other developments.
Limiting ourselves to development boundaries, we will assume that a building system is only composed of 5 sub-systems that can be controlled. These 5 systems will be our decision variables (DV):
- External System (All external works: soft & hard landscaping)
- Structural System
- Architectural System
- Mechanical System
- Electrical System
Long term commitments are made each time we fix any of these DV. These will determine the behavior of building, and designers can only control DV's. We will only look at the following behaviors (BV):
- Construction with parameters: Area per floor; Number of floors - Costs with parameters: Capital, Operational,
Chapter 1
Page 5 Rizk, 2009
The Economics of Investing in Green Buildings
- Consumption with parameters: Water, energy - Emissions with parameters: Greenhouse gases What is important to note from the above example is:
" Most DV's 'depend on' and 'provide info to' each other " Most BV's 'depend on' and 'provide info to' each other " BV's depend on multiple DV's
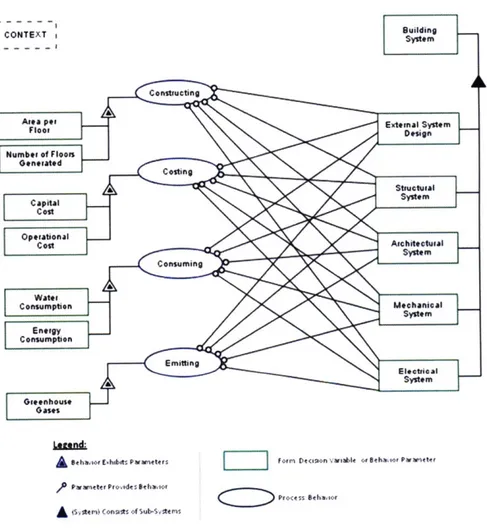
The Object Process Diagram shown in Figure 1.3 summarizes the dependencies between DV's and BV's (only).
aamnd:
A Sehaitor EhbKts Panetrs form Decinon vartable or Oehaior Pameer PrarunterProvides tha~.Ir
($yster) Consists Of Sub-vstems Poeseh~o
Figure 1.3: Building System Decomposition
For sustainability, optimization of performance is required. Because of dependencies and tradeoffs, we can anticipate how complicated and large our problem will be. In sum,
Rizk, 2009 Page 6
The Economics of Investing in Green Buildings
designers/developers of sustainable buildings face key challenges, opportunities, and issues. They should focus on optimizing the system as a whole and not as sub-systems, since
optimizing the parts does not necessarily optimize the whole.
In the chapter to follow, we will build on this discussion, and briefly talk about contemporary work.
1.3 Overview of Thesis
The purpose of this study is to understand the economics of green buildings. In order to do that, we need first to define green buildings; we rely on existing standard to determine whether a building is green or not and to compare green buildings.
In chapter 2 we briefly examine the history of sustainable developments, and discuss its benefits and the barriers to entry.
In chapter 3 we look at existing standards, and then identify the one which is the most relevant to our study. We also define costing terminology that will be used throughout the rest of the
study.
In chapter 4 and after selecting the standard, we first explain the intent and requirement of every clause in the standard, and then analyze it. The analysis part includes: cost incurred to qualify for any particular clause, benefit resulting from sticking to requirement, difficulty of meeting requirement, and finally some other dependencies such as external factor.
It is important to clarify now the assumptions on which analysis in chapter 4 and onwards is based:
- We defined our system boundary to be the building itself; and thus any benefits flowing from any system outside this boundary are excluded. For example, benefits of using greener alternative to commute to and from the system are excluded. - The most important benefits obtained from building green are non-monetary.
Non-monetary benefits include but are not restricted to, reduction of greenhouse gases
Chapter 1
Page 7 Rizk, 2009
The Economics of Investing in Green Buildings
emissions and increase in human health. In our study, we did not convert these benefits into monetary value; we only examined the financial implication of achieving these very important benefits.
In Chapter 5 we present and analyze the result of research done by two lead organizations. We will start with a research prepared by Davis Langdon, then we will present results from the U.S. General Services Administration (GSA). Davis Langdon is a global construction consultancy company and GSA is one of the largest building owners in the US.
In Chapter 6 we discuss two buildings in the Boston area as well as the new Sloan Building at MIT. We go more into the details of these case studies and extract the lessons learned from these experiences.
Chapter 7 is dedicated to comparing and drawing conclusions based on all work in chapters 4, 5, and 6. Our key findings will be summarized as heuristics on the standard. The concluding chapter also comprises any opportunity for improvement, and next steps or research which might help in improving and quickening the adoption of green building standards.
Figure 1.4 below graphically summarizes the thesis progression:
Figure 1.4: Summary of thesis
Rizk, 2009 Page 8
Chapter 1
Page 8 Rizk, 2009
The Economics of Investing in Green Buildings
Chapter 2
Literature Review
The Economics of Investing in Green Buildings
2.0 Introduction:
Driven by the threat of climate change, sustainability has become a global concern. After briefly introducing our research topic in the previous chapter, we will now:
- Discuss sustainability in general
- Provide examples of green developments - Summarize the history of Green Building in US - Discuss Barrier to Entry of Green Buildings
- Examine Benefits of Green Buildings
2.1 Generic Sustainability Discussion:
Green thinking was initiated in order to preserve the environment, ensure a healthier life, minimize the waste and impact caused by human actions, and save resources for next generations. With the absence of one globally approved definition, we can deduce that
sustainability tends to be frequently tied to the use of natural resources. We are currently experiencing some of the effects of pollution such as the frequency and severity of natural disasters (earthquakes, floods, etc...), and global warming. The stress and fear of the increasing impact, have led world leaders to gather and collaborate in developing and deploying clean energy technologies. Agreements and firm objectives for emissions cuts have resulted from these climate summits. In December 2009; Copenhagen hosted a climate conference with representatives from 170 countries on governmental level. Abundant scientific evidence proves that humanity is living unsustainably (EPI, 2009).
It is important to note again that the building industry is a major emitter of greenhouse gases. These emissions occur in construction phases as well as in operational phases. In addition to that, dumping of construction materials and equipments might lead to sever environmental
impacts.
Just as sustainability has multiple definitions, so does Green or Sustainable buildings. The majority include the idea of optimizing use of resources. The definition used for the purpose of this discussion: "Green" or "sustainable" buildings use key resources like energy, water,
Chapter 2
Page 10 Rizk, 2009
The Economics of Investing in Green Buildings
materials, and land much more efficiently than buildings that are simply built to code (Kats-CA,2003).
The main challenge for architects and engineers is in creating green buildings to provide the same living standards for occupants while minimizing consumption of resources. Although most of the progress realized thus far has resulted from the last decade, some designers like Victor Papanek introduced this concept as early as the 1970's. He argued for the need for codes and standards to be followed by designers in order to guide them in reaching more ethical designs. Simultaneously, and following Papanek's work, many publications and programs were started. These efforts led to an increase in attention on green buildings, which resulted in the
emergence of green buildings standards, motivations, innovations, and new construction designs and methods. Now, the use of technology and automation to achieve an
environmentally sound and resource efficient building has become very popular. The main areas of impact can be viewed from different perspectives and include:
- Energy efficiency examples: " Photovoltaic Cells
" Smart lighting
" Motion sensitive lighting
- Material efficiency examples: " Use of recycled material
e Reuse of materials
e Improved materials specification
- Water efficiency examples:
e Green roofs
" Water Recycling * Water efficient fixtures
Generally speaking, improvements over the life cycle of items were made as well.
Rizk, 2009 Page 11
Chapter 2
Page 11 Rizk, 2009
The Economics of Investing in Green Buildings
A factor with high impact on building emissions is energy efficiency. Let's examine this over the life cycle of a product/project, from production, distribution, operation and finally to the end of the project life.
Starting with the production, because of today's technology, embedded energy has become much lower. Processes have become more efficient, and much effort is put to reduce use of
raw material, particularly virgin material.
The Supply chain management gained more weight in companies, and with the availability of software and other tools, and with the advancement made to delivery modes, energy needed to deliver has been reduced significantly.
For the operation; taking Photovoltaic cells, the earliest PV devices converted about 1%-2% of sunlight energy into electric energy while today's PV devices convert 7%-17%. (US, DOE). As for the consumption, fixture and appliance manufacturers are heavily investing in researches to improve efficiency and minimize losses in their systems. Many of these programs are co-sponsored by governmental institutions. As an example, Energy Star qualified compact
fluorescent light bulbs (CFL) use 66% less energy than a standard incandescent bulb and last up to 10 times longer (US, DOI). "If every household in the U.S. replaced one light bulb with an ENERGY STAR labeled (CFL), it would prevent enough pollution to equal removing one million cars from the road." (US, DOI). It is clear that the objective is to minimize demand and optimize production.
At their end-life, construction material and equipment tend to be highly toxic. Environmental agencies and manufacturers have worked closely to reduce the effect of these bad
characteristics and have laid out better methods to deal with them.
This entire move towards more sustainable buildings, including the changes in the technology, and the increase in demand, has made over 2,000 environmentally preferable products available in the United States today (Building Green, 2009). Table 2.1 below provides a list of these product categories, number of products in sub-categories, and gives two key features as listed by one independent company: Build Green LLC. In most cases multiple products are
Rizk, 2009
Page 12
Chapter 2
Page 12 Rizk, 2009
The Economics of Investing in Green Buildings Chapter 2
available for each sub-category, leading to a price and quality competition between manufacturers.
Green Products
Category Sub Examples of Key Features
Cater.
* Resource/Material efficient products
Sitework & Landscaping 30 * Pervious surface
Decking 7 * Sustainably harvested, long lating exotic hardwood
* Local product (stone)
* Recycled plastic & wood-plastic composites
Outdoor Structures 14 * Avoid use of treated wood
* Recycled aggregate
Foundations, Footers, and Slabs 21 * Non-toxic backfill material
* Material that properly insulare homes
Structural Systems and Components 21 * Engineered products that minimize waste * Recycled content sheathing
Sheathing 5 * Higher percentage use of tree
* Locally produced
Exterior Finish and Trim 12 * Durable, elastic, and strong
* Lighter Colored
Roofing 19 * Reflective
* Energy performance
Windows 19 * Durable spcares for glass layers
* Wood from certified sources
Doors 6 * insulating values
* Raw material and production process
Insulation 20 * Carcinogenicity
* Low replacement frequency
Flooring & Floorcoverings 3 * Raw material
* Low toxicity, low-permeability coating
Interior Finish &Trim 3 * Low virgin timber use
* Waterborne products
Paints & Coatings 19 * No cross-linking agent
* Low tocicity or Non-toxic
Caulks & Adhesives 5 * Low VOC adhesive
* Efficient and durable equipment Mechanical Systems/HVAC 42 * Low air pollution systems
* Water efficient fixtures
Plumbing 36 * Wate water treatment systems
* Energy efficient fixtures
Lighting 11 * Non-toxic fixtures
* Non-Toxic wire and cable insulation
Electrical 16 * Deterioration characteristics of cables and wires
* Energy efficient appliances
Appliances* Water efficient appliances
* Certified wood
Furniture & Furnishings 21 * Mechanically fastened (minimize use of adhesives)
* PV panels
Renewable Energy 13 * Wind power
* Recycled tire rubber
Miscellaneous 26 * Biodegradable oils
Table 2.1 Green Products (Prepared by Author based on Building Green, 2009)
Page 13 Rizk, 2009
The Economics of Investing in Green Buildings
2.2 Contemporary Sustainable Examples
Intensive work and research funded by private and governmental institutions allowed realization of passive house. By definition it is a house where energy consumption is reduced by at least 90% of a usual code-built one. Passive house can be mostly found in Europe, based on a
report by New York Times (Rosenthal,2008) printed in 2008; there are currently 15,000 passive houses around the world and this market is expected to grow rapidly.
Solar thermal coN. Super
(optional) inulon
supply
triple ' air etact
pane ar
double low-e
glazing su
ar air
Ventillation system with heat recovery
ground heatexchanger
Pic 2.1: Passive House Example. (Source: Wikipedia)
Passive house principles mainly concentrate on increasing the efficiency level of heating and ventilation systems by increasing the insulation level of walls, roofs, floors, windows, and doors. By properly positioning the building and providing proper air circulation, we can attain the energy savings mentioned earlier. In picture 2.1 above, we have an example of a combination of low energy building techniques and technologies which successfully met these requirements.
Passive house design is carried out using simulations such as Passivhaus Planning Package' (PHPP).
One of the most significant research related to indoor temperatures, is the one by Michael Humphreys (Humphreys, 2006). He has demonstrated that people who live in hotter climates are comfortable with higher temperatures, and vice versa. This has been developed further to
prove that it is also a function of the season and not only geography. Equations for comfortable
Chapter 2
Page 14 Rizk, 2009
The Economics of Investing in Green Buildings
temperature as a function of external temperature have been developed and used on many projects.
Since during a cold season, individuals will be comfortable with lower temperatures than during other seasons, indoor temperature should be adjusted lower in order to reduce heat usage.
In sum, heating and cooling systems are done in "good enough" manner to keep occupants comfortable. This work proves how detail oriented designers are becoming; they aim to avoid any non-necessary energy consumption. Work is still in progress to develop better and deeper understanding of all factors which affect comfort levels including: humidity, activity levels, and surrounding temperatures.
Efforts are not only restricted to green buildings but have gone beyond that to the
development of green cities. A good example of that is Masdar city (Masdar means source in Arabic) in Abu Dhabi, one of the world largest suppliers of oil.
Pic 2.2: Masdar City top View (Source: http://www.commtechservices.ca/images/masdar-city-uae-749854.ipg)
As seen in Picture 2.2, Masdar has defined boundaries, and is designed to become a zero
carbon emission city. Masdar Institute of Science and Technology defined Zero Carbon Emission as:
- Within boundary no carbon is released
- Scope includes carbon emitted in construction and operation phase
Chapter 2
Page 15 Rizk, 2009
The Economics of Investing in Green Buildings
- Minimize and offset any carbon related to the scope of the city. Example carbon
emitted to produce fruit that is sold in the city will be compensated for by sending electric power to the grid.
Some of the systems used in the city have been tested in laboratories without the need for applying to actual projects; an example of that would be Personal Rapid Transit (PRT). This aligns with their goals of innovating, experimenting, learning, and sharing to become a knowledge source for green developers. In order to meet the Zero Emission objective, Masdar is also counting on the change of behavior of the occupants. For example, in Abu Dhabi the water consumption per capita is very high; it is 350 liter/capita/day (1/c/d) compared to 125-150 1/c/d in West Europe (EAD,2009). In Masdar the city design was made with the assumption that the consumption will be 146 1/c/d with only 65 l/c/d fresh (F+P, 2007).
In this section we have given examples of work on house level, on a building sub-system level, and city level. In the previous section, one of our discussions was on a product level. As mentioned in Chapter 1 Development projects, tend to be complex systems; with involvement of multiple stakeholders with different utility functions. The main challenge is to integrate work on different levels in order to reach more environmentally responsible products while meeting the needs of stakeholders.
We will now briefly present sustainable building history in the US.
2.3 US Green Building History
The earliest experiments with green buildings started in the late 1960's early 1970's. In the 1970, US were trying to reduce energy consumption in order to become less dependent on foreign oil. Then, in the 1980's oil prices went down taking away the interest in reducing energy use. In the 1990's, organizations and individuals working in this field began to come together more formally. Few early milestones in the U.S. include (EPA, 2009):
* American Institute of Architects (AIA) formed the Committee on the Environment Exit
Disclaimer (1989)
Chapter 2
Page 16 Rizk, 2009
The Economics of Investing in Green Buildings
* Environmental Resource Guide published by AIA, funded by EPA (1992)
* EPA and the U.S. Department of Energy launched the ENERGY STAR program (1992) * First local green building program introduced in Austin, TX (1992)
* U.S. Green Building Council (USGBC) Exit Disclaimer founded (1993)
* "Greening of the White House" initiative launched (Clinton Administration 1993) * USGBC launched their Leadership in Energy and Environmental Design (LEED) Exit
Disclaimer version 1.0 pilot program (1998)
The Federal Commitment to Green Building: Experiences and Expectations (EPA, 2009), a report of the Office of the Federal Environmental Executive, provides a history of federal involvement with green building. Some of the key federal milestones include:
* The Energy Policy Act of 2005 includes federal building sustainable performance standards
(2005)
* Nineteen federal agencies sign Federal Leadership in High Performance and Sustainable
Buildings Memorandum of Understanding (PDF) Exit Disclaimer (10 pp, 152 KB, About PDF) at a White House Summit (2006)
* The Office of Management and Budget unveils a new Environmental Scorecard for federal
agencies which includes a Sustainable Building element. (2006)
* Federal Green Construction Guide for Specifiers Exit Disclaimer is made available on the
Whole Building Design Guide (2006)
* President Bush signs Executive Order 13423 - Strengthening Federal Environmental,
Energy, and Transportation Management (PDF) (7 pp, 105 KB About PDF), which includes federal goals for sustainable design and high performance buildings (2007)
* The Energy Independence and Security Act of 2007 includes requirements for high
performance green federal buildings (2007)
Rizk, 2009 Page 17
Chapter 2
Page 17 Rizk, 2009
The Economics of Investing in Green Buildings
One of the standards used in US is LEED; it has emerged rapidly. "In 2006, U.S. Green Building Council's (USGBC) LEED green building rating system recorded a 50 percent increase in cumulative LEED registered projects (those intending future certification) and nearly a 70 percent increase in LEED certified projects. As of November 2007, more than 8,000 projects representing more than 1.5 billion square feet of space had registered under the LEED system and more than 1,100 projects had received certification"(USGBC,2009). This can be looked at as a shift in market and in customer requirements. Efficiency became a major criterion in addition to luxury, functionality, and all others which governed before.
2.4 Barriers to Entry of Green Buildings
One of the main entry barriers for green buildings is an economic one. To date there is a perceived belief that green buildings are much more expensive than conventional ones. In particular, people are worried about the initial capital to be invested in design and construction. Lack of data makes it difficult for green building defenders to argue for additional investment if needed. They don't yet have enough concrete data to demonstrate short term payback (or 0 years in case no additional investments are required).
Another entry barrier is the complexity due to lack of experience and exposure to new
methodologies. Green buildings require some special methods in design and construction; few of the concerned parties (designers, contractors, sub-contractors, etc...) have had enough experience in green buildings. Integration, communication, and cooperation between different entities are highly favorable to facilitate the process and waive some unnecessary costs.
Unfortunately, and to date, each party tends to work separately and with little transparency. A cultural change is required; new approaches like BIM (Building Information Modeling) are being developed to facilitate communication and integration on projects. Because of the growing need for optimizing efficiency specialized corporations were established. These corporations focus on developing tools and approaches to build greener. Lean Construction Institute (LCI), founded in 1997 has an aim of extending Lean production Revolution to the construction industry. LCI perform research to maximize value delivered and minimize waste by developing
Chapter 2
Page 18 Rizk, 2009
The Economics of Investing in Green Buildings
knowledge regarding project based production management in the design, engineering, and construction of capital facilities. However; companies should be willing to cooperate, share
knowledge, invest in tools, and change their culture, in order to derive successful results.
Hygienic barriers are slowing the penetration of some water saving products; for example waterless urinaries are not widely accepted.
Other categories of barriers identified at Green Building conference hosted by EPA in Atlanta are (Shapiro,2009):
- Technical/Research: lack of performance data on green systems and technologies, lack of definitions of green terminology, lack of clearinghouse of information on best
practices, inaccessibility of financial data and cost/benefit analyses
- Political: partisanship, status quo interests, unions, property rights advocates, lack of political champion for greening codes
- Financial: budget shortfalls (accentuated by the recession), jurisdiction for funding (state vs. local allocation) for code changes
The lack of awareness of environmental impact of buildings slows down the growth of green buildings. In chapter 1 we have seen the large share of buildings in global Greenhouse Gases emissions, but surveys still show very low awareness of this fact. For example, a survey
reported that only 4% of U.S. adults realize that buildings are the leading source of greenhouse gas emissions in the United States. (Harris,2008)
A main take away of the conference as stated:
Some of these barriers are more of perception than reality, but perception is reality when it comes to making political change. In addition, most are very real---code changes require political will and resources, and good communication among stakeholders both within the government and with the regulated community (Shapiro,2009).
Rizk, 2009 Page
19
Chapter 2
Page 19
The Economics of Investing in Green Buildings
2.5 Benefits of Green Buildings
While talking about Green buildings the most important benefits that come to our minds are related to the environment and to operational cost. Environmental advantages are not restricted to atmosphere but also include indoor environment. Studies have shown that indoor environments have physical and psychological impact on occupants. Many studies were performed on the impact of daylight, and in particular its relationship with productivity at offices and in classrooms. In school cases, Heschong Mahone Group (HMG,2003) showed up to 20% better performance in classrooms because of increase in daylight. As for offices, workers were found to perform 10% to 25% better on tests of mental function and memory recall when they had the best possible view versus those with no view (HMG,2003). Indoor requirement does not only cover lighting but also requires a higher air volume per capita. This shows the commitment to ensure a more comfortable indoor environment for occupants. Gregory Kats (Kats-MA,2003) looked into 60 green buildings and compared them to traditional buildings. In his study, Kats quantified benefits obtained from improvement in internal air quality. Results claimed an increase of 10.1% in the productivity of the workforce; the improvement resulted from ventilation, temperature control, lighting, and daylight. "A 1990 study by the American Medical Association and the U.S. Army found that indoor air quality problems cost U.S. businesses 150 million workdays and about $15 billion in productivity losses each year. The World Health Organization puts the losses at close to $60 billion" (GBRC,2009).
The above study performed by Kats in Massachusetts, also compared the energy performance of green and traditional buildings. Results demonstrated that the Green Buildings are 25% to 30% more energy efficient, and have much lower peak consumption than traditional buildings. In Massachusetts the hourly rate at peak hours is about three times that of off peak hours, thus lowering peak demand is very beneficial and cost effective.
After showing some of the Green Building benefits, Kats evaluated financial savings per square foot for five categories and compared them to the extra capital cost for building green. The categories he investigated were:
- Energy Savings
Chapter 2
Page 20 Rizk, 2009
The Economics of Investing in Green Buildings
- Emissions Savings
- Water Savings
- Operations and Maintenance Savings
- Productivity and health benefits.
In sum, Kats findings on a twenty year basis were that financial savings are much greater than costs. Figure 2.1 below summarizes the research results.
Figure 3
Financial Benefits of Green Buildings Summary of Findings (per ft2)
Category 20-year Net Present Value
Energy Savings $5.80
Emissions Savings $1.20
Water Savings $0.50
Operations and Maintenance Savings $8.50
Productivity and Health Benefits $36.90 to $55.30
Subtotal $52.90 to $71.30
Average Extra Cost of Building Green (-3.00 to -$5.00)
Total 20-year Net Benefit $50 to $65
Source: Capital E Analysis
Figure 2.1: Summary of cost-Benefits of green buildings (Source: (Kats-MA,2003))
Sustainable buildings also accrue benefits which are not directly related to occupants or environment. Examples of some of these indirect benefits are:
- Economic Growth: Regarding materials, green buildings encourage use of local and regional materials which will increase growth of local economies.
- Avoiding increase of capacities: On city and state level, green buildings decrease the load on the infrastructure. In some high pace expanding cities, power companies didn't need to increase capacity because of the renovation of old buildings making them more efficient, and because of the high energy efficiency of new buildings. Power companies are even motivating their big customers to invest in energy savings. For example NSTAR, a large Gas and Electric utility in Massachusetts, collects a separate percentages from each customer "Energy Conservation" (NSTAR,2009) which goes to energy saving
Chapter 2
Page 21 Rizk, 2009
The Economics of Investing in Green Buildings
programs. This revenue goes to big customers like MIT as a conditional amount to be invested in improving energy efficiency of their buildings.
- Marketing Advantage: Green buildings can be viewed from developers' perspective as a competitive advantage, and from a buyer's perspective an asset with higher resale value.
In sum, benefits of green buildings can be mapped to the following: " Site selection,
" Energy efficiency, * Materials efficiency, " Water efficiency,
e Building operation and maintenance.
Depending on stakeholders, a larger list of benefits can also be found.
2.6 Conclusion
We started this chapter with an overview of the contemporary work and achievements of sustainable buildings. After that, we reviewed the history of American Green Buildings with the purpose of understanding its evolution with time. The last two sections emphasized the main barriers to entry and benefits of Green Buildings. As for the next chapter, we will study the methods used for evaluating how sustainable a building is, and will focus on the method which will be used throughout the rest of our analysis.
Rizk, 2009 Page 22
Chapter 2
Page 22 Rizk, 2009
The Economics of Investing in Green Buildings
Chapter 3
Green Buildings Standards
Charbel Rizk Intro: Climate Change, GHG, Construction Industry Chap 1&2
The Economics of Investing in Green Buildings
3.0 Introduction
After getting a big picture of green buildings, a metric for classifying them is required for our further analysis. Starting with the incentives which led to these standards will help us understand their requirements. Incentives were created from the perspective of occupants, developers, utilities, cities, and residents in general.
3.1 Incentives
The rev-up of investments in energy efficient buildings resulted from several incentives and factors including:
* Rise of oil prices * Water availability
* Emergence of new technologies and falling price of eco-efficient solutions Increase in public awareness and concern of environmental protection. * City and State programs
* Attraction of investors due to higher profit margins and larger market size
e Augmented efforts by big institutions such as colleges and universities to minimize their
environmental footprint
3.1.1 Oil Prices
Increases in oil prices have a major effect on consumer behavior. In the transportation sector for example, according to the Department of Transportation and the American Public Transportation Association, the cumulative Vehicles Mile Travelled (VMT) by December 2008 in the United States fell by 115 billion miles or 3.6% as oil prices increased (DOT,2008). In the
building sector, since energy costs depend on oil prices; consumers reacted similarly. On-going studies at MIT are also demonstrating that by sending daily text messages to customer mobile phones, informing them about their bills, consumer conduct will be affected resulting in less energy consumption. Figure 3.1 shows the fluctuation of oil prices, on February 5th of 2008 it
was traded at $ 51.71 per barrel, on July 1 1th of 2008 it peaked at a value of $ 86.9. In about 7
Chapter 3
Page 24 Rizk, 2009
The Economics of Investing in Green Buildings
months, an increase of approximately 68% occurred. Monthly utility bills of building occupants increased drastically in return, increasing their interest in looking for energy efficient
alternatives. As a result of the changes in customer needs; architects, contractors, equipment manufactures, and all other related parties, began investing heavily in research for
consumption reduction.
Week f Dec 29. 2006 = OIL 25.11
2000 00t z007 A#2.1 Oct 2000 AP. Jul Olt 2000
20
20 5D A2Op Octf2HGM0 1 Y 07 FRO A Oct 6 TO: 2 20
Figure 3.1: 5 Crude Oil Prices. (Source: (Yahoo,2009))
3.1.2 Water Availability
In contradiction with an earlier belief, "water will be the oil of the 2 1't century". The
main issues with water are availability (quantity, location) and quality. Water is unevenly distributed around the world; frequently requires costly distribution and costly treatment before safe usage. In commercial buildings water is mainly divided into four types: Potable or drinking water, grey water, black water, and storm water. Potable water refers to water which is suitable for human consumption; Greywater is the domestic wastewater from bathroom fixtures (such as basins, showers and baths), laundry fixtures (such as clothes washing machines and laundry troughs) and kitchen facilities (such as sinks and dishwashing machines);
Blackwater refers to waste discharges from the human body (Australian Standards, 2000), which are collected through fixtures such as toilets, urinals and bidets; Storm water refers to run-off due to rainfall collected from roofs, impervious surfaces and drainage systems
Chapter 3
Page 25 Rizk, 2009
The Economics of Investing in Green Buildings Chapter 3
(Australian Standards, 2003). This classification helps innovation in 'Reduce, Reuse, and Recycle', and it clusters water based on its necessity and pollution level. Similar to power discussed earlier, water demand correlates with cost. In addition, the concern to safeguard enough water for the coming generations motivates parties to invest in optimizing water usage.
3.1.3 New Technologies
The emergence of new technologies and the price decline of existing ones have made feasible and cost efficient technologies that were prohibitive in the past. Light occupancy sensors are a good example of an energy saving technique widely spread due to its lower cost, better
performance, and higher return on investment. A rational decision maker before taking any decision should compare the added value to the cost of implementing a project; in the case of occupancy sensors investment became smaller and return became larger leading to a more attractive alternative. In return, the larger demand decreased the price of fixtures because of
higher competition in the market place, and economies of scale and scope. With the MIT campus case, a large number of small projects substituting existing switches with automated sensors, or changing lighting fixtures has been completed in the last few years and the return on investment was high in all of them.
3.1.4 Awareness
Colleges, universities, publishers, global programs, media, governmental and private
institutions are key players helping in educating people on the effects of global climate change. Most higher education institutions offer courses (some even 2 to 3 year programs) educating students on greenhouse gases emissions, the availability of natural resources, and providing strategies for minimizing human impact on the environment. In buildings, individuals can make difference with relatively little effort or change in comfort level; unfortunately, few people realize this and act accordingly. In response, plenty of articles have been issued to call attention and emphasize that 'every drop counts', and teach people to discipline their behavior. Some of the simple tasks proposed are switching off lights whenever leaving the room, making sure to
The Economics of Investing in Green Buildings
properly turn off faucets, unplugging chargers while unused, and recycling and purchasing recycled products.
3.1.5 City and State Programs
In the US on federal, state, and city level, construction rules and regulations are being enacted to incentivize green buildings. They are also developing programs to persuade investors to build green. These programs range from funding in research with academic
institutions and private organizations, to advertisement, tax incentives, and help for customers. For example, the United States Department of Energy and NSTAR announced in February 2009 that they are teaming up once again with MIT for clean energy competition; "to accelerate the pace of clean energy entrepreneurship" (NSTAR,2009). Based on NSTAR, this competition over the years gave birth to 85 companies in the clean energy field; thus increasing range, efficiency, and technology of products. A large portion of the 2009 economic package is for energy related incentives: Federal proposals include $32 billion to upgrade the nation's electrical distribution system, more than $20 billion in tax cuts to promote the development of alternatives to oil, and billions more to make public housing, federal buildings and modest-income homes more energy efficient (Taylor,2009).
3.1.6 Attraction to Investors
Earlier we gave examples of dependency of utility bills on factors such as oil prices. Due to the variance of these external factors, customers are willing to pay a premium to minimize this dependency, which can be seen as willingness to pay in order to hedge risks. Hedging can be done by purchasing houses with lower consumption rates. In addition, the emerging market is allowing higher profit margins for investors and attracting dealers, suppliers and
sub-contractors. All this is leading to growing efforts toward green buildings, particularly because there are high expectations of ongoing growth in the coming years.
3.1.7 Effort by big Institutions
The effort by large energy consumers is mainly driven by incentives noted earlier in chapter 2, enticements mentioned in this section, as well as image issues Due to the number of occupants
Chapter 3
Page 27 Rizk, 2009
The Economics of Investing in Green Buildings
and stakeholders, high consumption, the return on investment becomes much more attractive to the larger bodies.
3.2 Summary of Existing Standards and Standard Selection
The initiation and evolution of green building standards were driven by the intent to promote sustainability and provide guidance for sustainable design. Several worldwide rating systems were established with a common objective to determine metrics for measuring a building's performance and minimizing environmental footprint. Or, as defined by the American Environmental Agency (EPA, 2009), it is the practice of:
- Increasing the efficiency with which buildings and their sites use and harvest energy, water, and materials
- Protecting and restoring human health and the environment, throughout the building life-cycle: sitting, design, construction, operation, maintenance, renovation and deconstruction
Several worldwide standards for green buildings exist, and new ones are being developed. The most popular are 27 used in 46 countries; table 3.1 provides a per country list:
Australia: Nabers / Green Star :Brazil: AQUA / LEED Brasil
Canada: LEED Canada/ Green Globes China: GBAS
New Zealand: Green Star NZ; Portugal: Lider A France: HQE India: GRIHANational Rating System by TERI /LEED India :Hong Kong: HKBEEM
Italy Protocollo Itaca :Mexico: LEED Mexico
Netherlands: BREEAM Netherlands Finland: PromisE
United States: LEED /Living Building Challenge /Green GlobesBuild it Green International Framework Committee (25 Countries): GBTool
Spain: VERDE United Kingdom: BREEAM
Japan: CASBEE -Germany: DGNB
Singapore: Green Mark :South Africa: Green Star SA
Table 3.1: List of standards. (Source: Wikipedia)
Rizk, 2009 Page 28
Chapter 3
The Economics of Investing in Green Buildings
Many of these standards were created by modifying an original one; or by integrating some of them.
These standards concentrate on different areas of sustainable development such as life cycle assessment, performance evaluation, indoor air quality, operations and maintenance
optimization. The major difference is that some of them go deep into the details of a particular system while others have a more holistic view and include the building with all its systems.
Many studies comparing the different systems are available; two of them will be used for this analysis. Sustainable Building Rating Systems Summary (PNNL,2006) and Green Building Rating System-Comparison of the LEED and Green Globes Systems in the US (Smith,2006).
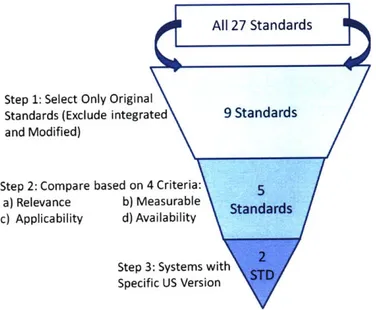
- A first selection criterion was to choose only the original systems for further analysis. - Then, after excluding integrated or modified ones, screening was performed based on 4
criteria which are: Relevance, Measurable, Applicability, and Availability.
- Relevance to US market
Figure 3.2 below summarizes the selection criteria.
All 27 Standards
Step 1: Select Only Original
Standards (Exclude integrated 9 Standards
and Modified)
Step 2: Compare based on 4 Criteria: 5
a) Relevance b) Measurable Standards
c) Applicability d) Availability
Step 3: Systems with Specific US Version
Figure 3.2: Standard Selection
The main point of differentiation between the 9 standards was the level of subjectivity. Our requirements were to select a system with clear metrics and consistency. We need to avoid or
Rizk, 2009 Page 29
Chapter 3
Page 29 Rizk, 2009
The Economics of Investing in Green Buildings
lessen the effect of different interpretations, and make it as widely applicable as possible. Only 5 systems scored positively based on these criteria, which are:
- BREEAM initiated in 1990(Building Research Establishment's Environmental Efficiency); - CASBEE initiated in 2001(Comprehensive Assessment System for Building
Environmental Efficiency);
- GBTool initiated in 1996;
- Green Globes US initiated in 2004; LEED initiated in 1998(Leadership in Energy and Environmental Design)
Green Globes and LEED have US specific versions while the others do not. Except for BREEAM, the government was involved in the development of the 4 other systems. Non Governmental Organizations were involved in all of them. In order to better understand the differences
between the shortlisted standards, a set of criteria was chosen. While the definition of what constitutes sustainable building design is constantly changing, there are six fundamental principles that nearly everyone agrees on (WBDG,2009):
- Optimize Site Potential (OSP) covers: proper site selection including consideration of site reuse rehabilitation of existing building, orientation, landscaping, transportation
methods
- Optimize Energy Use (OEU) covers: reduction of energy load, increase efficiency, utilization of renewable energy
- Protect and Conserve Water (PCW): reduce use of fresh water, control/treat site runoff, increase efficiency of water use
- Use Environmentally Preferable Products (UEPP) covers: materials that minimize life cycle impact, efficiently use resources, with 'low' or 'no' human toxicity
- Enhance Indoor Environmental Quality (EIEQ)
- Optimize Operational and Maintenance Practices (OOMP)
Table 3.2 below shows percentage of total score by category by standard:
Rizk, 2009 Page 30
Chapter 3
Page 30 Rizk, 2009
![[PDF] Formation générale d’Initiation à Python | Formation informatique](data:image/gif;base64,R0lGODlhAQABAIAAAP///wAAACH5BAEAAAAALAAAAAABAAEAAAICRAEAOw==)