Economic Research Evolves: Fields and Styles
The MIT Faculty has made this article openly available.
Please share
how this access benefits you. Your story matters.
Citation
Angrist, Joshua et al. “Economic Research Evolves: Fields and
Styles.” American Economic Review 107, 5 (May 2017): 293–297
As Published
http://dx.doi.org/10.1257/AER.P20171117
Publisher
American Economic Association
Version
Final published version
Citable link
http://hdl.handle.net/1721.1/113680
Terms of Use
Article is made available in accordance with the publisher's
policy and may be subject to US copyright law. Please refer to the
publisher's site for terms of use.
293 Economic research has become more empiri-cal, a shift documented by Hamermesh (2013), among others. We examine this shift in detail here, showing that it consists of changing research styles mostly within, rather than across, fields of economics. We also gauge the extent to which the shift in publication style is paralleled by a change in impact. Our analysis exploits a machine-learn-ing-based classification of economics journal content into fields and styles, developed as part of a project analyzing citations to economics from other disciplines (Angrist et al. 2017).
The ability to classify papers automatically lets us take a broad look at economic research: our dataset includes 134,892 papers published in 80 journals between 1980 and 2015.1 We present unweighted analyses of the full journal sample and weighted analyses that emphasize highly-cited journals.
1 Journals in this set were among the 33 most cited by the American Economic Review in any of 1968, 1978, 1988, 1998, or 2008, plus other economics journals that were com-parably well cited by the flagship journal of another disci-pline (such as the American Political Science Review).
Economic Research Evolves: Fields and Styles
†By Joshua Angrist, Pierre Azoulay, Glenn Ellison, Ryan Hill, and Susan Feng Lu*
* Angrist: Department of Economics, MIT, 50 Memorial
Drive, Cambridge, MA 02142, and NBER (e-mail: angrist@
mit.edu); Azoulay: Sloan School of Management, 100
Main Street, Cambridge, MA 02142, and NBER (e-mail:
[email protected]); Ellison: Department of Economics,
MIT, 50 Memorial Drive, Cambridge, MA 02142, and
NBER (e-mail: [email protected]); Hill: Department of
Economics, MIT, 50 Memorial Drive, Cambridge, MA 02142 (e-mail: [email protected]); Lu: Purdue University, 403 W. State Street, West Lafayette, IN 47907, and Northwestern University (e-mail: [email protected]). We thank our extraordinarily efficient and skilled research assis-tants, Gina Li and Suhas Vijaykumar. Thanks also go to the AEA’s Liz Braunstein for help with Econlit, to Ben Jones, Satyam Mukherjee, Brian Uzzi, and Heidi Williams, for help with the Web of Science data, and to our discussant, John Rust, for comments.
† Go to https://doi.org/10.1257/aer.p20171117 to visit the article page for additional materials and author disclosure statement(s).
I. Classification
Our analysis of publication and citation rates uses data from the Web of Science and Econlit databases pertaining to the articles published in our economics journal list.
A. Fields
Our field classification scheme exploits four sources of information: JEL codes; titles and keywords; the publishing journal; and the fields of the papers that a paper cites. We begin by compiling a training dataset that includes a set of papers for which Ellison’s (2002) JEL-to-17-field mapping seems likely to be reliable. The training data also include papers in a few “field journals” (e.g., the Journal of Labor
Economics) assigned to the field journal’s field.
A machine-learning algorithm trained on this dataset is used to generate an initial field clas-sification for each paper. A clustering algorithm then uses data on each paper’s initial classifica-tion and the initial classificaclassifica-tions of the papers it cites to assign a final field (the online Appendix details all procedures used in this study).
The clustering algorithm is instructed to pro-duce ten fields. Inspecting their contents, we label these fields microeconomics, macroeconomics, econometrics, public finance, labor, international, finance, industrial organization (IO), develop-ment, and miscellaneous. The miscellaneous field is an amalgam of several smaller fields including economic history, environmental economics, experimental economics, law and economics, political economy, and urban economics.
B. Styles
We classify papers as belonging to one of three research styles: theoretical, empirical, or econometrics. Papers in fields other than econo-metrics are classified as theoretical or empirical. We aim to label papers as “empirical” if they use
MAY 2017
294 AEA PAPERS AND PROCEEDINGS
data to estimate economically meaningful param-eters. Papers that cover methodological issues while also producing substantively meaningful estimates were also classified as empirical. To distinguish economic theory from econometric theory, papers classified in the econometrics field (using the process described above) were classi-fied as falling into a distinct econometrics style.
Papers are also classified into styles by a machine-learning algorithm. Our training data-set for this purpose contains 5,850 papers: 1,507 hand-classified for use in Ellison (2002); and 3,343 additional randomly selected papers hand-classified mostly by our research assis-tants (who were also trained). We used this data-set to train a random forest algorithm that takes as input article titles, journal identifiers, the assigned field, JEL codes, keywords, the publi-cation decade, and abstracts (where available).2
Our style classifications are less accurate in the 1970s, so we focus on post-1980 papers when reporting the distribution of publica-tions by style and on post-1990 citing articles when reporting citations to styles. (Citations are backward-looking.)
C. Journal Weights
Different journals publish and cite different types of papers. Scholars are especially inter-ested in the content of prestigious, highly-cited general interest journals, paying less attention to other journals. We use a weighting scheme to capture this hierarchy of journal importance; these “importance weights” are denoted w jt . For
example, our importance-weighted measure of citations to style r is c rt ≡
∑
j w jt c jrt , where c jrt isthe fraction of journal j ’s year t citations which are to papers of style r .
The distribution of publications across fields and styles is reported using both weighted and unweighted counts. Like our weighted citation measure, the weighting scheme for publications produces a measure of output that emphasizes papers that appear in top journals. For example, the weighted measure of publications in field f is
s ft ≡
∑
j w jt s jft , where s jft is the fraction of journalj ’s publications which are in field f .
2 Abstracts are unavailable prior to 1986.
The importance weights, w jt , reflect the extent
to which journal j (on our journal list) is cited by a weighted composite of six top journals. This imaginary “composite top journal” allows for changing importance within the top-six group (the top six includes the usual top five plus the
Review of Economics and Statistics, which once rivaled the top five in importance). The first step in the construction of importance weights (detailed in the online Appendix) applies Google’s Page Rank algorithm to the matrix giving the fraction of each of the top six journal’s citations to the oth-ers. This produces a value, μ kt , for each of the six.
We then compute a weighted average of citation fractions, w ̃ jt ≡
∑
k μ kt c kjt . The final w jt are thefive-year moving averages of this series.
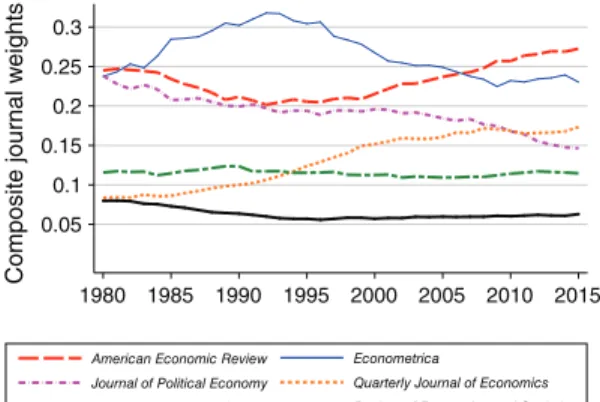
Figure 1 plots the smoothed time series of composite weights ( μ kt ) for each of the top
six. Rising from rough parity with the AER,
Econometrica leads during the late 1980s, peaking as the most important journal in the early 1990s, with declining weight through 2008. The AER and the Quarterly Journal of
Economics grow in importance from about 1990 on. These trends—for example, the rise and fall of Econometrica— should be kept in mind when interpreting weighted results.
II. Economic Research Evolves
Descriptive statistics in the online Appendix show that fields interact with styles. Papers in the microeconomics field are mostly (though not entirely) classified as theoretical, while papers in
Figure 1. Page Rank Weighting Scheme
Note: The figure plots five-year moving averages of compos-ite weights ( μ kt ) for each of the top six economics journals.
0.05 0.1 0.15 0.2 0.25 0.3 Composite journal w eights 1980 1985 1990 1995 2000 2005 2010 2015 American Economic Review Econometrica
Journal of Political Economy Quarterly Journal of Economics Review of Economic Studies Review of Economics and Statistics
the applied micro fields of labor, development, and public finance are mostly empirical. The col-lection of smaller fields grouped under the miscel-laneous heading are nearly two-thirds empirical.
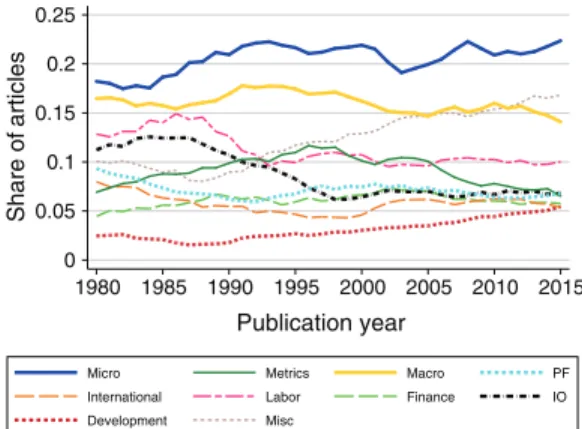
Figure 2 traces the evolution of economics journal output by field, showing the unweighted fraction of papers in each field among those published in the journals on our list between 1980–2015. Perhaps surprisingly, this figure shows the microeconomics field growing strongly since the mid 1980s, to the point where micro is now the largest field, bypassing macroeconomics in the mid-2000s. Microeconomics’ increasing publication share reflects both a proliferation of theory journals and their increasing length.3 In contrast, the publication shares for labor and IO have both declined since the mid-late 1980s.
Which fields have the more influential jour-nals been publishing? Figure 3 plots weighted field shares. Microeconomics has the largest share throughout, while macro also maintains a high share. The largest “applied micro” fields, labor, IO, and public finance, have declining weighted shares in the early years and no recent growth. In contrast with Figure 2, however, the importance-weighted statistics show substan-tial growth in our “miscellaneous” field. This amalgamated category includes environmental economics, experimental economics, urban
eco-3 For example, Games and Economic Behavior started in 1989 and Economic Theory in 1991. These two published 145 and 73 papers in 2014. Journal of Economic Theory has grown from 64 papers in 1980 to 130 in 2014.
nomics, and political economy, fields that were once perhaps on the sidelines.
The empirical shift in economic scholarship is a within-field phenomenon, a pattern documented in Figure 4, which plots the weighted propor-tion of publicapropor-tions in each field classified as empirical. In the early 1980s, development and labor were the only fields in which the majority of weighted publications were empirical. The weighted empirical share has since grown in all fields, now exceeding 90 percent in labor and development. International and public finance are also now majority empirical. Even macroeconom-ics, criticized in the wake of the Great Recession for an excess of ivory-tower theorizing, has seen its empirical share grow by over 50 percent. In most fields, these trends reflect both increasing numbers of empirical papers and the improved journal placement of empirical work (excepting IO, whose unweighted empirical share is flat).
Changes in the overall empirical share also reflect within-field more than cross-field trends. Figure 5 plots unweighted publication style shares. Within-field shifts are muted somewhat by strong growth in the mostly theoretical microeconomics field. Even so, the share of economics publications devoted to empirical work, which held steady at about 50 percent from 1980 to 1995, has since increased to a little over 60 percent. With the share devoted to econometrics essentially unchanged, this increase came out of the theoretical share.
The weighted distribution of publications by style in Figure 6 shows a more dramatic rise in empirical work. In the early-mid 1980s, the 0 0.02 0.04 0.06 0.08 0.1 0.12 0.14 0.16 0.18 Share of articles 1980 1985 1990 1995 2000 2005 2010 2015 Publication year
Micro Metrics Macro PF International Labor Finance IO Development Misc
Figure 2. Publication Shares by Field
Note: The figure shows five-year moving averages of unweighted field shares.
0 0.05 0.1 0.15 0.2 0.25 Share of articles 1980 1985 1990 1995 2000 2005 2010 2015 Publication year
Micro Metrics Macro PF International Labor Finance IO Development Misc
Figure 3. Weighted Publication Shares by Field
Note: The figure shows five-year moving averages of weighted publication shares.
MAY 2017
296 AEA PAPERS AND PROCEEDINGS
weighted empirical share was only around one-third. This lower starting point reflects the fact that empirical papers were once disproportion-ately found in less-cited journals. The weighted empirical share has increased steadily since around 1985, and now exceeds 55 percent.
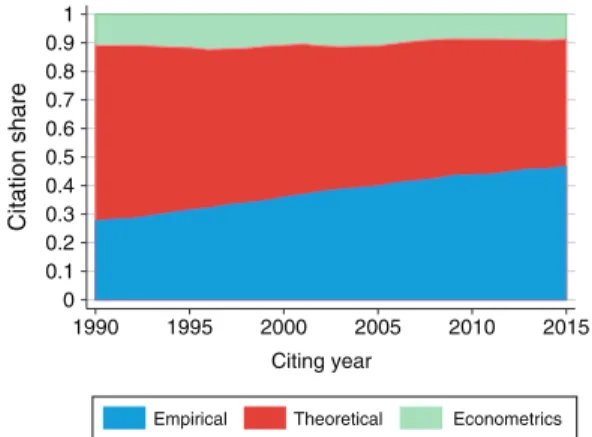
The shift in citation shares toward empirical work is even stronger than the publication shift. Figure 7, which reports the weighted distribution of styles of cited papers for citations made in 1990–2015, shows empirical work garnering less than 30 percent of weighted citations in 1990. (At the time, about half of recent publications were empirical.) The empirical citation share is now almost 50 percent. With roughly 10 percent of
citations going to econometrics, empirical work is now cited more often than theoretical work. Increased citations to empirical work naturally reflect the fact that more cited papers are empir-ical. But this change also reflects movement of empirical work into better, more-cited journals.
III. Citations Per Paper
An analysis of citations per paper highlights the different dimensions of increasing empirical impact. For each paper i published in year t(i) , we model the conditional mean of weighted cita-tions to this paper ( c i ) as an exponential function
of style dummies ( Em p i and Me t i ), a vector X i of
0 0.1 0.2 0.3 0.4 0.5 0.6 0.7 0.8 0.91 Fraction empirical 1980 1985 1990 1995 2000 2005 2010 2015 Publication year
Micro Macro PF International Labor Finance IO Development Misc
Figure 4. Weighted Fraction Empirical by Field
Note: Five-year moving averages of the weighted fraction of publications in each field that are empirical.
0 0.1 0.2 0.3 0.4 0.5 0.6 0.7 0.8 0.9 1 Share of articles 1980 1985 1990 1995 2000 2005 2010 2015 Publication year
Empirical Theoretical Econometrics
Figure 5. Publications by Style
Note: Five-year moving averages of unweighted publication shares in each style.
Empirical Theoretical Econometrics
0 0.1 0.2 0.3 0.4 0.5 0.6 0.7 0.8 0.9 1 Share of articles 1980 1985 1990 1995 2000 2005 2010 2015 Publication year
Figure 6. Weighted Publications by Style
Note: Five-year moving averages of weighted publication shares in each style.
Empirical Theoretical Econometrics
0 0.1 0.2 0.3 0.4 0.5 0.6 0.7 0.8 0.9 1 Citation share 1990 1995 2000 2005 2010 2015 Citing year
Figure 7. Weighted Citations by Style
Note: Five-year moving averages of weighted citation shares in each style.
article-level covariates, and a battery of year-spe-cific field and journal indicators, indexed by f (i) and j(i) . Baseline controls include a cubic poly-nomial for article page length and dummies for the number of authors. The model is
E [ c i | X i , Em p i , Me t i , f (i), j(i ), t(i)]
= exp [β 1t Em p i + β t2 Me t i + β 3t X i + δ jt(i) + γ f t(i) ] .
Because many papers are never cited and the citation distribution is highly skewed, an expo-nential model fits the conditional mean function of interest better than a linear model (37 percent of the papers are never cited by other papers in the sample). The coefficient β 1t captures a
time-varying covariate-adjusted log ratio of empirical to theoretical citations per paper.
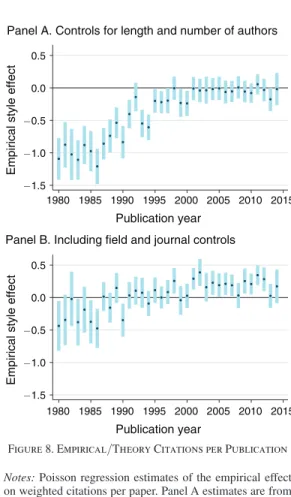
Theoretical work published in the 1980s and 1990s was cited far more often than empirical work of the same period. This can be seen in panel A of Figure 8, which plots the time series of estimates of β 1t from a model omitting field
and journal effects. Relative citation rates to empirical work grew steadily starting in the late 1980s, but only around the year 2000 did cita-tion rates for empirical papers reach parity with citation rates for theoretical work.
The estimates of a model with field and jour-nal controls reported in panel B of Figure 8 show that much of the theoretical citation advantage can be attributed to differences in the distribution of papers across fields and journals. Controlling for field and journal dummies—that is, looking within fields and journals—the empirical cita-tion deficit shrinks to less than 50 percent in the early 1980s and disappears in the late 1980s. After 2000, empirical papers are cited more than theoretical work in the same field that was pub-lished in the same journal and year. The increas-ing attention to empirical work therefore reflects factors beyond improved journal placement or persistent field-specific citation norms.
IV. Summary
Using machine-learning methods to classify economics papers into fields and styles, we doc-ument major shifts in research output and the types of papers referenced. The growth in empir-ical work reflects a substantial shift within rather than across fields. Microeconomics remains the
largest field, while some applied micro fields have shrunk. But more empirical papers are being published and they are appearing in more influ-ential journals. Citations to empirical work have grown even more than empirical output, although the empirical share of citations is just now reach-ing 50 percent.
REFERENCES
Angrist, Joshua, Pierre Azoulay, Glenn Ellison,
and Susan Feng Lu. 2017. “Inside Job or Deep
Impact? Assessing the Influence of Economics Scholarship.” Unpublished.
Ellison, Glenn. 2002. “The Slowdown of the
Eco-nomics Publishing Process.” Journal of
Politi-cal Economy 110 (5): 947–93.
Hamermesh, Daniel S. 2013. “Six Decades of Top
Economics Publishing: Who and How?”
Jour-nal of Economic Literature 51 (1): 162–72.
Empirical style effect
1980 1985 1990 1995 2000 2005 2010 2015
Publication year
1980 1985 1990 1995 2000 2005 2010 2015
Publication year
Panel A. Controls for length and number of authors
−1.5 −1.0 −0.5 0.0 0.5 −1.5 −1.0 −0.5 0.0 0.5
Empirical style effect
Panel B. Including field and journal controls
Figure 8. Empirical/Theory Citations per Publication
Notes: Poisson regression estimates of the empirical effect on weighted citations per paper. Panel A estimates are from models estimated separately by year, with flexible controls for paper length and number of authors. Estimates in panel B add field and journal controls. Confidence bands use robust standard errors.