HAL Id: hal-02284486
https://hal.archives-ouvertes.fr/hal-02284486
Submitted on 11 Sep 2019HAL is a multi-disciplinary open access archive for the deposit and dissemination of sci-entific research documents, whether they are pub-lished or not. The documents may come from teaching and research institutions in France or abroad, or from public or private research centers.
L’archive ouverte pluridisciplinaire HAL, est destinée au dépôt et à la diffusion de documents scientifiques de niveau recherche, publiés ou non, émanant des établissements d’enseignement et de recherche français ou étrangers, des laboratoires publics ou privés.
Morpho-chemistry in secondary sludge filtration cakes: a
case study
Sylvie Deneux-Mustin, Bruno Lartiges, Geneviève Villemin, Philippe de
Donato, Jean-Luc Bersillon, Fabien Thomas, Denis Snidaro
To cite this version:
Sylvie Deneux-Mustin, Bruno Lartiges, Geneviève Villemin, Philippe de Donato, Jean-Luc Bersillon, et al.. Morpho-chemistry in secondary sludge filtration cakes: a case study. Water Science and Technology, IWA Publishing, 1997, 36 (11), pp.93-99. �10.2166/wst.1997.0398�. �hal-02284486�
MORPHO-CHEMISTRY IN SECUNDARY SLUDGE FILTRATION
CAKES : A CASE STUDY
Sylvie DENEUX-MUSTIN1, Bruno LARTIGES1, Geneviève VILLEMIN2, Philippe de DONATO, Jean-Luc BERSILLON1,3, Fabien THOMAS1, Denis SNIDARO3
1 Laboratoire Environnement et Minéralurgie - INPL-CNRS, BP 40 F-54501 Vandœuvre Cedex
2 Centre de Pédologie Biologique - CNRS-UPR 6831, BP 5 F-54501 Vandœuvre Cedex 3 CIRSEE - Lyonnaise des Eaux, 38 rue du Président Wilson F-78230 Le Pecq
ABSTRACT
Light Microscopy, Transmission Electron Microscopy (TEM, EDXS), and Fourier Transform Infra Red MicroSpectroscopy (FTIRMS) were used to describe the organization and chemical distribution of major constituents in a sludge filtration cake. Samples were obtained from a municipal wastewater treatment plant using conventional ferric chloride and lime sludge conditioning.Various samples collected at different stages of the process were embedded in an Epoxy resin after acetone-dehydration, and sectioned using an ultra-microtome. The thickness of the sections was adapted to the experimental techniques used.
TEM showed that in the activated sludge, bacterial colonies, isolated bacteria and debris are trapped within a gel matrix of exocellular polymeric substances, whereas those same components are compacted and distorted in the filtration cake. Furthermore, conditioning chemicals appeared in the cake as amorphous aggregated colloids and acicular particles which do not form inside the colonies. A chemical mapping was obtained by determining and integrating FTIR bands characteristics of specific components of the cake. Preliminary results showed that the amounts of resin can be used to assess the relative compacity at different levels of the cake.
KEYWORDS
Activated sludge; Filtration cake; Infrared Microspectroscopy; Transmission Electron Microscopy; Wastewater Treatment.
INTRODUCTION
Sludge dewatering is a crucial problem in biological wastewater treatment. Typically, the dry solids contents of an activated sludge is about 2-4 wt% and remains as low as 25-30 wt% after mechanical dewatering (La Heij et al., 1996). Any reduction in sludge water content would significantly decrease the costs associated with sludge transport and controlled dumping. The problem involved in sludge disposal is thus mainly related to the status of retained water.
Until recently, investigations of sludge dewatering have been mainly concerned with the efficiency of various physical or chemical dewatering processes (Katsiris et al., 1987; Lee et al., 1994), or with the influence of sludge characteristics on sludge dewaterability for given operating conditions (Karr et al., 1978;
Smollen, 1988). These approaches are black-box minded, and although many factors have been shown to influence sludge dewatering (Karr et al., 1978), the chemical and structural mechanisms governing water retention within a sludge are still poorly understood.
In the past decade, the use of new concepts such as fractal geometry (Li et al., 1989; Zartarian et al., 1997) or hydrophilic/hydrophobic balance (Urbain et al., 1993; Jorand et al., 1994), and new methods such as resin-embedding techniques associated with Transmission Electron Microscopy (Zartarian et al., 1994; He
et al., 1996), chemical extraction of sludge components (Frolund et al., 1996) or oligonucleotides probing of
bacterial activity (Wagner et al., 1993), have provided a better characterization of the inner morphology of activated sludge flocs and an insight to sludge dynamics. However, despite this improved understanding of biological flocs characteristics, some basic knowledge regarding floc behavior during other stages of the process is still lacking.
The aim of this work was to better understand the evolution of the floc structure along the wastewater treatment process. Resin-embedding followed by TEM examination has been shown to be particularly well-suited to study the spatial organization of activated sludge floc components (Zartarian et al., 1994; Jorand et
al., 1995). FTIR microspectroscopy is a promising technique for mapping the chemical distribution of
organic components (Clarisse et al., 1996). In this paper, we combine both techniques to investigate the morphological and chemical modifications obtained during press filtration of activated sludge.
METHODS
Samples collection. Samples were taken from the Golbey municipal wastewater treatment plant (Epinal
Vosges, France). The wastewater treatment process is a conventional activated sludge system with primary settling, and samples were collected at different stages of the process: mixed liquor from the aeration tank, ferric chloride and lime conditioned sludge, and sludge cake after filter pressing. Samples were transported to the laboratory and stabilized within 2 hours. A small box-core was used to cut off a 5 mm diameter core of the filtration cake, from which two slices (1 mm thick) corresponding to the middle and the edge of the cake were selected.
Resin embedding. Prior to embedding, each sample was fixed first with 1 ml of glutaraldehyde 2.5% for 16h,
and then with 2% osmium tetroxide for 1h, both reagents diluted in a 0.1 M sodium phosphate buffer (pH 7.2). Such fixative technique is recommended to preserve the samples in as much a lifelike state as possible (Ganczarczyk et al., 1992). The samples were then dehydrated in a graded acetone series (5 min at 10, 20, 40, 60%, 15 min at 80%, 2xl5 min at 95% and 3x20 min at 100%). Finally, the samples were transferred to mixtures of acetone-Epon 812 (Josddelville Technology) of increasing resin content, and then polymerized in moulds at 60°C for 12 hours.
Sectioning. Blocks of embedded samples were sectioned using an ultramicrotome and a diamond knife
(Reichert OM U2). To combine light microscopy, transmission electron microscopy and infrared techniques, successive sections of appropriate thickness were obtained. In practice, the first section (1 µm) was used for infrared microspectroscopy, whereas thin (2300 Å) and ultrathin (1000 Å) sections were cut for light and electron microscopy; a final 1 µm section completed the series.
Light microscope. Light microscopy was used as a prospective method to locate the different components of
the cake prior to infrared microspectroscopy. The 2300 Å sections were stained with toluidin blue which is known for its affinity towards organic matter. They were then placed between slide and coverglass, and observed at 100, 400 and 1000 x magnifications under a light microscope (Nachet NS 400). Interference contrast (Nomarski) was used to bring out a three dimensionnal appearance of relief and to delimit precisely the different structures of interest (resin, organic matter... ).
Infrared microspectroscopy and mapping. FTIR spectra were obtained with a Bruker IFS 55 Fourier
transform spectrometer equipped with a microscope (A 590) from 1 µm thick sections placed on a copper grid (200 mesh size). Chemical mapping was conducted by recording six sequences of 6 spectra scanned
800 times throughout the range 4000-600 cm-1 with a 12.5 µm beam aperture. The size of the mapping was defined by a beam displacement of 15 µm along the x- and y-axis. Quantitative estimation of the different constituents was obtained by integrating at each location a characteristic band of a given functional group identifying a particularcompound. Results were expressed in unit of absorbance and the influence of atmospheric water and carbon dioxide were subtracted. Interpolation between integrated bands was then carried out using Discrete Smooth Interpolation of the GOCAD software (Mallet, 1989) to provide a 3D representation of the chemical distribution of the compound.
Ultrastructural observations. The ultrathin sections were imaged in transmission mode (TEM) with a
Philips CM20 using a 80 kV acceleration voltage equipped with EDX analysis. The inner morphology and spatial distributions of floc constituents were amplified by staining the sections placed on copper grids with uranyl acetate and lead citrate (Reynolds, 1963). Exocellular polysaccharides were also specifically observed on sections placed on gold grid and stained with Thiery's silver proteinate reagent (Thiery, 1967).
RESULTS AND DISCUSSION
Infrared Microspectroscopy
Prior to infrared microspectroscopy, light microscope was used to examine the cake sections. Different components of the cake were identified such as isolated bacteria (<l µm), microcolonies (10-30 µm) and plant debris (50 to 200 µm) which were found to be more abundant at the edge than in the middle of the cake.
Probe determination. A probe can be defined as a band assigned to a functional group which is
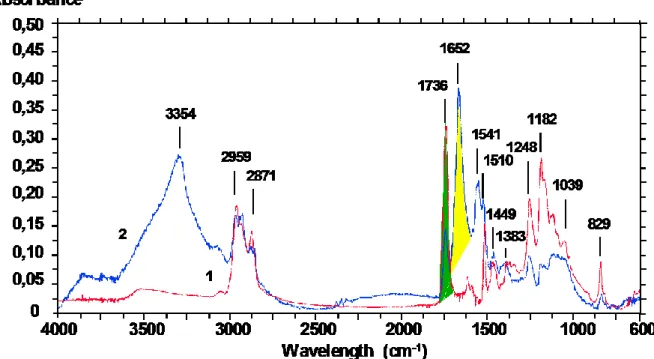
representative of the component investigated. In others words, this band does not superimpose to any other signal in this region. Figure 1 presents spectra obtained from sections of cake and pure resin, and illustrates the procedure of probe determination.
Figure 1. Transmission Infrared spectra of (1)resin and (2) organic matter obtained from 1µm section
Probes cannot be chosen in the regions of spectra showing comon bands. Therefore, regions ranging from 3000 to 2800 cm-1 (infrared signals from CH2 (2926 and 2853 cm-1) and CH3 (2959 and 2872 cm-1) streching frequencies) and from 1500 to 900 cm-1 (superimposition of the streching vibrations of C-O and
P-O (1039 cm-l)) should not be considered. Likewise, the bands observed between 3600 and 3000 cm-1 (streching vibration of OH and NH2) are too wide to be used as specific probes.
On the other hand, the sharp band at 1736 cm-1 assigned to the C=O streching vibration of an ester functional group can be retained as the specific probe of the resin. Indeed, although this band is common to both resin and cake spectra, it does not appear on transmission spectra of non-embedded cake. The same attention can be paid to the band at 1652 cm-1 (C=O streching vibration of secondary amides), which is chosen to represent the proteinic matter of the cake without knowing whether it belongs to bacteria, EPS or other organic components of the cake.
Thus, two probes, charasteristic of the resin and the protein matter, can be retained. The integrated area of these bands yields a quantitative estimate of the amount of each component at a particular location.
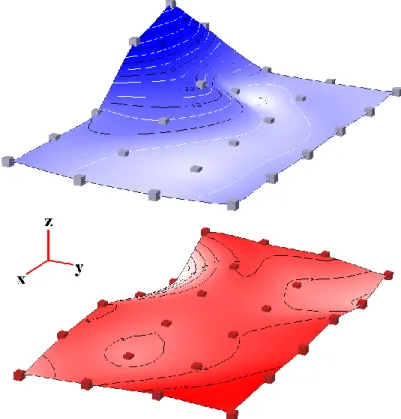
Infrared mapping. Figure 2 shows the chemical distributions of resin and proteinic matter obtained within a
75x75 µm2 square of the cake section, by integrating the two probes defined above. Each dot of both plots corresponds to one spectrum. The last two sequences of the y-measurement are not represented because of the interferences generated by the copper grid. Comparison of the two mappings shows that resin and protein distributions are approximately exclusive from each other. This indicates that resin impregnation of the cake is not homogeneous. Actually, it was observed that resin occupies mainly vacancies of the cake. The presence of a hump of proteinic matter in this region of the cake can be explained by light microscopy observations. Comparison with the photograph of the area observed from the twin section (figure 3) reveals that the protein-rich region corresponds to a microcolony of bacteria (12 µm size). Furthermore, the efficiency of Discrete Smooth Interpolation should be pointed out as the algorithm correctly determines the shape of the microcolony.
Figure 2. Chemical distribution of proteinic matter Figure 3. Photograph of a part of the cake (upper) 6.2<area<24.1 AbsorbanceUnits showing the microcolony mapped
and resin (lower) 2.4<area<3.2 AbsorbanceUnits
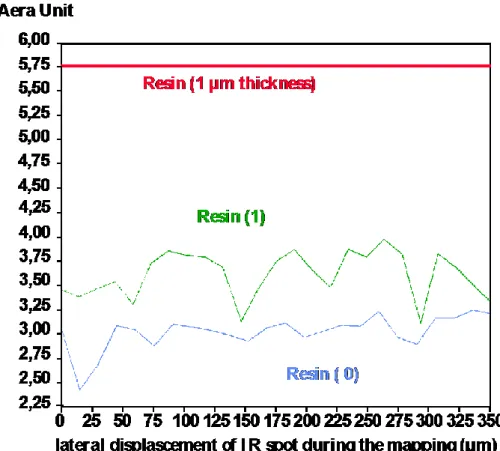
Cake compacity assessment . In the light of the previous results, it can be inferred that the amount of resin
can be used to trace the quantity of vacancies within the cake. Figure 4 shows the integrated area of the resin characteristic band at two different levels (edge and middle) of the cake and for a 1µm resin section. Obviously, the resin is more abundant in the middle of the cake than at the edge in contact with the filter. The cake is then more compact close to the filter. The same approach will be used to determine which
compounds migrate or accumulate within the cake and subsequently reduce mechanical dewatering by clogging the filter. However, the mapping size used here does not allow to observe such chemical differentiation as the size of the components is of the same order as the scale of heterogeneity. Therefore, a larger scale of investigation will be employed in further studies.
Figure 4. Comparison of resin distribution between the edge (0) and the middle (1) of the cake
Transmission Electron Microscopy
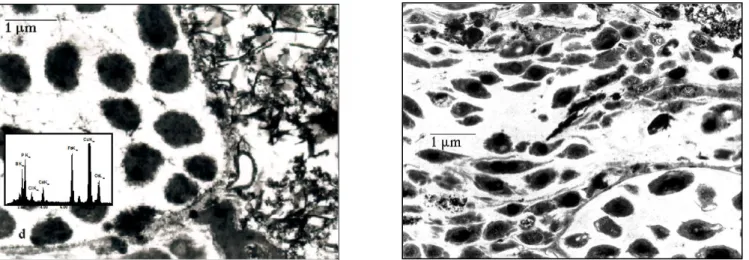
Microscopy of activated sludge and filtration cake - Figure 5a presents a transmission electron micrograph
of a section of activated sludge. As previously reported (Zartarian et al., 1995), the floc is mainly composed of bacteria colonies, isolated bacteria and exocellular polymers. The colonies size ranges from 5 to 30 microns, and depending on the colonies, the looseness of the exocellular matrix gel varies.
Transmission electron micrographs of the filtration cake reveal approximately the same components as in the activated sludge. However, compared to the situation in the biological sludge, both colonies and bacteria are tight and distorted (Fig. 5b) in the cake. Furthermore, numerous acicular particles can be observed as a darker fringe at the bottom of the micrograph.
Figure 5a - 5b. Transmission electron micrographs of (a) biological waste water and (b) cake of filtration sections (0.1 µm)
EDX analyses (Fig 5c) showed that iron, calcium, silicium, and phosphorus are associated with these particles, which may then be regarded as the footprint of chemical conditionners. It can also be observed from figure 5c that those acicular particles do not form inside colonies. Examination of transmission electron micrographs of the conditioned sludge revealed that these "needles" are usually associated with floc edges. This suggests that the dark fringe could correspond to a remnant of a floc edge. Overall, the cake appears much more compact than the activated sludge; shear patterns can also frequently be recognized in the microphotographs of the cake, and are usually characterized by sheared bacteria flowing around colonies (Fig. 5d).
Figure 5c - 5d. Transmission electron mirographs of cake sections (0.1 µm)
Close examination of flowing bacteria reveals that they all look similar which then suggests that they may originate from the same colony. Comparison of the distance distribution of bacteria within activated sludge flocs and filtration cake could then allow the estimation of the magnitude of stresses within the cake.
CONCLUSIONS AND PERSPECTIVES
Multiple microscopic investigations yield a proper description of activated sludge flocs and filtration cake morpho-chemistry. Light microscopy and Transmission Electron microscopy examine the nature and internal structure of samples at different magnifications, whereas infrared microspectroscopy provides useful information on the chemical distribution of components. Such correlative approach has led to the development of powerful tools to tackle difficult problems such as mechanical dewatering.
However, further work is still required to fully explore the potential of these techniques. Probes characterizing chemical conditioners will be determined in order to follow the status of both Fe and Ca within the filtration cake. Furthermore, chemical mapping should be carried out at a scale much larger than the size of cake components, in order to detect any possible migration of specific compounds. Finally, the shear distribution within the filtration cake will be estimated by combining the observation of oriented TEM slices and by calculating the aspect ratio of distorted bacteria .
ACKNOWLEDGEMENT
Financial support provided by Lyonnaise des Eaux is gratefully acknowledged. The authors also sincerely thank C. Mustin and D. Malecot for the realization of 3D plots with the GOCAD software. Thanks are also due to O. Barres for technical assistance with Infrared Microspectroscopy.
Clarisse C., Ferrieu F., Assous M., Weil D., Zachman G. (1996) Automated Infrared Microscopy as analytical tool in a lithographic silylation process of resists. Bruker Report 143/96.
Frolund B., Palmgren R., Keiding K., Nielsen P.H. (1996) Extraction of extracellular polymers from activated sludge using a cation exchange resin.Wat. Res. 30, 1749-1758.
Ganczarczyk J., Zahid W.M., Li D.H. (1992) Physical stabilization and embedding of microbial aggregates for light microscopy studies. Wat. Res. 26, 1695-1699.
He Q.H., Leppard G.G., Paige C.R., Snodgrass W.J. (1996) Transmission electron microscopy of a phosphate effect on the colloid structure of iron hydroxide. Wat. Res. 30, 1345-1352
Jorand F., Guicherd P., Urbain V., Manem J., Block J.C. (1994) Hydrophobicity of activated sludge flocs and laboratory-grown bacteria. Wat. Sci.Tech. 30, N°11, 211-218.
Jorand F., Zartarian F., Thomas F., Block J.C., Bottero J.Y., Villemin G., Urbain V., Manem J. (1995) Chemical and structural (2D) linkage between bacteria within activated sludge flocs. Wat. Res. 29, 639-647.
Karr P.R., Keinath T.M. (1978) Influence of particle size on sludge dewaterability. J. Wat. Pollut. Control
Fed. 50, 1911-1930.
Katsiris N., Kouzelli-Katsiri A. (1987) Bound water content of biological sludges in relation to filtration and dewatering. Wat. Res. 21, 1319-1327.
La Heij E.J., Kerkhof P.J.A.M., Herwijn A.J.M., Coumans W.J. (1996) Fundamental aspects of sludge filtration and expression. Wat. Res. 30, 697-703.
Lee D.J., Hsu Y.H. (1994) Fast freeze/Thaw treatment on excess activated sludges: floc structure and sludge dewaterability. Environ. Sci. Technol. 28, 1444-1449.
Li D.H., Ganczarczyk J.J. (1989) Fractal geometry of particle aggregates generated in water and wastewater treatment processes. Environ. Sci. Technol. 23, 1385-1389.
Mallet J.L. (1989) Discrete Smooth Interpolation. Ass. Computer Machinery, Transaction Graphics 8, 121-144.
Reynolds E. (1963) The use of lead citrate at high pH as an electron opaque stain in electron microscopy. J.
Cell Biol. 17, 176-191.
Smollen M. (1988) Moisture retention characteristics and volume reduction of municipal sludges. Wat. S.A.
14, 1-10.
Thiery J.P. (1967) Mise en évidence des polysaccharides sur coupe fine en microscopie électronique. J.
Microsc. 6, 987-1018.
Urbain V., Block J.C., Manem J. (1993) Bioflocculation in activated sludge: an analytic approach. Wat. Res.
27, 829-838.
Wagner M., Amann R., Lemmer H., Schleifer K. (1993) Probing activated sludge with oligonucleotides specific for proteobacteria: Inadequacy of culture dependent methods for describing microbial community structure. Appl.-Environ.-Microbiol. 29, 1520-1525.
Zartarian F., Mustin C., Bottero J.Y., Villemin G., Thomas F., Aillères L., Champenois M., Grulois P., Manem J. (1994) Spatial arrangements of the components of activated sludge flocs. Wat. Sci. Tech.
30, N° 11, 243-250.
Zartarian F., Mustin C., Villemin G., Ait-Ettager T., Thill A., Bottero J.Y., Mallet J.L., Snidaro D. (1997) Three-Dimensional Modeling of an activated sludge floc. Langmuir 13, 35-40.