HAL Id: halshs-00607207
https://halshs.archives-ouvertes.fr/halshs-00607207
Preprint submitted on 8 Jul 2011
HAL is a multi-disciplinary open access archive for the deposit and dissemination of sci-entific research documents, whether they are pub-lished or not. The documents may come from
L’archive ouverte pluridisciplinaire HAL, est destinée au dépôt et à la diffusion de documents scientifiques de niveau recherche, publiés ou non, émanant des établissements d’enseignement et de
Transportation Infrastructure and Development in
Ghana
Rémi Jedwab, Alexandre Moradi
To cite this version:
Rémi Jedwab, Alexandre Moradi. Transportation Infrastructure and Development in Ghana. 2011. �halshs-00607207�
WORKING PAPER N° 2011 – 24
Transportation Infrastructure and Development
in Ghana
Rémi Jedwab Alexandre Moradi
JEL Codes: F10, N70, N90, O18, O55
Keywords: Railroads, Trade Costs, Urbanization, Africa
P
ARIS-
JOURDANS
CIENCESE
CONOMIQUES 48, BD JOURDAN – E.N.S. – 75014 PARISTÉL. : 33(0) 1 43 13 63 00 – FAX : 33 (0) 1 43 13 63 10
Transportation Infrastructure and Development
in Ghana
∗
R´
emi Jedwab
PSE and LSE
Alexander Moradi
Sussex University
June 2011
Abstract
We study the impact of transportation infrastructure on agriculture and development in colonial Ghana. Two railway lines were built between 1901 and 1923 to connect the coast to mining areas and the large hinterland city of Kumasi. This unintendedly opened vast expanses of tropical forest to cocoa cultivation, allowing Ghana to become the world’s largest producer. This attracted migrants to producing areas and the economic surplus drove urbanization. Using data at a very fine spatial level, we find a strong effect of railroad connectivity on cocoa production due to reduced transportation costs. We then show that the economic boom in cocoa-producing areas was associated with demographic growth and urbanization. We find no spurious effect from lines that were not built yet, and lines that were planned but never built. We show that our results are robust to considering nearest neighbor estimators. Lastly, railway construction has durably transformed the economic geography of Ghana, as railway districts are more developed today, despite thirty years of marked decline in rail transportation.
JEL classification codes: F10, N70, N90, O18, O55. Keywords: Railroads, Trade Costs, Urbanization, Africa.
∗Remi Jedwab, Paris School of Economics (e-mail: [email protected]) and STICERD,
Lon-don School of Economics (e-mail: [email protected]). Alexander Moradi, University of Sussex (email: [email protected]). We would like to thank Denis Cogneau, Gareth Austin, James Fenske, and seminar audiences at Geneva (African Economic History Workshop), Sussex Univer-sity and LSE for very helpful comments. We are grateful to Vincent Anchirinah, Francis Baah and Frederick Amon-Armah from CRIG for their help with data collection, and PSE for funding the data collection.
1
Introduction
Recent research has confirmed that trade have large positive effects on income (Acemoglu, Johnson, and Robinson 2005; Feyrer 2009; Donaldson 2010). Similarly, research has suggested that the lack of intercontinental and intracontinental trade integration is a determining factor of African underdevelopment (Rodrik 1998; Johnson, Ostry, and Subramanian 2007; Buys, Deichmann, and Wheeler 2010). In this regard, the literature often mentions the conjunction of bad geography and poor infrastructure as the main obstacle to trade expansion in Africa (Radelet
and Sachs 1998; Lim˜ao and Venables 2001; Buys, Deichmann, and Wheeler 2010).
In 2005, Sub-Saharan Africa had 0.002 km of railroad track per 1000 sq km and Ghana had 4.2 km, while China had 6.5 km, India 21.3 km, the United States 24.8 km and Europe 50.5 km per 1000 sq km (World Bank 2010). Turning to roads now, Sub-Saharan Africa had 85 km of roads per 1000 sq km and Ghana had 239 km, while China had 200.6 km, India 1115.4 km, the United States 702.2 km and
European countries 1377.0 km per 1000 sq km.1 Clearly, African countries are
underprovided with transport infrastructure and that is why international organi-zations are advocating massive investments in Africa. The Trans-Highway network is a set of transcontinental road projects being promoted by the United Nations Economic Commission for Africa, the African Development Bank and the African Union to develop road-based trade corridors in Africa (African Development Bank 2003). The African Union is also working out modalities on how to link all railways in the continent (African Union 2006). Lastly, Ghana, the country we study in this paper, has just signed a $6 billion contract to rehabilitate the existing network and build a railroad to the country’s northern border (Bloomberg 2010). This will make it the largest rail investment in Africa since at least 50 years.
Despite this recent interest in transportation projects, little is known on their economic effects and more research is needed. A first strand of the literature looks at the macroeconomic impact of transport infrastructure on trade and
de-velopment (Radelet and Sachs 1998; Lim˜ao and Venables 2001; Clark, Dollar, and
Micco 2004; Calderon and Serven 2008). Those studies find that better
infrastruc-1Magnitudes are similar if the lengths of the rail and road networks are standardized by
ture diminish transport costs, especially for landlocked countries, with a positive impact on exports and economic growth. As infrastructure is endogenous to eco-nomic conditions, one cannot be sure such effects are causal. A second strand of the literature has focused on the impact of rural roads on neighboring com-munities (Jacoby 2000; Renkow, Hallstrom, and Karanja 2004; Mu and van de Walle 2007; Dercon, Gilligan, Hoddinott, and Woldehan 2008; Jacoby and Minten 2009). Those studies find that rural roads reduce poverty in connected villages, by integrating labor and goods markets, thus providing new economic opportu-nities to their inhabitants. For instance, farmers obtain higher profits thanks to cheaper agricultural inputs and higher farmgate prices for their crops. Yet, this literature also faces identification issues. A last strand studies the impact of large transportation projects, whether highways (Akee 2006; Michaels 2008) or railroads (Banerjee, Duflo, and Qian 2009; Atack and Margo 2009; Atack, Bateman, Haines, and Margo 2010; Donaldson 2010; Burgess and Donaldson 2010). They show there are significant gains from market integration for connected areas.2
We investigate this issue by looking at the impact of transportation infrastruc-ture projects on agriculinfrastruc-ture and development in colonial Ghana (1901-1931). We study the impact of two railway lines that were built between 1901 and 1923 on the production and export of cocoa beans and development, which we capture by looking at population growth and urbanization. The first line was built between 1901 and 1903 to connect the port of Sekondi to gold mines and the hinterland city of Kumasi. The second line was built between 1908 and 1923 to connect the port and capital city of Accra to Kumasi. The construction of those railway lines unintendedly opened vast expanses of tropical forest to cocoa cultivation, allowing Ghana to become the largest exporter of cocoa beans for most of the 20th cen-tury. This attracted migrants to producing areas and the economic surplus drove urbanization. Using data at a very fine spatial level, we find a strong effect of railroad connectivity on cocoa production. We explain that modern transporta-tion infrastructure has considerably reduced transportatransporta-tion costs, as cocoa was
2Those studies also face identification issues, but the placement is more ”instrumentable”.
Michaels (2008); Banerjee, Duflo, and Qian (2009); Atack, Bateman, Haines, and Margo (2010) use the fact that being on a straight line between two large cities makes it more likely to be connected to a highway or a railroad. Donaldson (2010) does not find any effect for railway lines that were approved but never built.
before head-loaded or rolled in casks over long distances. We then show that the economic boom in cocoa-producing areas is associated with demographic growth and urbanization. We find no spurious effect from lines that were not built yet, and lines that were planned but never built. We demonstrate that our results are robust to considering nearest neighbor estimators. We provide evidence for high cocoa incomes, high migration rates in producing areas and urban sectoral specializations in line with consumption linkages stemming from the rising wealth of those areas. Lastly, we examine the long-term effects of railway construction by showing that districts connected to the railway system are now more urbanized, have better infrastructure and larger manufacturing and service sectors, despite thirty years of marked decline in rail transportation.
This paper also contributes to the colonial rule literature. The existing studies relate economic outcomes today to the duration of colonization (Bertocchi and Canova 2002; Feyrer and Sacerdote 2009), the identity of the colonizer (Bertocchi and Canova 2002; Acemoglu and Johnson 2005), and the form of colonization (extraction versus settlement: Acemoglu, Johnson, and Robinson 2001, 2002 ; direct versus indirect rule: Mizuno and Okazawa 2009; Iyer 2010). While there is strong evidence that colonization has shaped institutions (Acemoglu, Johnson, and Robinson 2001; Acemoglu and Johnson 2005), less is known on investments
realized by the colonizer (Huillery 2009; Chaves, Engerman, and Robinson 2010).3
Another issue is whether colonization had a different impact on groups pertaining to a same country and whether this had long-term economic consequences on inequality (Moradi 2008; Huillery 2009, 2011). In our context, the colonizer has invested in modern transportation infrastructure in Southern Ghana, with long-term benefits still visible today. Thus, colonization might have helped solving coordination problems in public good provision.
Our focus on cities also connects with the urbanization literature. Most struc-tural transformation models consider a closed economy where a relative rise in agricultural productivity releases labor for the modern sector (Gollin, Parente, and Rogerson 2002; Michaels, Rauch, and Redding 2008). Yet, in a small open
3Chaves, Engerman, and Robinson (2010) also study the economic impact of railways in
Ghana, but they adopt the social savings approach introduced by Fogel (1964), and only find modest net benefits of the railways.
economy, a rise in agricultural productivity shifts the country’s comparative ad-vantage towards agriculture and its employment share increases (Matsuyama 1992, 2009). When this rise occurs for cash crops, this causes urban growth through con-sumption linkages (Jedwab 2011). Then, a few studies argue that Africa has ur-banized without it being fully explained by economic development (Bairoch 1988; Fay and Opal 2000). This excessive urbanization is attributed to pull and push factors feeding rural exodus. First, cities are associated with a parasital public sector (Bates 1981; Bairoch 1988). Second, rural shocks encourage rural exodus (Barrios, Bertinelli, and Strobl 2006; Poelhekke 2010). Our study shows that eco-nomic growth was a powerful driver of urbanization in Africa, and that structural transformation can happen through a natural resource boom.
The paper is organized as follows. The next section presents the historical background of railway construction, cocoa and cities in Ghana and the data used. In section 3, we describe the conceptual framework. Section 4 explains the empiri-cal strategy, while section 5 displays the results and explores the channels. Section 6 investigates the long-term effects of railways, and section 7 concludes.
2
Background and Data
We discuss some essential features of the Ghanaian colonial economy and the data we have collected to analyze how railway construction has contributed to booming cocoa production, population growth and urbanization. Appendix A contains more details on how we construct the data.
2.1
The Railway Age in 1901-1931
In order to analyze the effect of railway construction on trade and development in Ghana, we have constructed a new data set on 2091 grid cells of 0.1x0.1 degrees in Ghana from 1901 to 1931. We choose a high resolution grid because we have very precise GIS data on railways, cocoa production, population and urbanization. We obtain the layout of railway lines in GIS from Digital Chart of the World. We then use various documents to recreate the history of railway construction. For each line, we know when it was started and finished, and when each station was reached and opened. From the same sources, we know lines that were built but
not planned. For each real or placebo line, we create cell dummies equal to one if the Euclidean distance of the grid cell centroid to the line is 0-20, 20-40, or 40-60 km. Our main analysis focuses on railway lines in 1918. We also create a dummy equal to one if the cell contains a railway station in 1918. We proceed similarly to construct a GIS database on roads and we create a cell dummy equal to one is the cell is crossed by a motor road.4
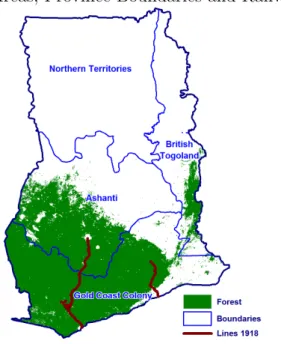
Till the construction of the first railway line in 1901, trade was constrained by very high transportation costs (Dickson 1968; Austin 2007; Chaves, Engerman, and Robinson 2010). Headloading was the main means of transporting goods, except for cocoa beans and palm oil which could be rolled in barrels along the few forest tracks. Beasts of burdern could not be used due to the tsetse fly, and British officials had to be carried slung in a hammock between two bearers (Gould 1960; Luntinen 1996). Owing to the thick primary forest in Southern Ghana (see fig. 1), there were only a few well-cleared tracks and villages along those paths were in charge with maintaining them. The first lorry was imported in 1903, but there were only two lorries in the colony in 1914 (Luntinen 1996).
There have been a few projects before the first railway line was actually built, but they were dropped due to a lack of political will and funds. This summary draws on Gould (1960) on Luntinen (1996) and figure 2 displays the projects mentioned as well as the grid we use in our analysis. The first proposal to build
a railway was made in 1873 to connect Cape Coast to Kumasi via Prasu.5 The
British wanted a line to send troops to fight with the Ashanti, and some railway material was landed at Cape Coast. As it was not possible to build the line in time for the military operation, the project was dropped. The next important project was the Saltpond-Oda-Kumasi line surveyed in 1893 with the aim of increasing trade (gold mining, palm oil and kernels, timber), ensuring military domination, and bringing civilization to the native people. The project was dropped as it was too expensive. A similar project considering Apam as the starting point was designed in 1898, but a competing project from Accra emerged in 1899. The Secretary of State for the Colonies, Joseph Chamberlain, was to arbitrate between
4There were two types of roads at that time: class II (roads suitable for motor traffic but
occasionally closed ) and class III (roads suitable for motor traffic in dry season only ).
5Cape Coast was the capital of the Gold Coast Colony till 1877 when it was moved to Accra.
the two projects and Accra was selected since it was the capital of the Colony. But the Accra-Oda-Kumasi project was suspended as it was first necessary to carry out the harbor works at Accra. To conclude, gold mining, military domination and the export of tropical products were the three main reasons why railway construction
appeared as unavoidable in colonial Ghana.6 The railway projects described above
were then dropped because of a lack of both funds and political will.
The first successful project was started in 1898 from Sekondi on the coast and reached the Gold mines of Tarkwa in 1901 and Obuasi in 1902. As Obuasi was not far from Kumasi, the line was further extended to the Ashanti capital in 1903. This railway was built by the Europeans for the Europeans, but it directly benefitted the Africans. An Eastern line was then started from Accra in 1908 but only reached Kumasi in 1923, due to wartime shortages. The line was then stopped at Tafo in 1918. As explained above, the original justifications for an Eastern line did not mention at all the cultivation of cocoa, but the opening of new areas to
cocoa cultivation became ex-post one objective of railway construction.7 Another
line was then built in 1927 with the aims of connecting the two lines, developing cocoa production and diamond production (around Kade). Yet, this line only went from Huni Valley to Kade and did not reach the eastern line before 1956.
The railways permitted a massive decrease in transportation costs. While the freight rate per ton mile was 30-60d for headloading, 23.0d for the cask rolling of cocoa beans and 20.0d for lorries (before 1914), it was only 11.3d for the rail. The railway charges then decreased even further, and were 7.5d, 6d, 4.5d and 3d for the first, second, third and fourth 50 miles in 1922 (Austin 2007). Considering that producer costs were 8s6d for one ton of cocoa beans and the opportunity wage for unskilled labor was 1s in 1930-31 (Cardinal 1931), we can estimate the maximal Euclidean distance to which cocoa cultivation is more profitable than other alternatives for different transportation technologies. If we use the Accra producer price per ton for that year (15.5s), this gives 23.5-31.3 km for headloading,
6Gold mining was a real motivation, not because of the total weight of gold to be transported,
but because gold mines needed machinery, firewood and workers from other regions.
7One could argue that cocoa production has caused railway construction. But railway
con-struction would have happened without any contemporary boom in cocoa production as the British around 1900 were more interested in the trade possibilities offered by palm oil and ker-nel, timber and rubber. Besides, cocoa cultivation could not have colonized the interior if it had remained dependent on headloading and cask rolling as argued later.
61.3 km for cask rolling, 124.8 km for rail before 1922 and 469.9 km for rail after 1922. Cocoa cultivation would have then be limited to the coast without modern transportation infrastructure. The Accra price was almost three times higher a few years before in 1926-27 (43s), and the maximal distance for cask rolling was then 523.1 km. High transportation costs were an issue only in low price years. But our theoretical distance is an upper bound as we consider the Euclidean distance and we do not include transaction costs not related to transportation: fees of cocoa brokers, losses due to thief or rotting during transportation, etc. Indeed, no data could be found for those costs.8 In just a few years, the share of cocoa transported
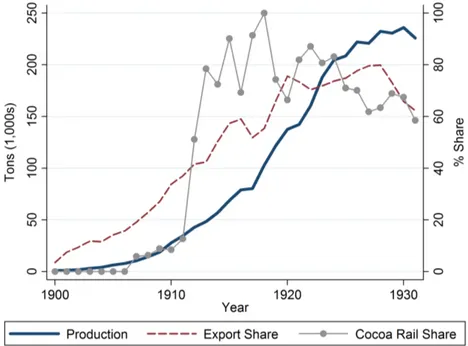
by rail increased to around 80% (see fig. 3). According to Luntinen (1996) (p.107) ”The very existence of the transport network encouraged the production of surplus for the market. It was cocoa that made the Gold Coast the richest colony in Africa. The farmers seized the opportunity as soon as the railway reached them, so eagerly that foodstuffs had to be imported.” The main effect of railway connectivity was thus to make profitable cocoa cultivation in areas where it was not.9
Roads were first complementary to the railway system as they were feeders to the railway. Roads were of poor quality till 1924, when the government started the Tarmet Program which allowed roads to be suitable to motor traffic throughout the year (Gould 1960). The transportation rate per ton mile decreased to 7d in the late 1920s and roads became serious competitors for the railway. Roads also opened new areas to cocoa cultivation. As a result, the share of cocoa transported by rail decreased from around 80% to 60% after 1924 (see fig.3). Thus, even if no railway had been built, roads would have permitted the cocoa boom. But our goal is not to compare the respective impacts of railways and roads. We focus on the railway age in 1901-1931 because it provides us with a natural experiment which we use to identify the effect of reduced transportation costs on development.
8Rail distance from Kumasi to Sekondi is 273.1 km, while it is 285.5 km from Kumasi to
Accra. Using 3d as the freight rate per ton mile for rail, this meant that farmers in Kumasi received 3.4-3.6d less per ton that farmers close to Sekondi or Accra. Using price data at the grid cell level for 1931-1936, we find that farmers around Kumasi were indeed receiving 3.5d less per ton that farmers around Accra.
9Although gold mining was the main original reason for railway construction, the railway lines
were mostly transporting manganese ore (52.3% of the total weight of goods being transported), cocoa beans (17.5%) and firewood (12.7%). Coal, gins and spirits, imported food staples, native produce, machinery and exported timber only accounted for 5.4% altogether.
2.2
The Cash Crop Revolution in Ghana
Cocoa has been the main motor of Ghana’s economic development (Teal 2002; Austin 2008), and this made it a leader of the African ”cash crop revolution” (Tosh 1980). Yet, as cocoa is produced by consuming the forest, this success has been a major factor of deforestation in Ghana. Cocoa farmers go to a patch of virgin forest and replace forest trees with cocoa trees. Pod production starts after 5 years, peaks after 10 years, and declines thereafter. When cocoa trees are too old, which happens after 25 years, cocoa farmers start a new cycle in a new forest
(Jedwab 2011).10 The fact that production starts after 5 years also means that
the Tafo-Kumasi line built in 1923 and Huni Valley-Kade line built in 1927 were unlikely to have any impact on cocoa production in 1927 and urbanization in 1931 (see fig. 2). We use those lines as a placebo check of our identification strategy.
Cocoa was introduced by missionaries in 1859, but it took 30 years before cocoa was widely grown, making Ghana the world’s largest exporter as soon as 1911. Figure 3 shows aggregate cocoa production and the export share of cocoa from 1900 to 1931. Figure 4 shows grid cells that are suitable to cocoa cultivation and cocoa production in 1927. The data on land suitability was recreated from a map of cocoa soils in Ghana. A cell is defined as suitable if it contains cocoa soils. It is then highly suitable if more than 50% of its area consists of forest ochrosols, the best soils for cocoa cultivation, and poorly suitable if more than 50% of its area consists of forest oxysols, which are very poor cocoa soils. Production data was collected from a historical map and we then use GIS to calculate the amount of cocoa production (tons) for each cell in 1927. Since production was almost nil around 1900, production in 1927 represents the change over the period. We also have at our disposal producer price data in 1931-36 for 173 cells. We then use this data in GIS to spatially extrapolate the producer price for the 260 producing cells
in our sample.11 We then multiply cocoa production in volume by the producer
price to obtain the cell value of cocoa production. As already explained in the
10Removing forest trees alters the original environmental conditions and replanted cocoa trees
die or are much less productive (Ruf 1995).
11Spatial extrapolation was done by universal spatial kriking, which assumes a general linear
trend model. We alternatively use a second order trend and a third order trend. We also use inverse distance weight interpolation.
previous section, farmers around Kumasi faced a much lower farmgate price and made lower profits per ton due to higher transportation costs.
Cocoa production originally spread out in the Eastern province from Aburi Botanical Gardens, where the British sold cocoa seedlings at a very low price (Hill
1963, p.173-176).12 As Ghanaian farmers realized how much profit they could
make out of cocoa, more and more people specialized in the crop. The Accra-Tafo railway line was instrumental in opening new land to cocoa cultivation. Production also boomed around Kumasi when the railway line was opened in 1904. Why did production boom in Ashanti and not in the South-West, around Sekondi? Transportation costs were certainly lower there as it was closer to the coast. But the South-West of Ghana is characterized by very poor cocoa soils and too much
rainfall.13 The railway line to Kumasi thus made the Ashanti more competitive
than the South-West for the development of cocoa cultivation.
2.3
Demographic and Urban Growths in Colonial Ghana
Ghana has experienced dramatic population growth after 1901, due to rising liv-ings of standard, international migrations and large-scale health campaigns orga-nized by the British colonizer. Its population increased from 1,948,000 in 1901 to 2,191,000 in 1911, 2,543,000 in 1921 and 3,164,000 in 1931 (Austin 2008). 31.9% of this growth took place in the Gold Coast Colony, 10.6% in Ashanti, 21.6% in Northern Territories and 9.0% in British Togoland (see fig. 1). Then, while Ghana was almost unurbanized at the turn of the 20th century, it is now one of the most urbanized countries in Africa. Its urbanization rate is estimated at 51.6% in 2010 while it is 37.2% for Sub-Saharan Africa (United Nations 2009). It has also started its urban transition earlier than most African countries, due to the boom in co-coa exports (Jedwab 2011). Defining as urban any locality with more than 5,000 inhabitants, Ghana’s urbanization rate increased from 5.0% in 1901 to 7.7% in 1931. But it moved from 22.4% in 1901 to 29.6% in 1931 if we define as urban any locality with more than 1,000 inhabitants. Our period of study thus only captures
12The British established the Government Botanical Gardens in Aburi in 1890, because of its
health climate and its proximity to the capital city, Accra.
13Most of the South-West area consists of oxysols or intergrades, which are poor cocoa soils.
The lack of soil minerals leads to low yields and premature tree aging. Annual rainfall often exceeds 2,000mm, with a dry season that is very wet, which favors cocoa diseases.
the beginning of the urban transition in Ghana.
To obtain such urbanization figures, we construct a GIS database of localities with more than 1,000 inhabitants using census gazetteers. We have data for 1901 and 1931. Using the 1,000 threshold, Ghana had respectively 127 and 428 cities in 1901 and 1931 (see figure 5, which displays cities in 1901 and 1931). Since our analysis is at the grid cell level, we use GIS to recreate urban population for each cell-year observation. The two largest cities were then Accra, the national capital, and Kumasi, the hinterland capital. Altogether, they have accounted for 9.5% of total urban growth in 1901-1931. 41.4% of it has come from the Gold Coast Colony, 21.5% from the Ashanti, 24% from Northern Territories and 3.6% from British Togoland (see fig.1 which displays provincial boundaries). Thus, around 66.5% of urban growth has come from areas suitable to cocoa cultivation. Before the 20th century, towns were state capitals or trading centres (see Dickson 1968, p.70-71). Most of the latter were on the coast, where European merchants would meet local merchants from the interior. But there were also trading centres in the North, which benefitted from their location on the historical trade routes. In the early 20th century, most of urban growth took place in the forest zone, with the development of mining, modern transportation and cocoa production (see Dickson 1968, p.246-261). In particular, many towns grew because they were cocoa buying centres, the homes of wealthy cocoa farmers or market towns where cocoa farmers would spend their income. This correlation between railway lines, cocoa cultivation and urbanization is confirmed by the comparison of figures 4 and 5.
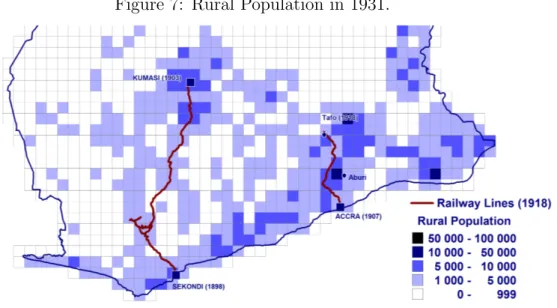
While we have exhaustive urbanization data for all the country, we only have consistent population data for the South of Ghana. The 1901 census was exhaus-tively conducted and geospatialized only in the Gold Coast Colony, part of Ashanti and part of British Togoland. We then have population data at a very fine spatial level from the 1931 census. We thus have population for each Southern cell (756 cells), and we reconstruct rural population by subtracting urban population from total population. Figures 6 and 7 display rural population in 1901 and 1931 for Southern cells. They suggest that rural population also increased in areas which experienced urban growth, probably due to booming cocoa production. Austin (2008) describes how the labor-land ratio increased as a result of migration re-lated to cocoa and how some areas in the forest zone were already approaching
the ”critical population density” for foodcrop-growing (p.8-14).
3
Conceptual Framework
This section describes the conceptual framework of our story, which involves trans-portation networks, trade specialization and development. It draws from Jedwab (2011), except it includes the impact of transportation costs and dissociate con-nected areas from non-concon-nected areas. Assume a country is divided into grid cells and there are no transportation networks. Each cell lives in autarky, and agricul-tural productivity is such that everyone lives at the subsistence level. Besides, half of those cells are a tropical forest where human settlement is limited given disease conditions. Cash crops could be produced there but there are no means of transportation to permit their export.
For some exogenous reasons, some of those cells are directly connected to the rest of the world (the coast) via a new transportation network. Those cells ex-perience a major decrease in the transportation costs they face to export their products (and import other products). Their comparative advantage in producing cash crops can now be exploited and they export them against food and non-food imports. Non-connected cells remain in autarky and close to the subsistence level. We abstract from the food constraint issue by simply assuming that cash crop farmers also grow their own food.14 Therefore, being a cash crop farmer gives each
farmer their food subsistence requirement and a surplus which they can spend on other goods and services. Given the Engel curve, it is likely that expenditure on urban goods and services disproportionately increases as cash crop produc-tion booms. Especially, they trade cocoa beans for imported manufactured goods
and/or imported food which serves to pay workers in the service sector.15 This
sector expands, which drives urbanization if the production and consumption of services take place in city. People become industrious and increased consumption contributes to urbanization, which we take as a development outcome.
On the supply side of labor, better living conditions in forested areas compared
14This assumption is realistic considering that cocoa farmers always have an independent plot
where they grow starchy roots and tubers and plantain for their own food consumption.
to non-forested areas whether the North of the country or surrounding countries
incite people to migrate from the latter to the former.16 Thus, a part of the
migrants will become cash crop farmers in the countryside, while the other part will
be workers in the urban sector.17 In the end, transportation networks contribute
to develop connected areas through trade specialization and labor mobility.18
4
Empirical Strategy
Having data on railway connectivity, cocoa production and population growths at the grid cell level in 1901 and 1931, we test if connected cells experience a boom in cocoa production and whether this drives demographic growth and urbanization. We explain the strategies we implement to ensure our effects are causal.
4.1
Main Econometric Specification
The main hypothesis we test is whether railway connectivity drives cash crop production which then drives demographic and urban growths, focusing on 1901-1931 Ghana. We first run the following model for cells c:
4Cocoac,1927 = α + βRailc,1918+ θU rbanc,1901 + uc (1)
where our dependent variable is cocoa production (tons) of cell c in 1927. Given aggregate production was almost nil in 1901, we study the change in cocoa produc-tion. Our variables of interest Railc,1918 are cell dummies which capture railway
connectivity: for being 0-20, 20-40 and 40-60 km away from a railway line in 1918 and having a railway station in 1918. We use the railway network in 1918 as the
16We do not consider demographic growth here, just migration from non-producing to newly
producing areas. Including demographic growth could be an interesting extension.
17A natural prediction would be that the wage gap between forested and non-forested areas
closes as a result of labor mobility. If access to forest land is limited or migration costs are high, this might not be the case.
18The closest papers to our story are Atack and Margo (2009) and Atack, Bateman, Haines,
and Margo (2010). They do not have any proper theoretical framework, but their story also involves railroads, land colonization and urbanization. Atack and Margo (2009) describe the impact of new railroad lines on land colonization and agricultural specialization in 19th century American Midwest. Atack, Bateman, Haines, and Margo (2010) show the ultimate impact of those railroad lines was a large increase in population density and urbanization.
railway lines built later (1923 and 1927) were unlikely to affect cocoa production given it takes 5 years to start. We then run a second model for cells s:
4P opc,1931 = α0+ γRailc,1918 + θ0P opc,1901+ δCocoac,1927+ vc (2)
where our dependent variable is population of cell c in 1931, simultaneously con-trolling for cell population in 1901 (P opc,1901). We actually include just urban
population in 1901 and rural population in 1901, as we are then better able to control for initial conditions. We expect railway connectivity to have a positive and significant effect on cocoa production (β > 0), and population (γ > 0) when we do not include Cocoac,1927. Once we include Cocoac,1927, we expect it to
cap-ture the effect of railway connectivity (γ = 0, δ > 0). This means the effect of railway connectivity on population goes through more cocoa production. Railway connectivity might also have an independent effect on mining, other tropical prod-ucts and the trade of consumer goods, but this effect might not be significantly different from 0 once we control for cocoa. We can look at urban growth and rural growth to understand the nature of population growth.
We have a cross-section of 2091 cells. Our main analysis is performed on the restricted sample of suitable cells. We run the risk of just comparing the Southern and Northern parts of Ghana if we use the full sample. We then drop observations that are a node of the railway lines: Accra, Kumasi and Sekondi. Our urban analysis is therefore focused on non-national cities. We also restrict our sample to those cells for which we have data on the cell population distribution in 1901 as this data is only available for a set of Southern cells that year (see fig. 1).19 We end up with 611 observations and we believe such restriction gives us very conservative estimates. We will show later that our results are robust to removing such restrictions. We privilege OLS regressions and the issue is whether railway construction was endogenous to cocoa production and demographic and urban growths. We argue in section 2.1 that both the Western and Eastern lines were not planned with having cocoa cultivation or urbanization in mind. We now describe the tests we perform to ensure these effects are causal.
19As explained in data appendix A, localities with less than 1,000 inhabitants were exhaustively
4.2
Controls
We include controls at the cell level to account for potentially contaminating fac-tors. First, we control for demography in 1901, by including urban population, rural populations, and the number of large towns, towns (> 500 inhabitants), head-chief towns, large villages (100 − 500 inhabitants) and villages (< 100 inhabitants). Second, we control for economic geography by having Euclidean distances (km) to Accra, Kumasi, Aburi and the coast and dummies for bordering another country or the sea.20 Third, we add physical geography variables such as the shares of soils
which are ochrosol class 1, class 2, class 3 and unsuitable, oxysols or intergrades to directly control of land suitability to cocoa cultivation, or the mean and standard deviation of altitude (m) and average annual rainfall (mm) in 1900-1960. Lastly,
we have a dummy equal to one if the cell has a mine.21
4.3
Placebo Regressions
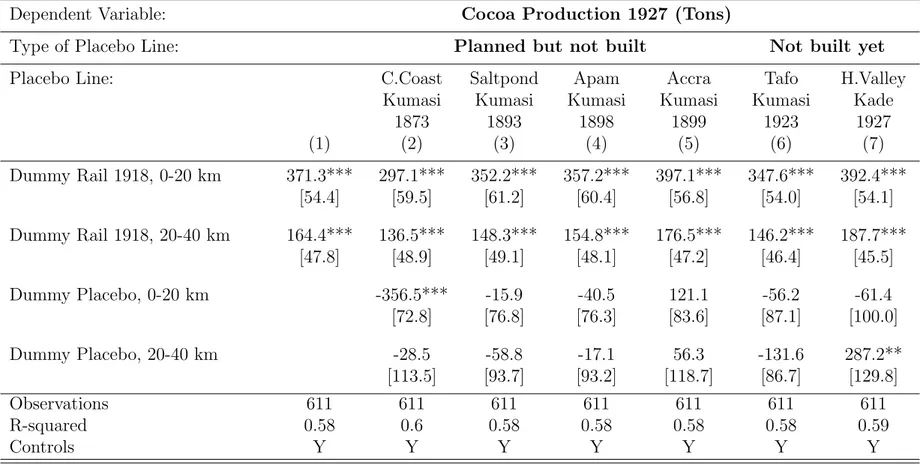
As explained in section 2.1 and shown in figure 2, four major railway lines were planned but never built: Cape Coast-Prasu-Kumasi (1873), Saltpond-Oda-kumasi (1893), Apam-Oda-Kumasi (1898) and Accra-Oda-Kumasi (1899). Two lines were then built after 1918: Tafo-Kumasi (1923) and Huni Valley-Kade (1927). The expansion of cocoa cultivation was mentioned as one of the objectives of the two latter lines, but they were unlikely to have any impact on cocoa production in 1927 and urbanization in 1931 given production takes 5 years to start. For each planned but not built or not built yet line, we create a placebo treatment dummy equal to one if the cell is more than X km from the 1918 lines (not connected) but less than X km from the placebo line (counterfactually connected). We expect no effect on both cocoa production and demographic growth for cells that would have gained access if the placebo had additionally been built before 1918.22
20Those dummies also capture the fact that border cells are by construction not entirely
contained in the territory of Ghana.
21There were five mines in 1931: three gold mines, one diamond field and one manganese mine.
Mineral exports amounted to 24.2% of exports in 1930 and the number of Africans engaged in mining was 12,048. Cocoa and mineral products thus accounted for 94.5% of exports in 1930.
22We cannot directly test if being less than X km from a placebo line has any counterfactual
effect as a large number of placebo cells are currently connected to the 1918 railway lines. We can only perform a counterfactual analysis for potentially newly connected cells.
4.4
Nearest Neighbor Estimators
We can compare connected cells to non-connected cells, or connected cells to cells that would have been connected if the placebo lines had been built before 1918. This guarantees that treatment and control cells are similar in terms of both observables and inobservables, in the spirit of nearest neighbor estimators. The only difference between the two just comes from the fact that connected cells were effectively treated. We can alternatively consider cells counterfactually connected to planned but not built lines or lines that were not built yet in 1918 or both. The lines that were planned but not built mostly followed historical trade routes and had more population in 1901 along their potential layout, as indicated by the comparison of figures 2 and 6. We then regress each available control on a dummy equal to one if the cell is than 20 km from a 1918 railway line. We alternatively consider as a control group all the suitable cells (see col. (1) of table 1), placebo
cells (see col. (2)) and placebo cells using Cape Coast-Kumasi only (see col.
(3)). Placebo cells are similarly defined as cells that are less than 20 km from a placebo line. Treated cells have a larger rural population, lower cocoa soil quality (less ochrosols) and are closer to large cities and the coast than control cells (see col.(1)). Yet, they are farther from large cities and the coast if we compare them to placebo cells (see col.(2)) and do not have a large population if we compare them to placebo cells along the Cape Coast-Kumasi line (see col.(3)). We will thus test various sets of placebo lines to see if differences in observables really matter.
5
Results
In this section, we display the main results, examine their robustness and investi-gate the mechanisms behind the potential effect of railway connectivity on cocoa production, and the effect of cocoa production on urban growth.
5.1
Main Results
Table 2 contains our main results for cocoa production and population growth. Column 1 reports the results for regression (1), while columns (2)-(5) display the results for regression (2). All regressions include controls, but unconditional results
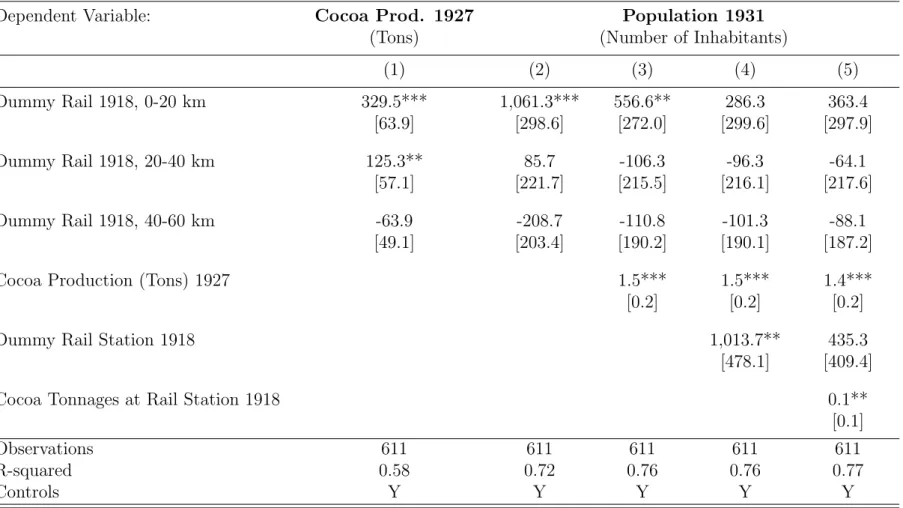
are discussed in table 7. We find a strong effect of railway connectivity on cocoa production, but this effect decreases as we move further away from the line and is nil after 40 km (see col. (1)). There is then a strong effect of railway connectivity on population growth but only for those cells less than 20 km away from the line (see col. (2)). This indicates that people tend to live in the vicinity of the line, although there is some production beyond 20 km. Interestingly, the rail effect is lower when we include cocoa production, which then has a strong effect on population growth (see col. (3)). This means the railway lines have a strong effect on population growth, and that this growth is coming from opportunities in the cocoa sector, and other sectors if there are intersectoral linkages. The remaining rail effect is then picked up by the cell dummy for having a railway station in 1918 (see col. (4)). But the latter effect also becomes lower and non-significant when we include the amount brought to the station in 1923 (see col. (5)). Railway connectivity has thus a strong effect on population growth, but this effect goes
through more cocoa production.23
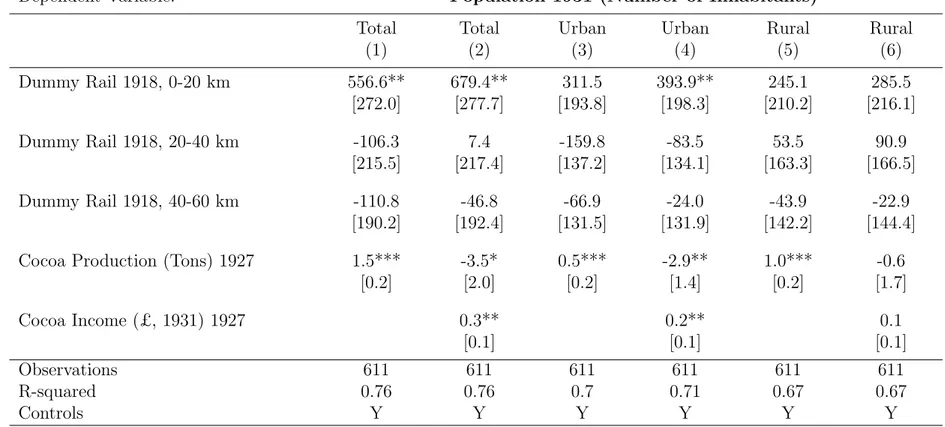
Table 3 displays the results for urban growth, which is population growth in localities with more than 1,000 inhabitants. The effects are more or less half those for population growth, which means that the effects are not significantly different if we consider rural growth. Indeed, we obtain the estimates for rural growth by subtracting the urban effect (table 3) from the total population effect (table 2).24
This implies that railway connectivity, by permitting cocoa cultivation, attracts people to work in the countryside, where cocoa cultivation takes place, but also people to work in the cities. Column (3) of tables 2 and 3 shows that the effect of cocoa production on demographic growth is relatively higher for the countryside than for the cities.25 But columns (4) and (5) of tables 2 and 3 indicate that the effect of cocoa production going through larger rail stations only impact urban
23Including urban population in 1931 in regression (1) does not change the effect of railway
connectivity on cocoa production in 1927. This confirms that the relationship is not from railway connectivity to population and then to cocoa production. Besides, as argued in section 2.2, cocoa production is traditional, requiring very few inputs. It is thus very unlikely that population drives cocoa production.
24If we use the cell urbanization rate as an outcome, we find that railway connectivity increases
the rate by 5.8%, but this effect is only significant at 15%.
25The effect of cocoa production on rural growth is equal to 1.5 - 0.5 = 1, while it is equal to
growth, as the effects for urban growth are the same as for population growth. Table 4 investigates whether the effect of cocoa production goes through more cocoa beans being produced or higher incomes thanks to the cocoa sector. We run regression (2), except we add cocoa production in value. Whether we consider total population growth (col.(1)-(2)), urban growth (col.(3)-(4)), or rural growth (col.(5)-(6)), the effect of cocoa production is absorbed by the cocoa income
vari-able.26 This signifies that the cocoa sector impacts demographic growth because
it provides people with high incomes. The cocoa income effect is actually much larger for urban growth than for rural growth (see col.(4) versus col.(6)), which confirms that there are urban consumption linkages from the cocoa sector: people are attracted to cocoa-producing areas because of the high income generated by cocoa cultivation, but if they spend a large share of their income in city, this also drives urban growth. Further evidence on consumption linkages is provided in section 5.4, as we now examine the robustness of those results.
5.2
Placebo Regressions and Nearest Neighbor Estimators
Tables 5 and 6 report results for placebo regressions and confirm that there are no spurious effects from lines that were planned but not built (col. (2)-(5)) or lines that were not built yet in 1918 (col (6)-(7)). The only issue is for Huni Valley-Kade (1927), for which we find an effect for cocoa production between 20 and 40 km. This is due to the south-side of the line having some cocoa production (see figures 2 and 4), but we argue in the next section that this effect is due to production permitted by good coastal roads. We then test the robustness of our results to removing controls (see col.(2) and (6) of table 7), considering placebo cells as the control group (see col.(3) and (7) of table 7) and using the full sample
(see col.(4) and (8) of table 7). We also alternatively use as a control group
counterfactually connected cells for each placebo line, but results are similar to using all placebo cells altogether (results not shown but available upon request). Results are actually higher when we drop controls, use placebo cells as a control group or the full sample. This confirms that the estimates we are privileging in our main analysis are conservative estimates.
26The effects for cocoa production in volume become negative, but the overall effects of cocoa
5.3
Results on Alternative Transportation Networks
Did railways cause trade diversion? Figure 8 shows historical trade routes, which were forest tracks used by merchants and slave traders (Dickson 1968). The cells amongst those routes were the most likely to lose from the introduction of a modern transportation network. We run regressions (1) and (2), except we now also include a dummy equal to one if the cell is less than 20 km from a historical trade route. If there is trade diversion, we expect a negative effect of being on a trade route on population growth. Results reported in column (5) of table 8 indicate that those cells were not losing against other control cells.
As argued in section 2.1, roads only became a competitive transportation tech-nology in the late 1920s. Figure 9 displays roads in 1922, distinguishing class 2 and class 3 roads. Most of the non-coastal roads served as feeders to the railway. Then, many coastal roads were class 2 roads (”roads suitable for motor traffic but occasionally closed”) that were used to transport cocoa beans from coastal producing areas to the coast. We run regressions (1) and (2), except we now also include cell dummies for containing a class 2 road or a class 3 road, and their interactions with being less than 40 km from the railway line.27 Results reported
in column (3) of table 8 confirm that class 2 roads have an independent effect on cocoa cultivation, which is logical since most of them are along the coast. Being on a class 3 road less than 40 km from a railway line also has a strong impact on cocoa cultivation. This stems from those roads being feeders to the railway. We obtain similar results if we consider population growth instead (see col.(6) of table 8). There is high but not significant interacted effect of being on a class 3 road and less than 40 km from the railway lines. But the effect of being on a class 3 road on population growth is high and significant if we add the individual class 3 road effect and its interacted effect with the railway (the effect is significant at 5% if we do the F test using the two coefficients).
5.4
Discussion on Channels
In line with the conceptual framework in section 3, the possibility to cultivate cocoa along railway lines attracted migrants to cocoa-producing areas. Those migrants
established their own cocoa farm or worked as laborers for cocoa landowners.28
Then, cocoa farmers obtained a surplus which they spent on urban goods and services. This created labor opportunities in the urban manufacturing and service sectors, and labor demand was matched by local inhabitants or migrants. We have no data at the cell level for those channels but we use evidence collected by historians and data available for more aggregate spatial levels.
Hill (1963) magisterially describes the origins of the colonization of the forest. In the late 1890s, farmers from Akwapim (around Aburi, see fig.4) migrated to the west to buy forested land and establish cocoa farms, initiating a scramble for land. Those forests were then scarcely inhabited and belonged to the inhabitants of the few surrounding towns. She writes (p.15): ”Their chiefs were glad to seize the opportunity of selling land outright to the enterprising Akwapim.” and ”The cash received for the land seemed like a windfall to the vendor chiefs.” The proceeds of cocoa farming were invested in buying new land (p.183-186), but there were other forms of investments (p.190-192): house-building in the home town; buying prop-erties in the main cities; sending their children to school; cocoa produce-buying
and transportation companies.29 At the beginning, migrants relied on family
la-bor, but large farmers quickly employed laborers from other regions, such as Ewe from the Volta Region (East). Production spread to Ashanti, where Asantes were establishing their own farms or leasing land to Akwapim farmers (Austin 2008, p.16). Migration was massive, with a clear social stratification between late and recent migrants. Cardinal (1931) writes (p.84): ”An influx of strangers drawn here as it were to El Dorado has opened up the country to an extent that no man could have foreseen as possible within so short a period.” and ”The industrious planter has been forced to hire labor in order to cope with the fruits of his industry and is gradually ceasing to be a working farmer with the inevitable result that in course of time he will be a non-working landlord.”
We now use data from the 1931 census and other sources to support historical evidence with national or regional analyzes on cocoa incomes, migration patterns and urban workforce. First, we learn that 47.6% of adult males in the country were
28This suggests they got a higher income in cocoa-producing areas than in their region of birth. 29Unfortunately, she did not discuss how they were consuming their available income, once
directly involved in cocoa cultivation. 47.4% of Ghanaians then lived in cocoa-producing households. Second, those farmers were very wealthy. Back-of-the-envelop calculations indicate that each male cocoa farmer was 15.0% wealthier than unskilled laborers in low price years, but 14.5 times wealthier in high price years!30 Third, producing regions had a higher rate of migrants, which we capture by the share of people being born in another province or country. Excluding the West of the country where mines also attracted migrants, 14.0% of people were born elsewhere in producing regions versus 10.4% for non-producing areas. Then, the ratio of males to females was 1.06 in producing areas versus 0.94 in non-producing areas (excluding mining areas). Fourth, we learn that 48.5% of the urban male
workforce works in agriculture.31 The census does not distinguish cocoa farmers
and other farmers, but this figure indicates that many farmers use towns as their main residence to work on farms outside the city limits. 9.5% of urban male workers are then engaged in industry, and 42% in other sectors, mostly services and light manufacturing. The fifteen main non-agricultural occupations are: traders (8.0%), domestic servants (6.6%), commerce (4.5%), carpenters (4.5%), car drivers (3.2%), hawkers (2.7%), tailors (2.4%), government civil servants (2.3%), masons (2.0%), goldsmiths (1.3%), policemen (1.3%), cocoa brokers (1.2%), teachers (1.1%), motor mechanics (1.0%) and washermen (1.0%). Altogether, they account for 82.3% of the non-agricultural sector. The same positions account for 84.2% of the urban
male workforce in cocoa-producing provinces.32 This means that cities in
producing areas and non-producing areas are not significantly different, but cocoa-producing areas have more cities. A large share of urban employment is thus linked to trade, construction, consumer goods and services and public administration. Overall, those results are consistent with producing areas having a large economic surplus which is spent on urban goods and services, thus driving urban growth.
30For instance, in low price years, each male cocoa farmer produces around 0.6 ton, for which
it receives 15.0% more than unskilled laborers. In high price years, male cocoa farmers are 14.5 times wealthier.
31The criterion to define cities differs from the 1,000 threshold we use. The total urban
population we find for Ghana is three times larger than the one reported in the census.
32Considering the whole country, 29.8% of the urban female workforce work in the agricultural
sector. Other occupations are: market traders (38.8%), hawker (16.2%), domestic servants (7.7%), bakers (5.4%), dressmakers (1.6%), teachers (0.2%) and government civil servants (0.2%).
6
The Long-Term Effects of Railways
In 1931, the railways were transporting 760,000 tons of goods and 1,340,000 pas-sengers. By the end of the 1960s, the railways were transporting 3,500,000 tons of goods and 6,000,000 passengers. Yet, massive investments in road infrastructure and underinvestments and management issues in the railway sector caused a sig-nificant decline of the latter. In 1984, the railways were only transporting 374,000
tons of goods the same amount as in 1921 and 2,180,000 passengers. Although
recent investments have permitted the railways to be competitive again, they still transport much less than what they could do at independence.
We now study whether districts that are connected to the railways are rela-tively more developed today despite thirty years of marked decline in rail trans-portation. In other words, has railway construction at the beginning of the 20th century durably transformed the economic geography of Ghana? We use the 2000 Population and Housing Census and the 2000 Facility Census to see if districts connected to the railways today are now more urbanized, have better infrastruc-ture and larger manufacturing and service sectors. We have data for 110 districts but we just want to compare connected districts to their nearest neighbors. We thus restrict our analysis to those Southern districts that are suitable to cocoa cultivation. We run the following model for districts d:
Dvtd,2000 = c + λRaild,2000+ ζXd,2000+ wc (3)
where our dependent variable Dvtd,2000 is a development outcome of district d in
2000: urban density, access to infrastructure and sectoral shares.33 Rail
d,2000 is a
dummy equal to one if the centroid of the district is less than 20 km from a railway line in 2000.34 X
d,2000 is then a set of district-level controls which we can include
to account for potentially contaminating factors, whether political economy or economic geography: dummies for containing a national city or a regional capital, being a coastal district, and Euclidean distances to the coast, Accra and Kumasi.
33Urban density is total population in localities with more than 1,000 inhabitants per sq km. 34There were very few lines built after 1931. The layout of those lines that were built after
1931 was strongly influenced by the layout of the railway network in 1931. We use the network in 2000, although we could have been using the network in 1931 or 1918.
Figure 10 displays urban density in 2000 and cities in 1931, and reports which districts are ”connected” according to our definition. Urbanization in 2000 ap-pears highly correlated with urbanization in 1931. When regressing urban density in 2000 on urban density in 1931, we find that the latter explains around 65% of the former (results not shown but available upon request). Regression results for model (3) are then reported in table 9. We find that railway districts are relatively more urbanized (+136.7 inhabitants per sq km), have a better access to
infrastruc-ture especially for non-universal public goods such as senior secondary schools
(+12.14%), hospitals (+20.42%) or electricity (+12.70%) and larger
manufactur-ing (+4.66%) and service (+8.73%) sectors.
7
Conclusion
We look at the impact of transportation infrastructure on agriculture and devel-opment, using a natural experiment provided by railway construction in colonial Ghana (1901-1931). We study the effects of two railway lines that were built be-tween 1901 and 1923 to connect the coast and gold mines and the hinterland city of Kumasi. Combining data on railways, cocoa production and demographic and urban growths at a very fine spatial level, we find a strong effect of railway con-nectivity on cocoa production due to reduced transportation costs. The economic boom in cocoa-producing areas is then associated with demographic growth and urbanization. While the possibility of producing cocoa attracts migrants to the countryside, consumption linkages account for urbanization. We demonstrate that there are no spurious effect from lines that were not built yet, and lines that were planned but never built. Our results are robust to considering nearest neighbor estimators. Lastly, we claim that railway connectivity had long-term effects on wel-fare, as districts connected to the railway system are now more developed, despite thirty years of marked decline in rail transportation. Whether the new railway line to the North will have similar effects is difficult to say, as this is a very different geographical environment and there is already a widespread road network. But our study has shown that transportation infrastructure investments could have large welfare externalities, as they promote trade integration and economic growth.
References
Acemoglu, D., and S. Johnson (2005): “Unbundling Institutions,” Journal of
Political Economy, 113(5), 949–995.
Acemoglu, D., S. Johnson, and J. Robinson (2001): “The Colonial Origins
of Comparative Development: An Empirical Investigation,” American Economic Review, 91(5), 1369–1401.
(2002): “Reversal Of Fortune: Geography And Institutions In The Mak-ing Of The Modern World Income Distribution,” The Quarterly Journal of Eco-nomics, 117(4), 1231–1294.
(2005): “The Rise of Europe: Atlantic Trade, Institutional Change, and Economic Growth,” American Economic Review, 95(3), 546–579.
African Development Bank (2003): Review of the Implementation Status of the Trans African Highways and the Missing Links. African Development Bank: Tunis, and UN Economic Commission for Africa: Addis Ababa.
African Union (2006): Rail Development in Africa: Stakes and Prospects, Ob-jectives and Mis- sions of The African Rail Union (ARU). Document prepared by the ARU General Secretariat for the Conference of African Ministers In Charge of Rail Transport 10-14 April 2006, Brazzaville (Congo).
Akee, R. (2006): “The Babeldaob Road: The Impact of Road Construction on Rural Labor Force Outcomes in the Republic of Palau,” IZA Discussion Papers 2452, Institute for the Study of Labor (IZA).
Atack, J., F. Bateman, M. Haines, and R. A. Margo (2010): “Did
Rail-roads Induce or Follow Economic Growth? Urbanization and Population Growth in the American Midwest, 1850-60,” Social Science History, 34(2), 171–197.
Atack, J., and R. A. Margo (2009): “Agricultural Improvements and Access
to Rail Transportation: The American Midwest as a Test Case, 1850-1860,” NBER Working Papers 15520, National Bureau of Economic Research, Inc. Austin, G. (2007): “Labour And Land In Ghana, 1874-1939: A Shifting Ratio
And An Institutional Revolution,” Australian Economic History Review, 47(1), 95–120.
(2008): “Resources, techniques, and strategies south of the Sahara: re-vising the factor endowments perspective on African economic development, 1500-2000,” Economic History Review, 61(3), 587–624.
Bairoch, P. (1988): Cities and Economic Development: Frow the Dawn of His-tory to the Present. Chicago: The University of Chicago Press.
Banerjee, A., E. Duflo, and N. Qian (2009): “On the Road: Access to
Transportation Infrastructure and Economic Growth in China,” Unpublished manuscript, Department of Economics, Massachussets Institute of Technology.
Barrios, S., L. Bertinelli, and E. Strobl (2006): “Climatic change and
rural-urban migration: The case of sub-Saharan Africa,” Journal of Urban Eco-nomics, 60(3), 357–371.
Bates, R. (1981): Markets and States in Tropical Africa: The Political Basis of Agricultural Policies. Berkeley: University of California Press.
Bertocchi, G., and F. Canova (2002): “Did colonization matter for growth?:
An empirical exploration into the historical causes of Africa’s underdevelop-ment,” European Economic Review, 46(10), 1851–1871.
Bloomberg (2010): Ghana, China National Sign $6 Billion Railroad Deal, GBC Says. Bloomberg.com 28 November 2010.
Burgess, R., and D. Donaldson (2010): “Can Openness Mitigate the Effects
of Weather Shocks? Evidence from India’s Famine Era,” American Economic Review, 100(2), 449–53.
Buys, P., U. Deichmann, and D. Wheeler (2010): “Road Network
Upgrad-ing and Overland Trade Expansion in Sub-Saharan Africa,” Journal of African Economies, 19(3), 399–432.
Calderon, C., and L. Serven (2008): “Infrastructure and economic
develop-ment in Sub-Saharan Africa,” Policy Research Working Paper Series 4712, The World Bank.
Cardinal, A. W. (1931): The Gold Coast. Government Printer.
Chaves, I., S. L. Engerman, and J. A. Robinson (2010): “Reinventing the
British West Africa,” Unpublished manuscript, Department of Political Science, Stanford University.
Clark, X., D. Dollar, and A. Micco (2004): “Port Efficiency, Maritime
Transport Costs, and Bilateral Trade,” Journal of Development Economics, 75(2), 417–450.
Dercon, S., D. O. Gilligan, J. Hoddinott, and T. Woldehan (2008):
“The impact of agricultural extension and roads on poverty and consumption growth in fifteen Ethiopian villages:,” Discussion paper.
Dickson, K. (1968): A Historical Geography of Ghana. Cambridge: Cambridge University Press.
Donaldson, D. (2010): “Railroads of the Raj: Estimating the Impact of Trans-portation Infrastructure,” NBER Working Papers 16487, National Bureau of Economic Research, Inc.
Fay, M., and C. Opal (2000): “Urbanization without growth : a
not-so-uncommon phenomenon,” Policy Research Working Paper Series 2412, The World Bank.
Feyrer, J. (2009): “Trade and Income – Exploiting Time Series in Geography,” NBER Working Papers 14910, National Bureau of Economic Research, Inc.
Feyrer, J., and B. Sacerdote (2009): “Colonialism and Modern Income:
Islands as Natural Experiments,” The Review of Economics and Statistics, 91(2), 245–262.
Fogel, R. (1964): Railroads and American Economic Growth: Essays in Econo-metric History. Baltimore: Johns Hopkins University Press.
Gollin, D., S. Parente, and R. Rogerson (2002): “The Role of Agriculture
in Development,” American Economic Review, 92(2), 160–164.
Gould, P. R. (1960): The Development of the Transportation Pattern in Ghana. Chicago: Northwestern University Press.
Hill, P. (1963): The Migrant Cocoa-Farmers of Southern Ghana: A Study in Rural Capitalism. Cambridge: Cambridge University Press.
Huillery, E. (2009): “History Matters: The Long-Term Impact of Colonial Pub-lic Investments in French West Africa,” American Economic Journal: Applied Economics, 1(2), 176–215.
(2011): “The Impact of European Settlement within French West Africa. Did pre-colonial prosperous areas fall behind?,” Discussion paper.
Iyer, L. (2010): “Direct versus Indirect Colonial Rule in India: Long-Term Con-sequences,” The Review of Economics and Statistics, 92(4), 693–713.
Jacoby, H. C. (2000): “Access to Markets and the Benefits of Rural Roads,” Economic Journal, 110(465), 713–37.
Jacoby, H. G., and B. Minten (2009): “On measuring the benefits of lower
transport costs,” Journal of Development Economics, 89(1), 28–38.
Jedwab, R. (2011): “Why is Africa Urbanized but Poor? Resource Booms and Cities in Ghana and Ivory Coast,” Unpublished manuscript, Department of Economics, Paris School of Economics.
Johnson, S., J. D. Ostry, and A. Subramanian (2007): “The Prospects
for Sustained Growth in Africa: Benchmarking the Constraints,” IMF Working Papers 07/52, International Monetary Fund.
Lim˜ao, N., and A. J. Venables (2001): “Infrastructure, Geographical
Dis-advantage, Transport Costs, and Trade,” The World Bank Economic Review, 15(3), 451–479.
Luntinen, P. (1996): Railway on the Gold Coast: A meeting of two cultures : a colonial history. Helsinki: Suomalainen Tiedeakatemia.
Matsuyama, K. (1992): “Agricultural productivity, comparative advantage, and economic growth,” Journal of Economic Theory, 58(2), 317–334.
(2009): “Structural Change in an Interdependent World: A Global View of Manufacturing Decline,” Journal of the European Economic Association, 7(2-3), 478–486.
Michaels, G. (2008): “The Effect of Trade on the Demand for Skill: Evidence from the Interstate Highway System,” The Review of Economics and Statistics, 90(4), 683–701.
Michaels, G., F. Rauch, and S. J. Redding (2008): “Urbanization and Structural Transformation,” CEPR Discussion Papers 7016.
Mizuno, N., and R. Okazawa (2009): “Colonial experience and postcolonial
underdevelopment in Africa,” Public Choice, 141(3), 405–419.
Moradi, A. (2008): “Confronting colonial legacies-lessons from human develop-ment in Ghana and Kenya, 1880-2000,” Journal of International Developdevelop-ment, 20(8), 1107–1121.
Mu, R.,and D. van de Walle (2007): “Rural roads and poor area development
in Vietnam,” Policy Research Working Paper Series 4340, The World Bank. Poelhekke, S. (2010): “Urban growth and uninsured rural risk: Booming towns
in bust times,” Journal of Development Economics, In Press, Corrected Proof.
Radelet, S., and J. Sachs (1998): “Shipping Costs, Manufactured Exports,
and Economic Growth,” Presented at the American Economics Association an-nual meeting.
Renkow, M., D. G. Hallstrom, and D. D. Karanja (2004): “Rural
in-frastructure, transactions costs and market participation in Kenya,” Journal of Development Economics, 73(1), 349–367.
Rodrik, D. (1998): “Trade Policy and Economic Performance in Sub-Saharan Africa,” NBER Working Papers 6562, National Bureau of Economic Research, Inc.
Ruf, F. (1995): Booms et crises du cacao: Les vertiges de l’or brun. Paris:
Min-ist`ere de la Coop´eeration, CIRAD-SAR and Karthala.
Teal, F. J. (2002): “Export Growth and Trade Policy in Ghana in the Twentieth Century,” The World Economy, 25(9), 1319–1337.
Tosh, J. (1980): “The Cash Crop Revolution in Tropical Africa: An Agricultural Reappraisal,” African Affairs, 79(314), 79–94.
United Nations (2009): World Urbanization Prospects: The 2009 Revision. New York: United Nations, Department of Economic and Social Affairs.
World Bank (2010): World Development Indicators. Washington DC: World Bank Data.
Figure 1: Forested Areas, Province Boundaries and Railway Lines (1918).
Note: Forested areas were primary forests before agricultural exports led to deforestation. Province boundaries date from 1916.
Figure 2: Railway Lines in 1918.
Note: A cell is defined as suitable if some of its area corresponds to cocoa soil. Tafo-Kumasi was built in 1923 and Huni Valley-Kade in 1927. Cape Coast-Prasu-Kumasi was planned in 1873, Saltpond-Oda-Kumasi in 1893, Apam-Oda-Kumasi in 1898 and Accra-Oda-Kumasi in 1899. Those projects were abandoned due to a lack of political will and funds.
Figure 3: Cocoa Production, Exports and Transportation, 1900-1931.
Note: Three-year moving average for cocoa production and the share of cocoa beans exports in total exports.
Figure 4: Railway Lines in 1918 and Cocoa Production 1927.
Note: A cell is defined as suitable if some of its area corresponds to cocoa soil. A cell is defined as highly suitable if more than 50% of cell area are forest ochrosols (first class, second class, third class, unsuitable). Ochrosols are the best soils for cocoa cultivation. A cell is defined as poorly suitable if more than 50% of cell area are forest oxysols. Oxysols are very poor cocoa soils.
Figure 5: Railway Lines (1918) and Cities 1901-1931.
(a) Cities in 1901 (b) Cities in 1931
Note: We define as a city any locality with more than 1,000 inhabitants.
Figure 6: Rural Population in 1901.
Note: 1901 population data was exhaustively surveyed and georeferenced only for the Gold Coast Colony and part of the Ashanti. For each cell, rural population is the total population of localities with less than 1,000 inhabitants.
Figure 7: Rural Population in 1931.
Note: A map of the distribution of population was published for 1931. For each cell, rural population is the total population of localities with less than 1,000 inhabitants.
Figure 8: Railway Lines in 1918 and Historical Trade Routes in 1850.
Figure 9: Railway Lines in 1918 and Roads in 1922.
Note: Class 2 roads are roads suitable for motor traffic but occasionally closed, while class 3 roads are roads suitable for motor traffic in dry season only.
Figure 10: Urban Density in 2000, Cities in 1931 and Railway Districts.
T ABLE 1: OBSER V ABLES F OR TREA TED VERSUS CONTR OL CELLS V ariable : Dumm y Rail 1918, 0-20 km trol Cells: All Placeb o C.Coast-Kumasi (1) (2) (3) V ariable : y ”the cell con tains a mine” 0.03*** 0.03* 0.04 p opulation in 1901 98.5 -135.6 144.6 p opulation in 1901 541.7*** 359.8** 150.7 b er of large to wns in 1901 0.00 -0.04 -0.03 b er of to wns in 1901 0.02 -0.19 0.02 b er of head chief to wns in 1901 -0.01 -0.03 -0.02 b er of large villages in 1 901 1.34*** 1.06*** 0.34 b er of villag es in 1901 6.38*** 5.17*** 2.43 o chrosols cl ass 1 (%) 0.02** 0.02** 0.02 o chrosols cl ass 2 (%) -0.04* -0.10*** -0.04 o chrosols cl ass 3 (%) -0.24*** -0.29*** -0.42*** o chrosols u nsuitable (%) 0.04* 0.03 0.02 in tergrades (%) 0.20*** 0.19*** 0.27*** o xysols (%) 0.05 0.16*** 0.16*** mean (m) -16.88* -17.73 36.11** standard deviation (m) 2.89 3.21 18.39*** erage ann ual rainfall (mm) -29.06 50.92** 116.40*** to Accra (km) -42.68*** 41.06*** 3 7.42*** to Kumasi (km) -10.57* 13.74** 1.43 to Aburi (km) -39.94*** 42.08*** 26.57** to the coast (km) -29.89*** -2.81 23.10*** T reated Group: 110 110 110 Con trol Group: 501 152 43 Standard errors are rep or ted in paren theses; * p < 0.10, ** p < 0.05, *** p < 0.01. e regress eac h con trol on a dumm y equal to one if the cell is less than 20 km from a railw a y line. W e th us run 63 differen t regressions.
TABLE 2: RAILROADS, COCOA PRODUCTION AND POPULATION GROWTH
Dependent Variable: Cocoa Prod. 1927 Population 1931
(Tons) (Number of Inhabitants)
(1) (2) (3) (4) (5) Dummy Rail 1918, 0-20 km 329.5*** 1,061.3*** 556.6** 286.3 363.4 [63.9] [298.6] [272.0] [299.6] [297.9] Dummy Rail 1918, 20-40 km 125.3** 85.7 -106.3 -96.3 -64.1 [57.1] [221.7] [215.5] [216.1] [217.6] Dummy Rail 1918, 40-60 km -63.9 -208.7 -110.8 -101.3 -88.1 [49.1] [203.4] [190.2] [190.1] [187.2]
Cocoa Production (Tons) 1927 1.5*** 1.5*** 1.4***
[0.2] [0.2] [0.2]
Dummy Rail Station 1918 1,013.7** 435.3
[478.1] [409.4]
Cocoa Tonnages at Rail Station 1918 0.1**
[0.1]
Observations 611 611 611 611 611
R-squared 0.58 0.72 0.76 0.76 0.77
Controls Y Y Y Y Y
Notes: Standard errors are reported in parentheses; * p<0.10, ** p<0.05, *** p<0.01. Additional controls: urban population in 1901, rural population in 1901, number of large towns, towns (> 500), headchief towns, large villages (100-500) and villages (< 100) in 1901, share (%) of ochrosols class 1, class 2, class 3, unsuitable, intergrades,