HAL Id: cea-02389430
https://hal-cea.archives-ouvertes.fr/cea-02389430
Submitted on 2 Dec 2019
HAL is a multi-disciplinary open access
archive for the deposit and dissemination of
sci-entific research documents, whether they are
pub-lished or not. The documents may come from
teaching and research institutions in France or
abroad, or from public or private research centers.
L’archive ouverte pluridisciplinaire HAL, est
destinée au dépôt et à la diffusion de documents
scientifiques de niveau recherche, publiés ou non,
émanant des établissements d’enseignement et de
recherche français ou étrangers, des laboratoires
publics ou privés.
First-principles calculations of momentum distributions
of annihilating electron-positron pairs in defects in
UO_2
Julia Wiktor, Gérald Jomard, Marc Torrent, M. Bertolus
To cite this version:
Julia Wiktor, Gérald Jomard, Marc Torrent, M. Bertolus. First-principles calculations of momentum
distributions of annihilating electron-positron pairs in defects in UO_2. Journal of Physics: Condensed
Matter, IOP Publishing, 2017, 29 (3), pp.035503. �10.1088/1361-648X/29/3/035503�. �cea-02389430�
electron-positron pairs in defects in UO
2Julia Wiktor,1 G´erald Jomard,1 Marc Torrent,2 and Marjorie Bertolus1
1CEA, DEN, DEC, Centre de Cadarache, 13108, Saint-Paul-lez-Durance, France 2CEA, DAM, DIF, F-91297 Arpajon, France
We perform first-principles calculations of momentum distributions of annihilating electron-positron pairs in vacancies in uranium dioxide. We take into account the full atomic relaxation effect (due to both electronic and positronic forces) and use self-consistent two-component density func-tional theory schemes. We present one-dimensional momentum distributions (Doppler-broadened annihilation radiation line shapes) along with line-shape parameters S and W . The effect of krypton incorporation in the vacancy is also considered and it is shown that it should be possible to observe the fission gas incorporation in defects in UO2 using positron annihilation spectroscopy.
I. INTRODUCTION
Uranium dioxide (UO2) is currently the most widely
used fuel material in pressurized water reactors (PWR). During the reactor operation the fission of actinide nu-clei causes the creation of large amounts of defects, what leads to the evolution of the physical and chemical
prop-erties of UO2. To understand the behavior of the fuel
material during reactor operation, it is essential to study the effects of the irradiation on the thermomechanical
and thermochemical properties of UO2caused by defects
creation and their interaction with fission products. Positron annihilation spectroscopy (PAS)1,2 is one of
the non-destructive methods that can be used to study vacancies. There are two positron annihilation features
that allow one to characterize defects in solids: the
positron lifetime, mostly sensitive to the open volume of defects, and the Doppler broadening of the annihilation radiation, carrying information on the chemical environ-ment in which positrons annihilate. Since PAS results do not provide a direct link between the signal and the type of the defect, comparisons with other experimental tech-niques or with electronic structure calculations are often required in the interpretation of experimental data.
In a recent study we performed fully self-consistent calculations of positron lifetimes for defects in uranium
dioxide3 and used the computational results to identify
defects in α-irradiated UO2 samples. We observed that
in some cases different vacancies exhibit similar positron lifetimes and that it can be difficult to distinguish them based on this characteristic itself. In the present work we perform calculations of the second positron annihilation characteristic, the Doppler broadening of the annihila-tion radiaannihila-tion, which is often measured in experimental
positron studies on UO24–9 and can bring
complemen-tary information on defects. This paper is organized as
follows: In Sec. II we briefly present the computational
methods. In Sec.III we present the calculated Doppler
spectra and S and W parameters and discuss the results. Finally, we conclude the paper in Sec.IV.
II. METHODS
We use the implementation of the two-component den-sity functional theory (TCDFT)1,10,11 within the
projec-tor augmented-wave (PAW)12–15framework, available in
the ABINIT code16–18. The methods are described in
Ref.19and we only recall them briefly here.
In this work we use the so-called ‘state-dependent’20 scheme to calculate the momentum distributions of the annihilating electron-positron pairs. In this method the momentum distribution ρ(p) is expressed as:
ρ(p) = πre2cX ij γj Z dr e−ip·rΨ+(r)Ψ−j(r) 2 , (1)
where Ψ+(r) is the positron wavefunction, Ψ−
j(r) is the
wavefunction of the electron state j, p is a given momen-tum, re is the classical electron radius and c is the speed
of light. In the above equation γj is equal to λj/λIPMj ,
where λj is the total annihilation rate calculated for the
electronic state j, λj= πr2ec
Z
dr n−j(r)n+(r)γ(n−), (2)
and λIPM
j is the annihilation rate calculated for the same
state within the IPM, using γ = 1. n+(r) is the positron
density and n−j(r) is the density corresponding to the electron state j.
To calculate the Doppler spectra of the perfect lattice we use the conventional (CONV) scheme, in which the LDA zero-positron density limit of the electron-positron
correlation functional, parametrized by Boro´nski and
Nieminen11 using the data provided by Arponen and
Pajanne21, is taken. In momentum distribution
calcu-lations for vacancies, we perform fully self-consistent cal-culations, using a full LDA electron-positron correlation functional provided by Puska, Seitsonen, and Nieminen22
and an enhancement factor depending on both the elec-tron and the posielec-tron densities, g(n−, n+). This method corresponds to the so-called PSN scheme, in which case Eq. (2) is replaced by:
λj = πre2c
Z
2 The calculations are performed as self-consistent loops
on the electronic and positronic densities: during each subloop, one of the two densities is kept constant while the other is being converged. In the calculations we allow the atomic positions to relax, according to the electronic and positronic forces, since it has been shown that the re-laxation effect can affect strongly the calculated positron annihilation characteristics23–25.
Both electronic and positronic wavefunctions are de-scribed using the same mixed basis (planewaves and atomic orbitals) in the framework of the PAW method. The PAW data sets are generated using a modified
ver-sion of the atompaw code14. For oxygen we included
8 electrons (1s, 2s and 2p) and for uranium 14 electrons (5f , 6s, 6p, 6d and 7s) in the valence state. Additionally, to achieve a correct description of the positron wavefunc-tion, we add 5s and 5p states in the U basis set (see Ref.19
for the explanation of the dataset generation and discus-sion on the PAW data set completeness for the positron description).
We use the generalized gradient approximation (GGA)
as parametrized by Perdew, Burke, Ernzerhof (PBE)26
to describe the exchange-correlation interactions. More-over, a Hubbard-like term (U ) is added in order to take into account the strong correlations between the 5f
elec-trons of the uranium atoms. The Liechtenstein scheme27
of the DFT+U method is used. The values of the U and J parameters are set to 4.5 eV and 0.51 eV respectively,
in agreement with earlier DFT+U calculations28–32 and
the values extracted from experiments33. In order to
avoid the convergence to one of the numerous metastable states yielded by the DFT+U method and ensure that the ground state is reached, we used the occupation ma-trix control scheme31,34,35. We consider a 1k antifer-romagnetic ordering, which is an approximation of the noncollinear 3k order, since the two exhibit only small differences in energy36. We did not take into account the
spin-orbit coupling (SOC) due to the too high computa-tional cost. Extensive investigations of the SOC influence on the properties of actinide compounds37,38suggest that it does not affect the properties of defects39.
Calculations for defects are performed using 96 atom supercells (2×2×2 repetitions of the fluorite unit cell). We use the equilibrium lattice parameters of UO2yielded
by the set of parameters described above, a = b = 5.57 ˚A and c = 5.49 ˚A. The positron wavefuntion and density are calculated at two k-points, the Γ point and another one chosen to lie on the edge of the Brilloun zone, to avoid the delocalization of the positron due to the small supercell, as proposed by Korhonen et al.40. The same k-points are
used in the electronic calculations. The momentum dis-tributions have been calculated using the wavefunctions corresponding to the Γ point only. We used the cut-off energy of 680 eV, since we found it was enough to obtain Doppler spectra converged up to 40 mrad. The atomic relaxation is performed until the forces acting on atoms
become smaller than 0.03 eV/˚A.
For comparison with experiments we calculate
one-dimensional projections (Doppler spectra) of the three-dimensional momentum densities in three different direc-tions. This is done by integrating the momentum distri-bution along two remaining directions, as:
ρ(pz) =
Z Z
dpxdpyρ(r). (4)
In the present study we calculate projections in three different directions and average the results. To obtain the best quality of the Doppler spectra, we choose pz to
be normal to the dense (001), (011) and (111) planes. Additionally, to mimic the finite resolution of experi-mental measurements we convolve the theoretical results with a Gaussian function with the FWHM (full width at half maximum) equal to 4.7 mrad. We further interpo-late the one-dimensional spectra on a grid with 0.1 mrad spacing and normalize the spectra to unity.
III. RESULTS AND DISCUSSION A. Comparison of calculation schemes
In this work we use the PSN scheme to calculate the momentum distributions of annihilating pairs in
vacan-cies in UO2. We decided to study, however, the effect
of the choice of the calculation method on the Doppler
spectra of defects in UO2. We perform, therefore,
cal-culations using two other schemes, CONV and GGGC (see for instance Ref.22or19for the description of various
schemes). In Fig. 1 we compare the ratio curves
(nor-malized Doppler spectrum of the defect divided by the normalized Doppler spectrum of the lattice) calculated for the uranium monovacancy using the CONV, GGGC and PSN schemes. The vacancy was relaxed using the
PSN and GGGC schemes. In the case of the CONV
method we compare results calculated first for unrelaxed atomic positions and then taking the relaxed positions from the GGGC calculation. We can observe that the general shapes of the ratio curves calculated using differ-ent schemes are similar. For all methods a peak at p=0 is observed, with GGGC yielding the largest amplitude and the CONV method with unrelaxed positions the low-est. A second peak can be observed around p = 15 mrad, while around p = 27 mrad a shoulder or a peak, depend-ing on the method used, appears.
The effect of the atomic relaxation on the calculated ratio curve can be analyzed by comparing the results ob-tained using the CONV method for two different geome-tries (blue lines in Fig.1). We can observe that when the uranium vacancy relaxes outwards, the low-momentum contribution increases, since the electronic density moves further from the maximum of the positron density. At the same time, the ratio curve at higher momenta de-creases.
The localized shape of the ratio curve calculated us-ing the GGGC scheme is consistent with the overestima-tion of the positron localizaoverestima-tion yielded by this method,
which was already discussed in previous studies3,22,23,25. As for the PSN scheme, the ratio curve obtained using this method is the flattest. Additionally, we can see that at low momenta the results yielded by this method are in good agreement with the ones calculated using the CONV scheme in the relaxed geometry. The agreement is, however, not as good above p = 10 mrad. In the cal-culations presented below, we use the PSN scheme since this method yields the best description of the positron localization in the defect.
0.6 0.7 0.8 0.9 1 1.1 1.2 0 5 10 15 20 25 30 35 40 CONV unrel. CONV rel. GGGC p (mrad) In te nsit y ratio to UO 2 latti ce PSN
FIG. 1. (Color online) Ratio curves of the calculated momen-tum distributions of annihilating electron-positron pairs in VU using different schemes. All spectra are convoluted with
a Gaussian function with FWHM=4.7 mrad and divided by the lattice spectrum.
B. Vacancies in UO2
We performed calculations of the momentum
distri-butions for several vacancy defects in UO2. The ratio
curves found for neutral VU, VU+VO, the three
configu-rations of VU+2VO and one configuration of 2VU+4VO
vacancies are presented in Fig.2. We can see that all the calculated ratio curves are rather similar, with a maxi-mum at p = 0 and two peaks, one around p = 15 mrad and one around p = 27 mrad. The curve calculated for the neutral 2VU+4VOcomplex is the most distinct from
the others, it is more flat and has much lower values at high momenta. The similarity between for instance the monovacancy and the trivacancies can be explained by the fact, that while oxygen −2 ions are removed from the
neighborhood of VU, the remaining ones can attract the
positron and shift its density toward them (see positron
isodensities in Ref. 3). As a result, even though there
are less oxygen atoms surrounding the positron, the an-nihilation rate with the remaining ones increases and the two effects cancel each other out, leading to rather small changes in the ratio curves. Even though it will be prob-ably possible to observe these changes in the S and W parameters, it could be difficult to distinguish defects based on them.
In the study of the positron lifetimes3we observed that the positron localization in the hexavacancy depends on
p (mrad) In te nsit y ratio to UO 2 latti ce VU+VVOU VU+2VO (011) VU+2VO (111) 2VU+4VO VU+2VO (001) 0.8 0.85 0.9 0.95 1 1.05 1.1 0 5 10 15 20 25 30 35 40
FIG. 2. (Color online) Ratio curves of the calculated mo-mentum distributions of annihilating electron-positron pairs in various defects in UO2. All spectra are convoluted with a
Gaussian function with FWHM=4.7 mrad and divided by the lattice spectrum.
the charge state of this defect. In the (2VU+4VO)2−
complex the positron density was centered between the uranium sites and not inside them, as in the other
de-fects (see Ref. 3). We performed, therefore, a
momen-tum distribution calculation for this defect and present it in Fig.3d, along with the ratio curves of the VO and
VU monovacancies. In the negative hexavacancy, the
positron occupies a large open volume, which is reflected in the high value of the maximum at p = 0, around 1.2. This is consistent with the long positron lifetime (365 ps) calculated for this defect. The curve at higher momenta
has a shape similar to that of VU, peaks are observed
around p = 15 and p = 27 mrad. However, the abso-lute values at high momenta between 10 and 30 mrad are closer to those calculated for VO.
0.7 0.75 0.8 0.85 0.9 0.95 1 1.05 1.1 1.15 1.2 0 5 10 15 20 25 30 35 40 VO VU (2VU+4VO) 2-p (mrad) In te nsit y ratio to UO 2 latti ce
FIG. 3. (Color online) Ratio curves of the calculated mo-mentum distributions of annihilating electron-positron pairs in various defects in UO2. All spectra are convoluted with a
Gaussian function with FWHM=4.7 mrad and divided by the lattice spectrum.
4
C. Effect of the charge state
We verified the effect of the charge state on the mo-mentum distribution for the uranium monovacancy. In Fig.4we present the ratio curves calculated for VU and
V4−U . There are only slight differences between the two charge states. For the negative monovacancy we can ob-serve a small increase in the maximum at p = 0 and a decrease for momenta above p = 5 mrad. These results suggest that the change of the charge state has an almost negligible effect on the ratio curves, unless it changes the site at which the positron is localized, like in the case of the hexavacancy discussed before.
0.8 0.85 0.9 0.95 1 1.05 1.1 1.15 1.2 0 5 10 15 20 25 30 35 40 VU VU 4-p (mrad) In te nsit y ratio to UO 2 latti ce
FIG. 4. (Color online) Ratio curves of the calculated mo-mentum distributions of annihilating electron-positron pairs in VU and V4−U . All spectra are convoluted with a Gaussian
function with FWHM=4.7 mrad and divided by the lattice spectrum.
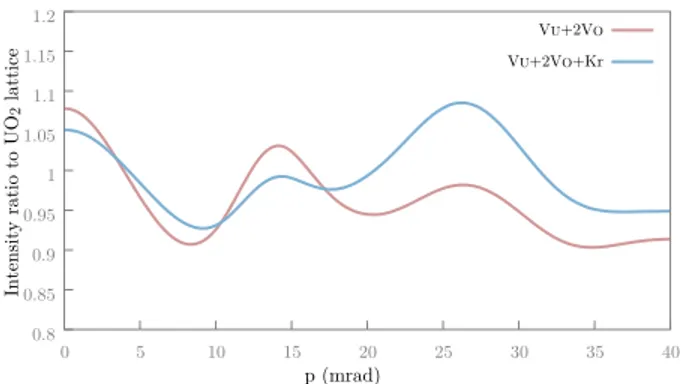
D. Krypton incorporation
Incorporation of gaseous fission products in vacancies
in UO2 is an important issue in the studies of fuel
be-havior under irradiation. The momentum distribution of the annihilation radiation is especially sensitive to the chemical environment of the defect. We have studied, therefore, the effect of a Kr atom on the Doppler spec-trum of VU+2VO(110). The calculated ratio curve is
pre-sented in Fig.5and the positron isodensity in this defect
in Fig. 6. We can see that the Kr incorporation has a
significant effect on the ratio curve. The maximum at p = 0 is decreased, since krypton increases the electron density and decreases the free volume available to the positron, as seen in Fig.5. Additionally, the peak around p = 15 mrad decreases and the one around p = 27 mrad increases. The high sensitivity of the momentum distri-bution of the annihilation radiation to the presence of krypton atoms suggests that such measurement can be very useful in studies of fission products incorporation in UO2. 0.8 0.85 0.9 0.95 1 1.05 1.1 1.15 1.2 0 5 10 15 20 25 30 35 40 p (mrad) In te nsit y ratio to UO 2 latti ce VU+2VO VU+2VO+Kr
FIG. 5. Ratio curves of the calculated momentum dis-tributions of annihilating electron-positron pairs in the VU+2VO(110) trivacancy (Bound Schottky Defect), empty
and containing one Kr atom. All spectra are convoluted with a Gaussian function with FWHM=4.7 mrad and divided by the lattice spectrum.
VO VU VO (a) VU VO VO Kr (b)
FIG. 6. (Color online) Positron isodensities (70% of the max-imum density – solid and 30% – transparent), in red, found in the VU+2VO(110) defect, empty (a) and containing a Kr
atom (b). Uranium atoms are presented in gray, oxygen atoms in blue and krypton in green. White and yellow spheres rep-resent oxygen and uranium vacancies, respectively. Figures were generated using the xcrysden41,42 program.
E. S and W parameters
In experimental PAS studies integrated low- and high-momentum contributions to the high-momentum distribu-tion are often considered. These contribudistribu-tions are cal-culated as so-called S (low-momentum) and W (high-momentum) parameters, being defined, respectively, as the ratio of counts in the regions close to and far from the 511 keV value to the total number of the counts. These parameters are usually presented as values relative to the perfect lattice and defined as:
Srel= Sdefect Slattice (5) and Wrel= Wdefect Wlattice . (6)
We calculated the Srel and Wrel parameters for the
con-sidered vacancies in UO2, using the integration windows
of S ∈ (0, 2.8) mrad and W ∈ (10.61, 26.35) mrad,
as in Ref.6, and present them in Fig. 7. We can see
that the points corresponding to VU, VU+VO, the three
configurations of VU+2VO and neutral 2VU+4VO are
close to each other. However, they could probably be distinguished in high precision experimental
measure-ments. The points corresponding to VO and to negative
2VU+4VO lay far from the other points, hence could be
easily identified if detected in Doppler broadening
mea-surements. By comparing the Srel and Wrel parameters
calculated for the empty VU+2VO(110) defect and when
containing a Kr atom, we can conclude that for the set of integration windows used, the krypton incorporation leads to a clear shift in the measured signal, which should be easily observed in experiments.
0.98 1 1.02 1.04 1.06 1.08 1.1 1.12 1.14 1.16 1.18 0.8 0.82 0.84 0.86 0.88 0.9 0.92 0.94 0.96 0.98 1 S/S lattice W/Wlattice 2 3 654 8 7 10 9 1 2.VO 3.VU 4.VU+VO 1.lattice 5.VU+2VO(001) 6.VU+2VO(011) 7.VU+2VO(111) 8.2VU+4VO 9.(2VU+4VO) 2-10.VU+2VO+Kr Kr exp.
FIG. 7. (Color online) Srelparameter as a function of the Wrel
parameter plotted for various defects in UO2, using windows
S ∈ (0, 2.8) mrad and W ∈ (10.61, 26.35) mrad. The results were obtained using spectra convoluted with a Gaussian func-tion with FWHM=4.7 mrad. The arrow indicates the effect of krypton incorporation. The dotted line indicates the trend in the experimental measurements presented in Ref.6.
F. Comparison with experiments
In Fig. 7 we compare the calculated relative S and
W parameters with the trend in measured parameters observed in Ref.6(dotted line). In this study UO2
sam-ples were irradiated with electrons with various energies
(1 and 2.5 MeV) at various fluences (5×1017 cm−2 and
5×1018 cm−2). The positron lifetime observed in these
samples was equal to 310±5 ps. We can clearly see that there is no agreement between the calculated and mea-sured Srel. and Wrel. parameters. We suppose that it is
due to the fact that the comparison between the calcu-lated and experimental Srel.and Wrel.is only meaningful
if the reference samples, considered as free of defects, ex-hibit positron annihilation characteristic close to those of a perfect lattice. The uranium dioxide samples taken as reference in Ref.6 (annealed during 24 hours at 1700oC
under ArH2) are hyper-stoichiometric and probably
con-tain nonnegligible concentrations of defects, such as nega-tive oxygen interstitials. These defects, even though hav-ing positron lifetimes close to that of the lattice, can give rise to significantly different momentum distributions of annihilating positron-electron pairs. This means that the denominators adopted in Eq. (5) and (6) in the present work and in the experimental study do not correspond. It is worth noting that the comparison between the ab-solute values of S and W would not solve this problem, since they depend strongly on, for instance, the detec-tor geometry, resolution and calibration and, therefore, are meaningless2. We conclude that further experimental studies, with a careful control of the defects concentration in the reference samples and their stoichiometry, could enable an insightful comparison with calculations and a more advanced interpretation of the Doppler broadening
measurements on UO2.
IV. CONCLUSIONS
We performed first-principles calculations of momen-tum distribution of the annihilation radiation for various vacancy defects in uranium dioxide. Self-consistent two-component density functional theory schemes were used and the full atomic relaxation (due to both electronic and positronic densities) was taken into account. We studied the effect of the choice of the calculation scheme, charge state and krypton incorporation on the calculated ratio curves.
We observed that in the case of the majority of consid-ered vacancy defects, except for VO and (2VU+4VO)2−,
calculations yield rather similar relative S and W pa-rameters and hence they could only be distinguished in high precision experimental measurements. In the case of the uranium monovacancy we observed a negligible ef-fect of the charge state on the calculated ratio curve. Our calculations for the bound Schottky defect containing a krypton atom indicate that the incorporation of this fis-sion product affects strongly the Doppler spectrum of the defect and, therefore, could be successfully studied using PAS.
We did not observe a clear agreement between the cal-culated and measured Sreland Wrelparameters. We
sup-pose that this can be related to the fact that the refer-ence samples may contain nonnegligible concentrations of negative oxygen interstitials. Additional experiments on samples with controlled stoichiometry could be per-formed to verify the influence of the reference data on the S(W ) plots.
ACKNOWLEDGMENTS
The authors are grateful to Marie-France Barthe and Ilja Makkonen for fruitful discussions.This research was supported by the basic research program on nuclear ma-terials of the Nuclear Energy Division at CEA, RCOMB.
6
This work was partly performed using HPC resources from GENCI-CCRT (Grant x2015096008).
1
M. J. Puska and R. M. Nieminen, Rev. Mod. Phys. 66, 841 (1994).
2 F. Tuomisto and I. Makkonen, Rev. Mod. Phys. 85,
1583 (2013), URL http://link.aps.org/doi/10.1103/ RevModPhys.85.1583.
3 J. Wiktor, M.-F. Barthe, G. Jomard, M. Torrent,
M. Freyss, and M. Bertolus, Phys. Rev. B 90, 184101 (2014).
4 M.-F. Barthe, P. Desgardin, G. Blondiaux, S. Guilbert,
H. Labrim, T. Sauvage, G. Carlot, P. Garcia, and J. P. Piron, in Mater. Sci. Forum (2004), vol. 445, p. 48.
5 H. Labrim, M.-F. Barthe, P. Desgardin, T. Sauvage,
G. Blondiaux, C. Corbel, and J. P. Piron, App. Surf. Sci. 252, 3256 (2006).
6
M.-F. Barthe, H. Labrim, A. Gentils, P. Desgardin, C. Cor-bel, S. Esnouf, and J. P. Piron, Phys. Status Solidi C 4, 3627 (2007).
7
H. Labrim, M.-F. Barthe, P. Desgardin, T. Sauvage, C. Corbel, G. Blondiaux, and J. P. Piron, Nucl. Instrum. Meth. B 261, 883 (2007).
8
N. Djourelov, B. Marchand, H. Marinov, N. Moncoffre, Y. Pipon, P. N´ed´elec, N. Toulhoat, and D. Sillou, J. Nucl. Mater. (2012).
9
N. Djourelov, B. Marchand, H. Marinov, N. Moncoffre, Y. Pipon, N. B´ererd, P. N´ed´elec, L. Raimbault, and T. Epicier, J. Nucl. Mater. 443, 562 (2013).
10
R. M. Nieminen, E. Boro´nski, and L. J. Lantto, Phys. Rev. B 32, 1377 (1985).
11 E. Boro´nski and R. M. Nieminen, Phys. Rev. B 34, 3820
(1986).
12
P. E. Bl¨ochl, Phys. Rev. B 50, 17953 (1994), URLhttp: //link.aps.org/doi/10.1103/PhysRevB.50.17953.
13
G. Kresse and D. Joubert, Phys. Rev. B 59, 1758 (1999), URL http://link.aps.org/doi/10.1103/PhysRevB.59. 1758.
14
N. A. W. Holzwarth, A. R. Tackett, and G. E. Matthews, Comput. Phys. Commun. 135, 329 (2001).
15 M. Torrent, F. Jollet, F. Bottin, G. Z´erah, and X. Gonze,
Comp. Mater. Sci. 42, 337 (2008).
16
X. Gonze, G.-M. Rignanese, M. Verstraete, J.-M. Beuke, Y. Pouillon, R. Caracas, F. Jollet, M. Torrent, G. Z´erah, M. Mikami, et al., Zeit. Kristallogr. 220, 558 (2005).
17
X. Gonze, J.-M. Beuken, R. Caracas, F. Detraux, M. Fuchs, G.-M. Rignanese, L. Sindic, M. Verstraete, G. Z´erah, F. Jollet, et al., Comp. Mater. Sci. 25, 478 (2002).
18
X. Gonze, B. Amadon, P.-M. Anglade, J.-M. Beuken, F. Bottin, P. Boulanger, F. Bruneval, D. Caliste, R. Cara-cas, M. Cˆot´e, et al., Comput. Phys. Commun. 180, 2582 (2009).
19 J. Wiktor, G. Jomard, and M. Torrent, Phys. Rev. B 92,
125113 (2015), URLhttp://link.aps.org/doi/10.1103/ PhysRevB.92.125113.
20 M. Alatalo, B. Barbiellini, M. Hakala, H. Kauppinen,
T. Korhonen, M. J. Puska, K. Saarinen, P. Hautoj¨arvi, and R. M. Nieminen, Phys. Rev. B 54, 2397 (1996).
21
J. Arponen and E. Pajanne, J. Phys. F: Met. Phys. 9, 2359 (1979).
22 M. J. Puska, A. P. Seitsonen, and R. M. Nieminen, Phys.
Rev. B 52, 10947 (1995).
23
J. Wiktor, G. Jomard, M. Torrent, and M. Bertolus, Phys. Rev. B 87, 235207 (2013), URL http://link.aps.org/ doi/10.1103/PhysRevB.87.235207.
24
J. Wiktor, G. Jomard, and M. Bertolus, Nucl. Instrum. Meth. B 327, 63 (2014), URL http: //www.sciencedirect.com/science/article/pii/ S0168583X14001529.
25 J. Wiktor, X. Kerbiriou, G. Jomard, S. Esnouf, M.-F.
Barthe, and M. Bertolus, Phys. Rev. B 89, 155203 (2014).
26
J. P. Perdew, K. Burke, and M. Ernzerhof, Phys. Rev. Lett. 77, 3865 (1996), URL http://link.aps.org/doi/ 10.1103/PhysRevLett.77.3865.
27
A. I. Liechtenstein, V. I. Anisimov, and J. Zaanen, Phys. Rev. B 52, R5467 (1995), URL http://link.aps.org/ doi/10.1103/PhysRevB.52.R5467.
28
S. L. Dudarev, D. N. Manh, and A. P. Sutton, Phil. Mag. B 75, 613 (1997).
29 B. Dorado, G. Jomard, M. Freyss, and M. Bertolus, Phys.
Rev. B 82, 035114 (2010).
30
B. Dorado, D. A. Andersson, C. R. Stanek, M. Bertolus, B. P. Uberuaga, G. Martin, M. Freyss, and P. Garcia, Phys. Rev. B 86, 035110 (2012), URL http://link.aps.org/ doi/10.1103/PhysRevB.86.035110.
31
B. Dorado, B. Amadon, M. Freyss, and M. Bertolus, Phys. Rev. B 79, 235125 (2009), URL http://link.aps.org/ doi/10.1103/PhysRevB.79.235125.
32
E. Vathonne, J. Wiktor, M. Freyss, G. Jomard, and M. Bertolus, J. Phys.: Condens. Mat. 26, 325501 (2014).
33
A. Kotani and T. Yamazaki, Prog. Theor. Phys. Suppl. 108, 117 (1992).
34 G. Jomard, B. Amadon, F. m. c. Bottin, and M. Torrent,
Phys. Rev. B 78, 075125 (2008), URLhttp://link.aps. org/doi/10.1103/PhysRevB.78.075125.
35 B. Amadon, F. Jollet, and M. Torrent, Phys. Rev. B 77,
155104 (2008), URLhttp://link.aps.org/doi/10.1103/ PhysRevB.77.155104.
36
R. Laskowski, G. K. H. Madsen, P. Blaha, and K. Schwarz, Phys. Rev. B 69, 140408 (2004), URLhttp://link.aps. org/doi/10.1103/PhysRevB.69.140408.
37
P. Santini, R. Lemanski, and P. Erd˝os, Advances in Physics 48, 537 (1999).
38
P. Santini, S. Carretta, G. Amoretti, R. Caciuffo, N. Mag-nani, and G. H. Lander, Reviews of Modern Physics 81, 807 (2009).
39
B. Dorado and P. Garcia, Physical Review B 87, 195139 (2013).
40 T. Korhonen, M. J. Puska, and R. M. Nieminen, Phys.
Rev. B 54, 15016 (1996).
41
A. Kokalj, J. Mol. Graph. Model. 17, 176 (1999).