HAL Id: hal-00719908
https://hal.archives-ouvertes.fr/hal-00719908v3
Submitted on 26 Jul 2012
HAL is a multi-disciplinary open access
archive for the deposit and dissemination of
sci-entific research documents, whether they are
pub-lished or not. The documents may come from
teaching and research institutions in France or
abroad, or from public or private research centers.
L’archive ouverte pluridisciplinaire HAL, est
destinée au dépôt et à la diffusion de documents
scientifiques de niveau recherche, publiés ou non,
émanant des établissements d’enseignement et de
recherche français ou étrangers, des laboratoires
publics ou privés.
The expanding dusty bipolar nebula around the nova
V1280 Sco
Olivier Chesneau, Eric Lagadec, M. Otulakowska-Hypka, D. P. K. Banerjee,
C.E. Woodward, E. Harvey, A. Spang, P. Kervella, F. Millour, N. Nardetto, et
al.
To cite this version:
Olivier Chesneau, Eric Lagadec, M. Otulakowska-Hypka, D. P. K. Banerjee, C.E. Woodward, et al..
The expanding dusty bipolar nebula around the nova V1280 Sco. Astronomy and Astrophysics - A&A,
EDP Sciences, 2012, pp.1. �hal-00719908v3�
Astronomy & Astrophysicsmanuscript no. V1280Sco˙vDef c ESO 2012 July 26, 2012
The expanding dusty bipolar nebula around the nova V1280 Sco
⋆
O. Chesneau
1, E. Lagadec
2, M. Otulakowska-Hypka
3, D.P.K. Banerjee
4, C.E. Woodward
5, E. Harvey
1, A. Spang
1,
P. Kervella
6, F. Millour
1, N. Nardetto
1, N.M. Ashok
4, M.J. Barlow
7, M. Bode
8, A. Evans
9, D.K. Lynch
10, T.J. O’Brien
11,
R.J. Rudy
10, and R.W. Russel
101 Laboratoire Lagrange, UMR7293, Univ. Nice Sophia-Antipolis, CNRS, Observatoire de la Cˆote d’Azur, 06300 Nice, France e-mail: [email protected]
2 European Southern Observatory, Karl-Schwarzschild-Strasse 2 D-85748 Garching bei M¨unchen, Germany 3 N. Copernicus Astronomical Center, Polish Academy of Sciences, Bartycka 18, 00-716 Warsaw, Poland 4 Physical Research Laboratory, Navrangpura, Ahmedabad, Gujarat, India
5 Minnesota Institute for Astrophysics, University of Minnesota, Minneapolis, MN 55455, USA
6 LESIA, Observatoire de Paris, CNRS UMR 8109, UPMC, Universit´e Paris Diderot, 5 place J. Janssen, F-92195 Meudon, France 7 Department of Physics and Astronomy, University College London, Gower Street, London WC1E 6BT
8 Astrophysics Research Institute, Liverpool John Moores University, Birkenhead, CH41 1LD, UK 9 Astrophysics Group, Keele University, Keele, Staffordshire ST5 5BG
10 Space Science Applications Laboratory, The Aerospace Corporation, M2/266, P.O. Box 92957, Los Angeles, CA 90009
11 Jodrell Bank Cent. for Astrophysics, School of Physics and Astronomy, Univ. of Manchester, Oxford Road, Manchester M13 9PL Received ;accepted
ABSTRACT
Context.The fast temporal evolution of the ejecta morphology of novae can be considered as an important test bench for studying the shaping of many kinds of nebulae. V1280 Sco is one of the slowest dust-forming nova ever historically observed that has experienced a particularly long common-envelope phase.
Aims.We performed multi-epoch high-spatial resolution observations of the circumstellar dusty environment of V1280 Sco to inves-tigate the level of asymmetry of the ejecta.
Methods.We observed V1280 Sco in 2009, 2010 and 2011 (from t=877 days after discovery until t=1664 d) using unprecedented high angular resolution techniques. We used the NACO/VLT adaptive optics system in the J, H and K bands, together with contempo-raneous VISIR/VLT mid-IR imaging that resolved the dust envelope of V1280 Sco, and SINFONI/VLT observations secured in 2011.
Results.We report the discovery of a dusty hourglass-shaped bipolar nebula. The apparent size of the nebula increased from 0.30”x 0.17” in July 2009 to 0.64”x 0.42” in July 2011. The aspect ratio suggests that the source is seen at high inclination. The central source shines efficiently in the K band and represents more than 56±5% of the total flux in 2009, and 87±6% in 2011. A mean expansion rate of 0.39±0.03 milliarcsec per day is inferred from the VISIR observations in the direction of the major axis, which represents a projected upper limit. Assuming that the dust shell expands in that direction as fast as the low-excitation slow ejecta detected in spectroscopy, this yields a lower limit distance to V1280 Sco of ∼ 1 kpc; however, the systematic errors remain large due to the complex shape and velocity field of the dusty ejecta. The dust seems to reside essentially in the polar caps and no infrared flux is detected in the equatorial regions in the latest dataset. This may imply that the mass-loss was dominantly polar.
Conclusions.V1280 Sco is an excellent test case for studying the temporal evolution of dusty bipolar ejecta. As the nebula expands, observations will be easier and we advocate a yearly monitoring of the source using high angular resolution techniques.
Key words.Techniques: high angular resolution; (Stars:) novae, cataclysmic variables;individual: V1280 Sco; Stars: circumstellar matter; Stars: mass-loss
1. Introduction
White dwarfs (WDs) are the end products of the evolution of low- and intermediate-mass stars, with initial masses between 0.8 and 8 M⊙. If a white dwarf is in a close binary system, it can accrete hydrogen from its close companion’s atmosphere, which then triggers the ignition of runaway nuclear reaction. This leads to a bright outburst, called a classical nova.
The classical nova V1280 Sco was discovered in outburst by Yamaoka et al. (2007) on 2007 February 04.86 (JD = 2 454 136.85), about 12 days before reaching its maximum in visual
Send offprint requests to: O. Chesneau
⋆ Based on observations made with ESO telescopes at the Silla Paranal Observatory under programme IDs 283.D-5020, 385.D-0076, 087.D-0074
light (mV ∼4) and formed dust only two weeks after reaching
maximum in visible (Das et al. 2008). This nova experienced one of the slowest evolutions historically reported and the nebu-lar phase was entered about 50 months (t∼1600d) after outburst (Naito et al. 2012). This is a clear indication that the mass of the
erupting WD is low (i.e. ∼0.6M⊙ or even smaller).
Extensive monitoring of the event was performed using the Very Large Telescope Interferometer (VLTI) during the first four months (until t=145d) of the event (Chesneau et al. 2008). Owing to the sparse uv coverage, an interpretation involving a spherical dusty shell was developed, providing estimates of the dust formation rate. Based on an estimate of the total dust mass formed during the 250 days after outburst, Chesneau et al. (2008)
suggested that a mass as large as 10−4 M
⊙was ejected. Naito
oxy-gen lines that confirmed the high mass ejected, an additional ar-gument for a low-mass WD progenitor, known to statistically eject more mass that fast, massive ones. The interferometric ob-servations also provided a consistent picture of the expansion rate in the plane of the sky estimated at 0.35 mas/d. Radial ve-locities were published by Das et al. (2008) in the near-IR do-main, and by Sadakane et al. (2010) in the visible. Sadakane et al. (2010) reported multiple high-velocity narrow components
in the NaI D line from 650 to 900 km.s−1. They interpreted this
as being due to the formation of clumps, as a consequence of a strong shock between the slow, dust-forming ejecta, and a fast
wind (∼ 2000 km.s−1) generated during the second brightening
of the source (Chesneau et al. 2008, t=110d). P-Cygni lines were systematically observed even four years after the outburst, which is indicative of a sustained and significant mass loss (Schwarz et al. 2011). The typical P-Cygni type velocities reached 500
km.s−1, from which Chesneau et al. (2008) inferred a distance of
1.6±0.4kpc. However, Hounsell et al. (2010) recently derived a distance of 630±100 pc from space-based visual light curves that span the first 20 days after discovery. This much smaller distance estimate demands that the VLTI-derived distance be scrutinized. Using the spatial expansion rate from the VLTI but a revised
velocity range of the dust-forming ejecta of 350±160km · s−1
based on the mean velocity measured from blue-shifted absorp-tion lines of OI and SiII, Naito et al. (2012) derived a revised distance of 1.1±0.5kpc.
The dust event and the large amount of circumstellar mate-rial prevented any X-ray detection of V1280 Sco until May 2009, t=834d (Ness et al. 2009). After this date the source was detected several times from t=834d to t=939d after outburst (Schwarz et al. 2011), although the dense ejecta considerably absorbed the potentially important X-ray flux.
We report on observations of the Very Large Telescope per-formed between 2009 (t=857d) and 2011 (t=1664d) that reveal a striking bipolar nebula in expansion. The very slow ejecta of V1280 Sco likely expanded while being significantly influenced by the companion, although an intrinsically polar-oriented ejec-tion scenario must also be investigated. This is a unique oppor-tunity to observe a newly formed bipolar nebula. Our study has a broader relevance in the context of the shaping of asymmetri-cal bipolar nebulae and the formation of disks, such as that seen in some planetary or pre-planetary nebulae (Chesneau 2011; De Marco & Soker 2011; Lykou et al. 2011; Chesneau et al. 2007), born-again sources (Lau et al. 2011; Chesneau et al. 2009) or in massive stars (Millour et al. 2011; Meilland et al. 2010; Kastner et al. 2010; Kraus et al. 2010) and for a better understanding of the still poorly known common-envelope phenomenon (de Marco et al. 2011).
The observations are presented in Sect. 2. In Sect. 3 we de-rive some physical parameters of the nebula, and we discuss our results in Sect. 4.
2. Observations
The source was observed with the NACO, VISIR and SINFONI instruments of the Very Large Telescope (VLT). The log of the observation is shown in Table 1 and the visible light curve is reproduced in Fig.1.
2.1. NACO observations
We observed V1280 Sco in J, H, Ks with the S13 camera, which provides a field of view (FOV) of 14”x14” and a pixel scale of
Fig. 1. Visual light curve of V1280 Sco from AFOEV and ASAS-3 data with the dates of the VLTI and VLT observations.
Table 1. NACO/VLT, VISIR/VLT and SINFONI/VLT observing logs. Date day1 SCI/CAL Inst. Filters
2009.07.02 877 V1280 Sco NACO J, H, K
2009.07.02 877 PSF 12 NACO J, H, K
2009.07.03 878 V1280 Sco VISIR4 N band filters5
2009.07.03 878 PSF 23 VISIR4 N band filters5
2010.06.17 1228 V1280 Sco NACO4 J, H, K
2010.06.17 1228 PSF 13 NACO4 J, H, K
2010.07.28 1254 V1280 Sco VISIR4 N band filters5
2010.07.28 1254 PSF 23 VISIR4 N band filters5
2011.05.21 1566 V1280 Sco SINFONI H, K
2011.06.13 1589 V1280 Sco VISIR4 N band filters5
2011.06.13 1589 PSF 23 VISIR4 N band filters5
2011.06.26 1602 V1280 Sco SINFONI K 2011.06.27 1603 V1280 Sco SINFONI K 2011.07.03 1609 V1280 Sco SINFONI H, K 2011.07.03 1609 V1280 Sco SINFONI H, K 2011.08.26 1663 V1280 Sco SINFONI H, K 2011.08.28 1664 V1280 Sco SINFONI H, K 1 Day after outburst
2 GSC 07364-01316, J=8.29±0.03, H=7.68±0.07, 7.48±0.02 3 HD152934, M5V, V=11, K=2.46, IRAS f12= 8.19 Jy 4 Burst mode 5 PAH1, λ=8.59µm, ∆λ=0.42µm; ArIII, λ=8.99µm, ∆λ=0.14µm; PAH2, λ=11.25µm, ∆λ=0.59µm; PAH2 2, λ=11.88µm, ∆λ=0.37µm; NeII, λ=12.81µm, ∆λ=0.21µm; NeII 1, λ=12.27µm, ∆λ=0.18µm
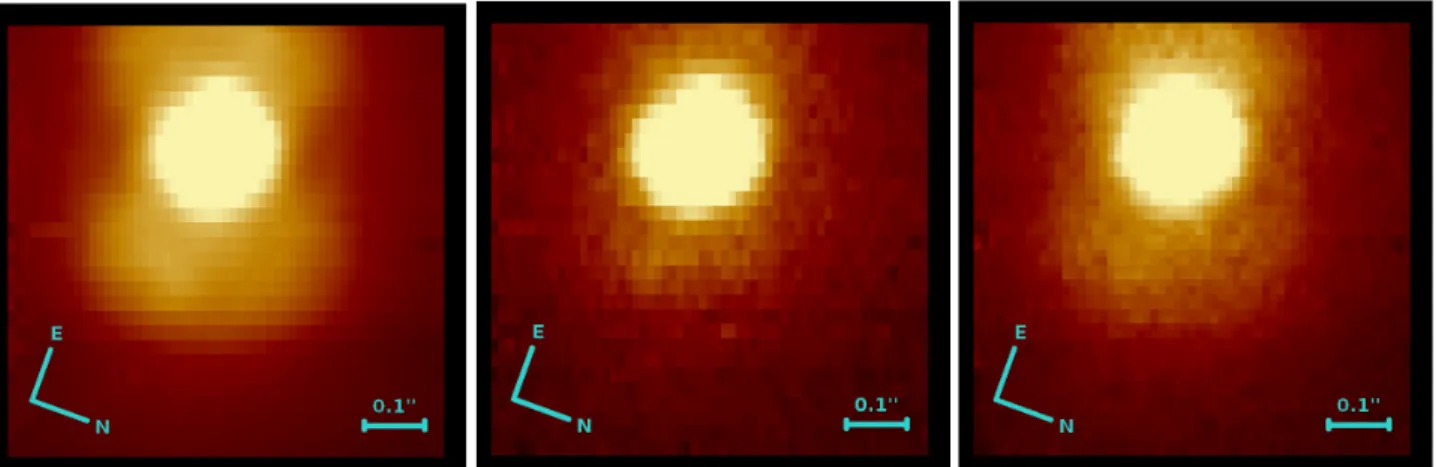
13.26±0.03 mas. The AutoJitter mode was used in which the telescope moves according to a random pattern in a 5” box at each exposure. The nearby star GSC 07364-01316 (Lasker et al. 2008) was selected as the reference star for the visible wave-front sensor of the adaptive optics (AO) for determining the point spread function (PSF) of the instrument and to serve as a rough flux calibrator. The PSF obtained in 2009 with NACO in standard mode was not good enough to allow a meaningful deconvolution of the compact source. In 2010, the NACO ob-servations benefited from the newly implemented ’cube mode’, which provides a large set of short exposures (30ms) over part of the detector. 8000 frames were recorded per filter, representing an exposure time of 480s each. This new capability is essential to reach truly diffraction-limited imaging at the shortest wave-lengths (Kervella et al. 2009). The cube mode provides a large cube of short exposures from which a sub-set with the highest Strehl ratio is selected (principle of ’lucky imaging’).
Chesneau, Lagadec et al.: A bipolar dusty nebula around the nova V1280 Sco 3
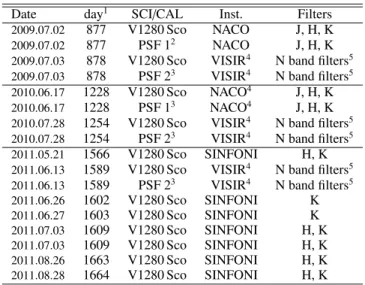
Fig. 2. Left: Normalized 2009 K band NACO image of V1280 Sco in logarithmic scale. Right: Same for the calibrator.
2.2. VISIR observations
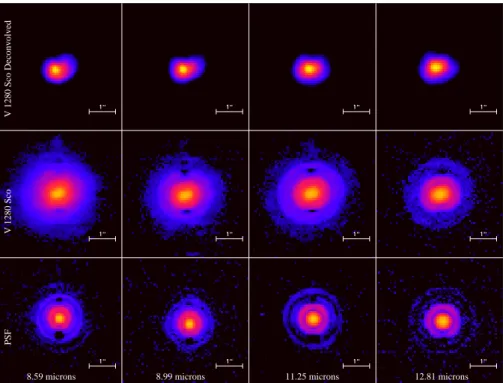
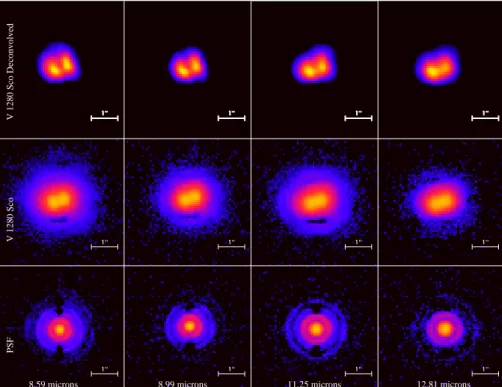
The NACO observations were complemented by mid-infrared images obtained with the VISIR instrument (Lagage et al. 2004). The VISIR observations were performed in July 2009 (MJD 55014.2 and 55015.1, t=877-878d), June and July 2010 (t=1228d and t=1254d) and June 2011 (t=1589d). The atmo-spheric conditions were stable for all nights. The imager was used in burst mode (DIT ranging from 10 to 25 ms), provid-ing a pixel scale of 0.075” and a field of view of 19.2” x 19.2”. The chopping throw was 8 arcsec and the chopping fre-quency 0.25 Hz. A set of narrow-band filters covering the full N band were used, with integrated total exposure times per fil-ter ranging from 280s to 360s. Several filfil-ters were cenfil-tered on potential spectral features: PAH1, PAH2 and NeII. The ex-posures taken with the PAH2 (λ=11.25µm, ∆λ=0.59µm) and NeII filters (λ=12.81µm, ∆λ=0.21µm) were immediately fol-lowed by exposures taken with a nearby continuum filter called PAH2 2 (λ=11.88µm, ∆λ=0.37µm) and NeII 1 (λ=12.27µm, ∆λ=0.18µm).
The standard chopping/nodding technique was applied to re-move the sky contribution. The burst mode provides a large cube of short-exposure frames in which all single chopping and nod-ding images recorded. The reduction of the VISIR data addi-tionally includes the correction of various defects exhibited by the VISIR detector.
The VISIR burst mode and NACO cube modes are very sim-ilar. The principle is to acquire very short exposures (≤50 ms) to keep the complete integration within a fraction of the coher-ence time (∼300 ms at Paranal in the mid-IR). The burst modes of NACO and VISIR provided large cubes of short exposures that enable the reconstruction of quality-enhanced images using shift-and-add techniques, and selecting the best percentile (lucky imaging) following an algorithm described by Kervella et al. (2009) and Lagadec et al. (2011). The VISIR burst mode im-ages of V1280 Sco were deconvolved using a Richardson-Lucy algorithm. Thirty iterations were sufficient to obtain good quality converged images. The VISIR images are shown in Fig.5 (2009), Fig.6 (2010) and Fig.7 (2011).
Flux calibration was performed using standard aperture pho-tometry methods applied to the science and reference stars. The observations were performed in fairly similar atmospheric con-ditions and the raw fluxes observed per filter using the same
cal-ibrator are similar at better than 5%. Unfortunately, the VISIR PSF calibrator, HD 152934, was chosen for its brightness but was a poorly suited photometric calibrator. HD 152934 is an anonymous S-type AGB star whose spectral type is not well con-strained. We used synthetic templates of S-type stars produced by the MARCS codes (Gustafsson et al. 2008) to fit the SED of HD 152934. We then estimated the flux in the VISIR filters using
the best synthetic spectrum (Te f f =3000 K and logg = 0) and
calibrated the science object photometrically. This procedure is indirect and leads to a potential calibration bias larger than 10% in some filters for such a complex source.
2.3. SINFONI observations
VLT/SINFONI is a near-infrared (1.1 - 2.45 µm) integral field spectrograph (IFS) fed by an AO module (Eisenhauer et al. 2003). Integral field spectroscopy allows one to gather spectra of the sky over a two-dimensional field of view. Final products are data cubes with two dimensions of x, y and a third dimen-sion formed by the wavelengths. During our observations the spectrograph operated in the K and H bands, providing a spec-tral resolution of 4000 and 3000, respectively. The FOV was cut into 32 slices, and each slice was projected onto 64 detec-tor pixels. The field of view of the data set is 0.8”×0.8” and is composed of spaxels of 12.5×25 mas in the K and H bands. We obtained several VLT/SINFONI integral field spectroscopic data sets for V1280 Sco from May to August 2011. The FOV was oriented such that the major axis of the nebula roughly coin-cided with the vertical direction. During that period, the central stellar-like source increased considerably in flux, while the bipo-lar nebula in which this source is embedded had a spatial extent of ≤0.7” which made these observations challenging. The ob-servations were performed in service mode and were repeated several times, but the atmospheric conditions never met the cri-teria for providing good quality data. We nevertheless worked on the best data of the sample and present the most robust results. The data set of 26 June 2011 exhibited the better signal-to-noise ratio (S/N) although the bipolar nebula was slightly cut in the north. Because of the limited S/N of the observations and the difficult removal of the telluric lines, a differential approach, us-ing a comparison between a given emission line flux and its cor-responding adjacent continuum was employed in the reduction and analysis.
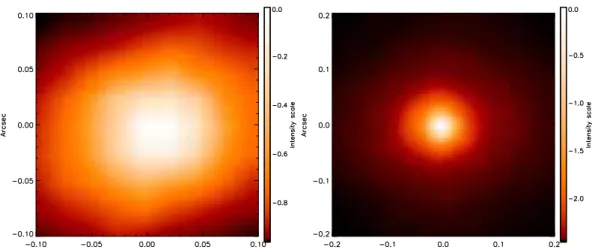
Fig. 3. Upper left: Normalized 2010 J band NACO image of V1280 Sco in logarithmic scale. Upper right: 2010 J band NACO image of the calibrator. Middle: Same in the H band. Bottom: Same in the K band. A significant brightening of the central source (unresolved) is observed compared to 2009 (Fig.2).
3. Observational results
3.1. The dusty nebula
A bipolar nebula with a high aspect ratio is clearly seen in the NACO, SINFONI and VISIR images we obtained, suggesting
that the source is seen at high inclination. For our NACO and SINFONI data, the nebula extension was estimated by deter-mining the regions of images with the highest gradient before reaching the noise level (or written differently, by the regions of densest contour levels before reaching the noise level). The
Chesneau, Lagadec et al.: A bipolar dusty nebula around the nova V1280 Sco 5
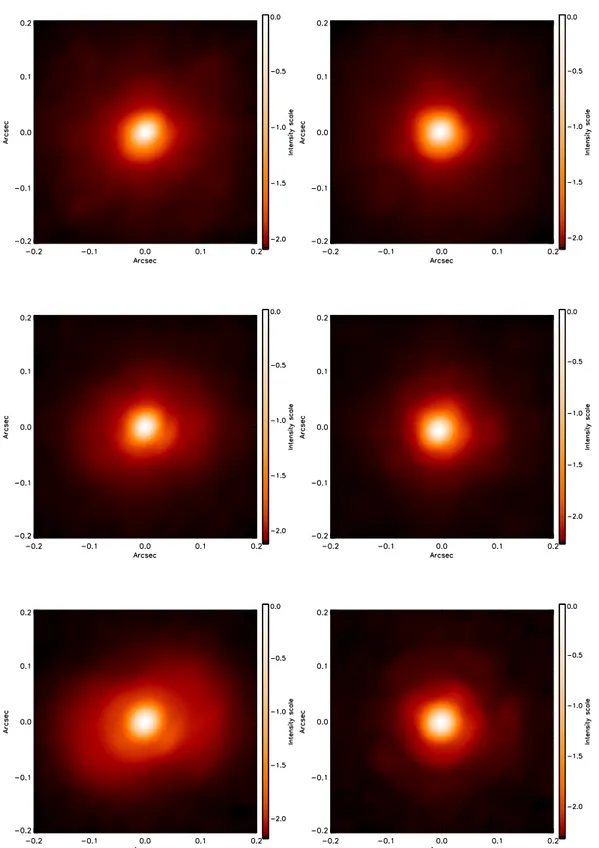
Fig. 4. 2010 NACO K band image after a PSF subtraction. The color table is inverted.
estimation was performed on the images with and without PSF subtraction. The extensions measured are reported in Table 2.
The near-IR images were dominated by the central source, which brightened considerably over the three years of observa-tions. The apparent size in the K band was 304 x 191 mas in 2009 (t = 877d). Corrected for the PSF extension, this leads to an angular size of 290±38 x 167±31 mas. After a PSF
subtrac-tion, the position angle (PA) of the major axis is as 105 ± 5◦with
an axial ratio as ∼ 1.7. However a good estimate of the minor axis extension was difficult to obtain due to the bright central source, and the artifacts remaining after the PSF subtraction.
The NACO observations performed in cube mode in 2010 (t
=1228d) were of excellent quality, and the J, H and K bands
can be fully exploited. An elongation was clearly detected in
each image at PA=105±3◦, 102±3◦and 107±3◦. For instance, the
FWHM of the J band image of V1280 Sco is 61±3mas along the major axis, and 54±3 along the minor axis. The apparent size in the K band was 404 x 260 mas, which, corrected for the FWHM of the PSF, corresponds to 400±30 x 255±24 mas.
The 2011 SINFONI images (t = 1602d) suggest that the source is composed of a bright unresolved source and two appar-ently well-detached polar caps. There seems to be no indication for extended equatorial material. The extension of the nebula in the direction of the major axis is estimated to be 637±13mas, and the larger extent of the caps perpendicular to the major axis to be 412±13mas (Fig.9 and Table 2).
The VISIR images also provided robust estimates of the PA
at 108.5±2◦ in 2009, 109.1±1.6◦ in 2010 and 108.9±2.5◦ in
2011. The bipolar morphology of our VISIR images was more clearly seen in the most recent images due in part to the expan-sion of the nebula. Fig.8 (left) shows a cut of the VISIR im-ages obtained at 8.59 µm in 2009, 2010 and 2011, together with a PSF for comparison. This filter provides the shortest wave-length, hence the best spatial resolution of VISIR and was there-fore used for providing the extension estimates (Table 2). The bipolar lobes of V1280 Sco are clearly expanding with time, and in 2011, one could see a double peaked cut generated by the two emission peaks of the bipolar nebula. One-dimensional Gaussian fitting was performed to measure the FWHM of the cuts, and the results are shown in Table 2. After deconvolution, the VISIR images provide a size and an axial ratio equivalent to that seen in the near-IR. The size and appearance of the nebula extension
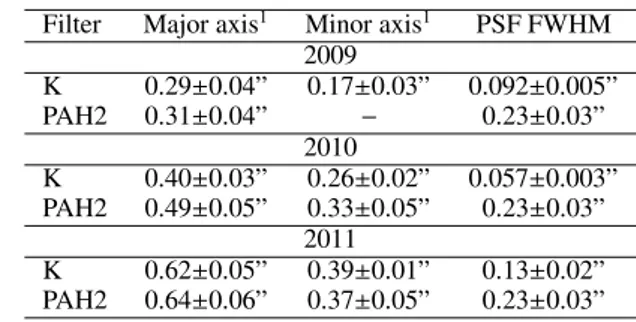
Table 2. Extensions of the bipolar nebulae.
Filter Major axis1 Minor axis1 PSF FWHM 2009 K 0.29±0.04” 0.17±0.03” 0.092±0.005” PAH2 0.31±0.04” − 0.23±0.03” 2010 K 0.40±0.03” 0.26±0.02” 0.057±0.003” PAH2 0.49±0.05” 0.33±0.05” 0.23±0.03” 2011 K 0.62±0.05” 0.39±0.01” 0.13±0.02” PAH2 0.64±0.06” 0.37±0.05” 0.23±0.03” 1 Corrected for the FWHM of the PSF
was nearly unchanged from 8 to 13 micron. The deconvolved im-ages confirm that the object is bipolar and expanding. Our most resolved images (from our 2011 dataset) show that the intensi-ties of the two bipolar lobes are different, the southern lobe is brighter. This is probably due to an absorption effect as a conse-quence of this lobe being closer to us than the northern one. No mid-IR emission is seen between the caps. Fig.8 shows a radial cut along the poles at 8.59. 8.99, 11.25, and 12.81 µm. The sepa-ration between the two lobes does not depend on the wavelength. The ratio of the intensity between the two peaks increases with wavelength due to absorption and optical depth effects.
3.2. Spectroscopy and flux measurements
The V flux has reached a roughly stable plateau at a magnitude of about 10.5 over a long period (Naito et al. 2012) and the cen-tral source radiates efficiently in the K band. As shown by Lynch et al. (2009), the nova is still powering a strong wind, and exten-sive nuclear burning is thus thought to have continued.
An unresolved point source dominates the near-IR observa-tions, whereas no point source contribution is observable in the mid-IR for the contemporaneous VISIR measurements. In 2009, the stellar source (i.e. the unresolved flux) accounts for 54±6%, increasing in 2010 to reach 76±6% (NACO data) and in 2011 87±5% (SINFONI) of the total flux. These numbers are poten-tially biased by the different Strehl ratio reached by the AOs dur-ing the observations. These estimates were also possible in the H and J bands for the 2010 NACO observations, with 96±3% and 100±3%, respectively. This increase of the central source contribution indicates a decrease of the circumstellar absorption, related probably to the expansion and dissipation of the nearby dust.
The photometry of the central source and its nearby environ-ment was performed from the NACO, SINFONI and VISIR im-ages and is provided in Table 3. These instruments or the mode used are not necessarily optimized to provide accurate photom-etry but despite the level of errors such information remains of high interest for these variable sources.
Many lines are detected by SINFONI (t=1609d). Of impor-tance is the simultaneous detection of relatively high-excitation lines (mostly from the Balmer series), and the detection of low ionization species such as NaI and MgI, as already reported by Das et al. (2008) and Sadakane et al. (2010) for this source.
The mean FWHM of the Balmer lines is 162±14km · s−1, and
we note that Brγ exhibits a broad pedestal (∼700km · s−1).
Some lines of low excitations are observed, the NaI 2.149 line
(FWHM=110±18km·s−1), MgI 1.711 (FWHM=144±8km·s−1),
V 1280 Sco
PSF
8.59 microns 8.99 microns 11.25 microns 12.81 microns
V 1280 Sco Deconvolved
Fig. 5. Burst-mode VISIR observations performed in 2009 (t=878d) with four different filters (see description in Table 1). Up: Deconvolved images of V1280 Sco. Middle: Mean images generated from the best short exposures of V1280 Sco. Bottom: Mean images of the PSF with the same treatment.
V 1280 Sco
PSF
8.59 microns 8.99 microns 11.25 microns 12.81 microns
V 1280 Sco Deconvolved
Fig. 6. Same for the VISIR observations performed in 2010 (t = 1254d)
and some with weak signatures such as MgI 1.576, CI 1.690, as reported by Das et al. (2008). These lines are narrow and al-most unresolved given the spectral resolution of these
obser-vations (R∼3500 corresponding to a FWHM of 85km · s−1).
The presence of the NaI 2.149 line implies that the NaI must be protected from the central source, and is therefore very likely located within the dust. The presence of these low-excitation lines so late (t=1609d) after the outburst highlights how slowly V1280 Sco has evolved, because these lines are not expected at this stage.
For the strongest lines, a SINFONI image was created by in-tegrating the flux within a narrow spectral range, and by subtract-ing a red- and blue-sided continuum. For the Brγ line, the main source of the emission is observed in the central object, which contributes 98±7% of the total flux. A slightly different behavior may be observed for the He I 2.06 µm (see Fig.9) line for which the core contributes 93±7%, and for which the lobes seem better contrasted. In the case of V1280 Sco, one may hypothesize that the He I 2.06 µm emission in the caps could arise either from a shock between the fast nova wind and the slowly expanding,
Chesneau, Lagadec et al.: A bipolar dusty nebula around the nova V1280 Sco 7
V 1280 Sco
PSF
8.59 microns 8.99 microns 11.25 microns 12.81 microns
V 1280 Sco Deconvolved
Fig. 7. Same for the VISIR observations performed in 2011 (t = 1589d)
Fig. 8. Left: Cut of the VISIR raw images at 8.59 µm along the major axis of the dust shell for the three epochs. An expansion of the dusty material is clearly seen. Right: Cut of the VISIR 2011 deconvolved images along the main axis of the dust shell for all filters.
dust rich polar caps, or by a radiative interaction between this material and the growing UV flux from the white dwarf.
The PAH 2 filter is designed to detect carbonaceous molecules. This filter is not best suited because the 11.25µm fea-ture in novae is seen at ∼11.4µm (Evans et al. 2005), although most of the flux should be isolated by the filter given the band-width (0.59µm). Yet, it is challenging to detect any morpho-logical difference between images in the two filters because of the limited spatial resolution and the weakness of the flux con-trast. It is not evident that the regions of PAH emission is dis-tinct from that of the continuum. Spitzer IRS (6 May 2008) and
IRTF/Spex (20 May 2009) observations show that dust emission features appeared at 3.28, 3.4, 8.3, 8.7, and 11.4 microns, the so-called UIRs (unidentified infrared bands). Likely, carbonaceous molecules also formed in situ from condensed dust (Bernstein & Lynch 2009; Evans et al. 2010, 2005, HAC).
3.3. The expansion rate
In the near-IR, the datasets are not homogeneous with images taken with NACO in 2009 without cube mode, then in 2010 in cube mode and in 2011 using the SINFONI instrument. We
Table 3. Photometry of the total source.
Filter λ0 t = 878d t = 1254d t = 1589 [micron] [Jy] [Jy] [Jy] J 1.05 - 0.38±0.07 -H 1.65 - 0.44±0.04 -K 2.1 0.67±0.04 0.44±0.02 -PAH 1 8.59 47±6 34 ± 4 28± 4 ArIII 8.99 43±5 32 ± 4 26 ± 3 PAH 2 11.25 33±3 25±3 20±3 PAH 2 21 11.88 31±4 23±3 19±3 NeII 12.81 26±3 20±3 16±2 1 Filter dedicated to continuum measurements close to the PAH2
fil-ter.
did not attempt to derive an expansion rate for the lobes in the K band due to the variances in the observational techniques. Despite their lower spatial resolution, the images from the VISIR instrument were obtained solely in burst mode. Moreover, in the mid-IR, the central source is too faint to be detected, and the im-ages probe the contribution from the dust alone. The NACO and SINFONI images exhibit a bright stellar contribution that has to be carefully taken into account and removed before any ge-ometrical information can be inferred. The expansion was mea-sured from the raw and deconvolved VISIR images. Fig.8 shows the cuts of the images along the direction of the major axis and the results are shown in Table 2. Correcting the FWHMs from the FWHM of the PSF at 8.59µm, this leads to an estimate of the expansion rate of 0.36±0.06 (2009), 0.39±0.05 (2010) and 0.40±0.04 (2011) mas per day, from which we infer a global es-timate of 0.39±0.03 mas per day. As an independent test, one can compute the separation of the polar caps as measured by SINFONI to be 0.62±0.05”at day 1602, providing an expansion rate very close to the VISIR measurements.
This value, measured in the direction of the major axis of the nebula is close to the expansion rate estimate of 0.35±0.03 mas per day from the VLTI in a similar wavelength range. The VLTI baselines used to infer the expansion of the early dusty envelope were in a direction close to the major axis of the nebula (within
typically 30◦), and therefore approximately probed the velocities
projected on the sky in that direction. The bias expected from the use of baselines not aligned to the major axis is an underestimate of the expansion rate.
4. Discussion
4.1. The distance and expansion velocities
Using the angular expansions measured from the infrared im-ages, one can try to improve upon the distance estimate for V1280 Sco. The angular expansion inferred from the VLTI ob-servations was 0.35±0.03 mas/d, while the high-quality VISIR images obtained in the study suggest a slightly higher expansion rate in the direction of the major axis of the nebula of 0.39±0.03 mas/d.
Combined with a measure of the ejecta expansion velocity, the angular expansion rate (mas/d) can be used to derive a dis-tance to V1280 Sco, under the hypothesis of a spherical ejection following Dkpc=1.154 × 10⁻³ Ve j dθ dt , (1)
where Ve jis the velocity of the ejecta in km · s−1 and dθdt is the
rate of expansion in mas per day.
Assuming a velocity Ve j for the ejecta of 500±100km.s−1,
Chesneau et al. (2008) estimated the distance to be 1.6±0.4 kpc. The difficulty of this exercise is to ensure that the Doppler velocities inferred from the emission lines can be linked to the dust expansion measured in the VLTI data or VISIR images. These quantities must be measured at the same wavelengths, if possible centered on an emission line that provides the kinemat-ics. Moreover, the Doppler velocities are translated into ejection velocities assuming a projection factor (the p factor) whose value depends on the kinematics but also on the flux distribution of the source.
The discovery of the strong bipolarity of the source implies a complex velocity field that cannot be directly related to a lim-ited number of velocity measurements. The expansion velocities were measured in the direction of the major axis of the bipolar
nebula and we adopted a Doppler velocity of 500km.s−1, based
on several radial velocity measurements from various emission lines. Co-mixing of the dust and gas emitting regions cannot be unequivocally demonstrated, and it is unknown whether the line-forming region coincides with the dust-continuum-forming region. Therefore, it is very difficult to measure the ejection ve-locity of the dusty nebula.
Hounsell et al. (2010) derived a much closer distance esti-mate, 630±100 pc based on various estimates of intrinsic lumi-nosity of the source. However, despite the quality of their pho-tometry, many parameters are used to infer the distance, some of them raised to high power indices, implying potentially large errors. Hounsell et al. (2010) found Mv = -6.1, yielding a dis-tance of ≤ 1kpc; however, they pointed out that Mv can be equal
to -8 based on t3estimated as 34 d, where t3 is the number of
days in which a nova wanes by 3 magnitudes after maximum. This value yields a distance of 1.4 kpc, which is within the un-certainty of the first estimate from Chesneau et al. (2008).
If one assumes the distance quoted by Hounsell et al. (2010),
the mean dust-forming region velocity is only ∼220km · s−1.
This velocity is the velocity measured in the plane of the sky, in the direction of the major axis. Owing to the high aspect ratio, a high inclination is expected, and this measurement should be considered as close to the upper limit of the velocity field, and one may consider whether such a slowly expanding material may imprint its signature in spectroscopic observations.
Sadakane et al. (2010) reported on spectroscopic information of great interest to this problem. They observed absorption in the
NaI lines detected between -649km · s−1to -885km · s−1with the
strongest components at -750 and -800km · s−1. One may
as-sume that these absorption features provide a good approxima-tion of the dust velocity field because they probe low-excitaapproxima-tion cool regions. Das et al. (2008) detected many lines from these low-ionization species (NaI and MgI) at the earliest stages of the event (i.e. at the onset of the dust-formation phase). The
impres-sive narrowness of the features (∼15km · s−1) can be interpreted
as originating from a cool medium. The measured FWHM can be considered as an upper limit, accounting for the
instrumen-tal FWHM of ∼5km · s−1. Hence, accounting for some
turbu-lence and velocity dispersion of the expanding material in the FWHM broadening, the thermal broadening may originate from material cooler than 1500 K. The Sadakane et al. (2010) observa-tions and the 2009 NACO/VISIR images were obtained almost at the same epoch in mid 2009. The slower absorbing material in the line of sight was moving in 2009 at a velocity of about
650km · s−1. Naito et al. (2012) reported on much lower
Chesneau, Lagadec et al.: A bipolar dusty nebula around the nova V1280 Sco 9
Fig. 9. Left: Continuum flux from a narrow spectral channel (2.7nm) close to the Brγ line. Middle: same from a channel centered on the Brγ line emission from which the nearby continuum shown on the left was removed. Right: same from a channel centered on the HeI2.05 line emission isolated from a nearby continuum. The Brγ line forming region is centered on the outbursting source, whereas some intrinsic HeI2.05 emission seems to originate from the lobes.
lines of OI and SiII. These low velocities were measured around
light-curve maximum and increased up to ∼500km · s−1 just
be-fore the dust-formation phase. Using the expansion of VISIR of 0.39±0.03 mas/d in the major axis direction and the slowest
ve-locities of the cool material of 350km · s−1, one still derives a
distance estimate close to 1.0kpc. This value is a lower estimate, since the velocities in the direction of the major axis of the bipo-lar nebula are expected to be higher, while the spectroscopically detected absorption components are seen in the line-of-sight di-rection. Lacking an accurate estimate of the inclination, we are left with this estimate which is potentially affected by larger er-rors.
To conclude, despite the significant limitations and errors that may affect the distance estimate of 1.6kpc±0.4 provided by Chesneau et al. (2008), we are reasonably confident that the dis-tance of V1280 Sco is much larger than the disdis-tance of 0.6kpc proposed by Hounsell et al. (2010).
4.2. Origin of the bipolarity
A growing body of observational evidence clearly suggests that many nova ejectae are highly bipolar in the first days and months after the outburst. The correlation between speed class and ejection velocity, meaning that the faster the expansion speed, the less shaped the remnant (Bode 2002; Downes & Duerbeck 2000), is an argument for supporting the significant effect of the common envelope phase on the shaping. The ejecta from a slow nova would feel the influence of the secondary much longer, leading to a strong common envelope interaction. These effects, involving frictional deposition of energy and angular momentum from the secondary are described by Kato & Hachisu (2011); Porter et al. (1998); Lloyd et al. (1997); Livio et al. (1990). The very slow nova HR Del (Moraes & Diaz 2009; Harman
& O’Brien 2003; Solf 1983, t3=230d) or V723 Cas (Lyke &
Campbell 2009; Evans et al. 2003, t3=180d) are striking
exam-ples of this phenomenon.
V1280 Sco appears to be at odds with the t3/axial ratio
re-lationship shown for instance in Fig.6 of Bode (2002). The axial ratio of V1280 Sco is high, surely higher than 1.5. Such high axial ratios are exhibited by the slowest novae in the diagram,
with t3>100d. Hounsell et al. (2010) estimated t3=34 days, yet
cautioned that the fidelity of this determination is weak owing to the complexity of the light curve, which is affected by the
dust and the secondary maximum. We cannot exclude that t3
might have been shorter, although given the distance estimate
of 1.6kpc that is favored in our study, t3 =34 d fits the
maxi-mum magnitude-rate of decline relation (MMRD) relatively well (Downes & Duerbeck 2000).
The late SINFONI images suggest that the dust resides only in the polar caps, and that the equatorial regions seem devoid of any dust in contrast to the bipolar helium nova V445 Pup for in-stance, which exhibits a large and dense dusty waist (Woudt et al. 2009). The VISIR last images confirm this since the two lobes appear to be clearly detached from each other in the deconvolved images without any sign of emission close to the equatorial plane (Fig.7). Chesneau et al. (2008) reported some evidence for a sig-nificant departure from spherical symmetries in the latest VLTI data (t=145d) from a baseline at more than 60 degree from the major axis. A re-inspection of the data shows that contrary to what was suggested by the authors, the measurements are not affected by any instrumental problem. An aspect ratio as high as 1.3 was probably observed implying that the shaping of the bipolar nebula was already well advanced at this time.
Two questions can be related to these observations. How can this polar ejection be the consequence of a common-envelope phase and what was the time scale of the event? With a differ-ent time and spatial scale context, the extreme bipolar planetary nebulae Mz3 and M2-9 can provide enlightening comparisons (Evans 2011). Most of the dust in Mz3 and M2-9 was found in the bipolar lobes (Lykou et al. 2011; Chesneau et al. 2007; Smith & Gehrz 2005) and recent observations suggest that the time scale of the formation of these nebulae must have been very short, i.e. a few years at most, in a context of a much slower ex-pected evolution of at least several centuries. Regarding M2-9, it is known that the core harbors a long-period binary (Corradi et al. 2011, P∼90yr). For these events, the small disks at the core of the systems and the dense lobes favor an intrinsically polar ejection. This hypothesis cannot be ruled out with the formation of the caps of V1280 Sco.
Another scenario implies an intrinsically a-spherical ejection that focuses the mass ejection toward the poles, in which a large-scale structured magnetic field may be the shaping key agent. The recent outburst of the recurrent nova T Pyx appeared to be highly bipolar (Chesneau et al. 2011). T Pyx shows a very stable photometric wave that may betray the existence of a magnetic field (Patterson et al. 1998). The presence of a strong magnetic
field of about a few MG might have had a non-negligible effect on the eruption, which is also highly suspected for V1500 Cyg stars (Oksanen & Schaefer 2011).
5. Conclusion
We monitored the evolution of the circumstellar material around the classical nova V1280 Sco using high angular resolution in-frared observations with the VLT. We resolved it for the first time with a single telescope with the NACO/VLT instrument in the near-infrared and VISIR/VLT in the mid-infrared in 2009, two years after the outburst.
These observations revealed a bipolar-shaped nebula around the nova, with dust present mostly in the lobes of the nebula. The high aspect ratio of the nebula suggests that it is seen at high inclination.
More similar VISIR observations were taken in 2010 and 2011, together with IFU observations with SINFONI/VLT in 2011. This allowed us to observe the expansion of the dusty nebula around V1280 Sco with a rate of 0.39±0,03 milliarcsec per day along the major axis of the nebula. Assuming that the dust we observed with these infrared observations expands at the same speed as the low-excitation ejecta detected via spec-troscopy, this suggests that the distance to V1280 Sco is at least 1kpc.
Finally, these observations enabled us to study the temporal evolution of a dusty bipolar source. Further yearly monitoring of V1280 Sco will be easier because the nebula is expanding, and will provide an excellent test-case for the study of the envelope dust and gas content.
Acknowledgements. We thank Lowell Tacconi-Garman, Mario van den Ancker and Elena Valenti, among others, for their invaluable assistance with the prepa-ration of these observations. Part of this work was carried out within the frame-work of the European Associated Laboratory ”Astrophysics Poland-France”. We thank Pierre Cruzal`ebes for his advice on the MARCS synthetic models.
References
Bernstein, L. S. & Lynch, D. K. 2009, ApJ, 704, 226
Bode, M. F. 2002, in American Institute of Physics Conference Series, Vol. 637, Classical Nova Explosions, ed. M. Hernanz & J. Jos´e, 497–508
Chesneau, O. 2011, in Asymmetric Planetary Nebulae 5 Conference Chesneau, O., Banerjee, D. P. K., Millour, F., et al. 2008, A&A, 487, 223 Chesneau, O., Clayton, G. C., Lykou, F., et al. 2009, A&A, 493, L17 Chesneau, O., Lykou, F., Balick, B., et al. 2007, A&A, 473, L29
Chesneau, O., Meilland, A., Banerjee, D. P. K., et al. 2011, A&A, 534, L11 Corradi, R. L. M., Balick, B., & Santander-Garc´ıa, M. 2011, A&A, 529, A43 Das, R. K., Banerjee, D. P. K., Ashok, N. M., & Chesneau, O. 2008, MNRAS,
391, 1874
de Marco, O., Passy, J., Moe, M., et al. 2011, MNRAS, 411, 2277 De Marco, O. & Soker, N. 2011, ArXiv e-prints
Downes, R. A. & Duerbeck, H. W. 2000, AJ, 120, 2007
Eisenhauer, F., Abuter, R., Bickert, K., et al. 2003, in Society of Photo-Optical Instrumentation Engineers (SPIE) Conference Series, Vol. 4841, Society of Photo-Optical Instrumentation Engineers (SPIE) Conference Series, ed. M. Iye & A. F. M. Moorwood, 1548–1561
Evans, A. 2011, in Asymmetric Planetary Nebulae 5 Conference Evans, A., Gehrz, R. D., Geballe, T. R., et al. 2003, AJ, 126, 1981 Evans, A., Gehrz, R. D., Woodward, C. E., et al. 2010, MNRAS, 406, L85 Evans, A., Tyne, V. H., Smith, O., et al. 2005, MNRAS, 360, 1483 Gustafsson, B., Edvardsson, B., Eriksson, K., et al. 2008, A&A, 486, 951 Harman, D. J. & O’Brien, T. J. 2003, MNRAS, 344, 1219
Hounsell, R., Bode, M. F., Hick, P. P., et al. 2010, ApJ, 724, 480
Kastner, J. H., Buchanan, C., Sahai, R., Forrest, W. J., & Sargent, B. A. 2010, AJ, 139, 1993
Kato, M. & Hachisu, I. 2011, ApJ, 743, 157
Kervella, P., Verhoelst, T., Ridgway, S. T., et al. 2009, A&A, 504, 115 Kraus, M., Borges Fernandes, M., & Chesneau, O. 2010, in Astronomical
Society of the Pacific Conference Series, Vol. 435, Binaries - Key to Comprehension of the Universe, ed. A. Prˇsa & M. Zejda, 395
Lagadec, E., Verhoelst, T., M´ekarnia, D., et al. 2011, MNRAS, 417, 32 Lagage, P. O., Pel, J. W., Authier, M., et al. 2004, The Messenger, 117, 12 Lasker, B. M., Lattanzi, M. G., McLean, B. J., et al. 2008, AJ, 136, 735 Lau, H. H. B., de Marco, O., & Liu, X. 2011, MNRAS, 410, 1870 Livio, M., Shankar, A., Burkert, A., & Truran, J. W. 1990, ApJ, 356, 250 Lloyd, H. M., O’Brien, T. J., & Bode, M. F. 1997, MNRAS, 284, 137 Lyke, J. E. & Campbell, R. D. 2009, AJ, 138, 1090
Lykou, F., Chesneau, O., Zijlstra, A. A., et al. 2011, A&A, 527, A105+ Lynch, D. K., Rudy, R. J., Russell, R. W., et al. 2009, in American Astronomical
Society Meeting Abstracts, Vol. 214, American Astronomical Society Meeting Abstracts 214, 428.08–+
Meilland, A., Kanaan, S., Borges Fernandes, M., et al. 2010, A&A, 512, A73+ Millour, F., Meilland, A., Chesneau, O., et al. 2011, A&A, 526, A107+ Moraes, M. & Diaz, M. 2009, AJ, 138, 1541
Naito, H., Mizoguchi, S., Arai, A., et al. 2012, ArXiv e-prints
Ness, J., Schwarz, G., Woodward, C. E., et al. 2009, The Astronomer’s Telegram, 2063, 1
Oksanen, A. & Schaefer, B. E. 2011, The Astronomer’s Telegram, 3782, 1 Patterson, J., Kemp, J., Shambrook, A., et al. 1998, PASP, 110, 380 Porter, J. M., O’Brien, T. J., & Bode, M. F. 1998, MNRAS, 296, 943
Sadakane, K., Tajitsu, A., Mizoguchi, S., Arai, A., & Naito, H. 2010, PASJ, 62, L5+
Schwarz, G. J., Ness, J.-U., Osborne, J. P., et al. 2011, ApJS, 197, 31 Smith, N. & Gehrz, R. D. 2005, AJ, 129, 969
Solf, J. 1983, ApJ, 273, 647
Woudt, P. A., Steeghs, D., Karovska, M., et al. 2009, ApJ, 706, 738
Yamaoka, H., Nakamura, Y., Nakano, S., Sakurai, Y., & Kadota, K. 2007, IAU Circ., 8803, 1