HAL Id: hal-02470656
https://hal.archives-ouvertes.fr/hal-02470656
Submitted on 7 Feb 2020HAL is a multi-disciplinary open access archive for the deposit and dissemination of sci-entific research documents, whether they are pub-lished or not. The documents may come from teaching and research institutions in France or abroad, or from public or private research centers.
L’archive ouverte pluridisciplinaire HAL, est destinée au dépôt et à la diffusion de documents scientifiques de niveau recherche, publiés ou non, émanant des établissements d’enseignement et de recherche français ou étrangers, des laboratoires publics ou privés.
Characterization of SiC ceramics with complex porosity
by capillary infiltration: Part A -Filling by hexadecane
at 20°C
Jérôme Roger, M. Avenel, L. Lapuyade
To cite this version:
Jérôme Roger, M. Avenel, L. Lapuyade. Characterization of SiC ceramics with complex porosity by capillary infiltration: Part A -Filling by hexadecane at 20°C. Journal of the European Ceramic Society, Elsevier, 2020, 40 (5), pp.1859-1868. �10.1016/j.jeurceramsoc.2019.12.049�. �hal-02470656�
1
Characterization of SiC ceramics with complex porosity by capillary infiltration: Part A - Filling by hexadecane at 20°C
J. Roger a,*, M. Avenel a, L. Lapuyade a
a Université de Bordeaux, CNRS, Laboratoire des Composites ThermoStructuraux, UMR 5801, 33600 Pessac, France
* Corresponding author: e-mail: jerome.roger@lcts.u-bordeaux.fr
Abstract
The characterization of the porosity of ceramic materials is of prime importance for numerous applications. The work is being presented in two parts: A and B. In this part (Part A), several porous SiC samples exhibiting different sizes and porosity spectra were characterized by capillary infiltration of hexadecane at room temperature. The model materials contain a bimodal pore population generated by cracks and porogens. The monitoring of the weight increase in time for each sample evidence the occurrence of two successive filling stages with specific kinetics, except for the reference samples which contain only one kind of pore. The first kinetic is found clearly larger than the second. A new analytical function was used to identify the transition times and the kinetics of each stage. The various values of the kinetics revealed the occurrence of different infiltration mechanisms. The same model correlates silicon infiltration observations as well (Part B).
2 1. Introduction
Liquids rising in porous media plays a determinant role in numerous fields such as geology, concrete, oil recovery, catalysis, textile, paper industry, food processing, biotechnology, and in the production of structural materials by melt-infiltration [1-9]. Structural composites (CMC and MMC) are advanced materials widely used for aerospace, automotive, defense, and general engineering applications [10]. Pressureless infiltration of liquid metals into packed ceramic particulates or fiber preforms is obviously an efficient process for the fabrication of this kind of composite [11-14]. It offers the potential to be an alternative, simple and low-cost processing route for the manufacture of ceramic reinforced metal matrix composites without remaining porosities. Recently, special interest has been focused on SiC ceramic-reinforced metal-matrix composites. It was demonstrated that high SiC volume fraction composites can be produced by infiltrating liquid metals into packed SiC powder. This way was applied successfully at relative low temperatures with aluminum and copper [15,16]. MMC can be tailored to have superior properties such as enhanced high-temperature performance, high specific strength and stiffness, increased wear resistance, better thermal and mechanical fatigue, and creep resistance than those of unreinforced alloys. This way is also applied for the fabrication of SiC/Si composites by capillary infiltration of molten silicon into porous silicon carbide [17-19]. Macroporous silicon carbide is widely used in various industrial applications including filtration for gas and water, absorption, catalyst supports, concentrated solar power, thermoelectric conversion, etc [20-21]. In broad terms, the mechanism of liquid transport involves capillary rise, but the precise details are lacking. In particular, it remains a lack of understanding about the filling of bimodal or even multimodal porous networks containing for example cracks and/or bubbles [22-23]. The Lucas-Washburn equation is a fundamental expression used to describe liquids rise in capillaries but also surprisingly in porous media [24-26]. In this case, this equation is based on the pore radius, the liquid viscosity, the surface tension, the contact angle, and the time. In a previous paper we confirm that the Washburn equation can be successfully applied to hexadecane filling of SiC compacts with narrow range porosities [27]. But these compacts are not always representative of real materials that commonly contain more complex porous networks with cracks and cavities. The aim of the present study is to investigate the infiltration kinetics of hexadecane at room temperature into SiC porous compacts with different pore distributions by the in-situ measurement of the weight gain versus time. Then, the experimental measurements can be
3
mathematically analyzed to determine the effect of larger porosities on the capillary infiltration mechanism and kinetic.
2. Background on the capillary infiltration into porous SiC
Several methods can be applied to measure porosity: buoyancy, gas expansion (He porosimetry), gas adsorption (BET), mercury intrusion porosimetry and saturation or imbibition [28]. All these methods are complementary as they reveal different characteristics of the porosities. Particularly, the imbibition by capillary rise is a useful and simple tool to characterize porous materials as it measures the progression of the liquid in the pore network [26,29]. The Lucas-Washburn equation describes the front height evolution in porous materials during capillary infiltration [24-26] (Equation 1):
𝑑 𝑑𝑡(𝜋. 𝑟 2ℎ. 𝜌.𝑑ℎ 𝑑𝑡) = ( 2. 𝜎. 𝑐𝑜𝑠𝜃 𝑟 − 𝜌. 𝑔. ℎ − 8. 𝜇. ℎ 𝑟2 . 𝑑ℎ 𝑑𝑡) . 𝜋. 𝑟 2 Equation 1 where 𝑡 is the time, 𝑟 is the radius of the medium pore, ℎ is the infiltration height, 𝜌 is the density, 𝜎 is the surface tension, and 𝜃 is the contact angle, which is assumed to be 0 due to the very low surface tension of hexadecane and 𝜇 its dynamic viscosity. This equation can be simplified in the case of small radii capillaries with creeping flow. Then, 𝑑
𝑑𝑡. (ℎ. 𝑑ℎ
𝑑𝑡) is close to 0. Equation 1 can be modified as follows
[30]: 8. 𝜇. ℎ 𝑟2 . 𝑑ℎ 𝑑𝑡 = 2. 𝜎. 𝑐𝑜𝑠𝜃 𝑟 − 𝜌. 𝑔. ℎ Equation 2 For short durations, 𝜌. 𝑔. ℎ ≪8.𝜇.ℎ
𝑟2 .
𝑑ℎ
𝑑𝑡, then the equation can be written as:
ℎ2=𝑟. 𝜎. 𝑐𝑜𝑠𝜃 2. 𝜇 . 𝑡 Equation 3 or: ℎ2 𝑡 = 𝜎. 𝑐𝑜𝑠𝜃 4. 𝜇 . 𝑑𝑒𝑓𝑓 Equation 4
4
where 𝑑𝑒𝑓𝑓 is the effective diameter of the pores equal to 2. 𝑟. From the linear fit of the curves h2 = f(t),
it is possible to determine the effective diameter 𝑑𝑒𝑓𝑓 of the pores. Maximum capillary height ℎ∞, called
Jurin height, which may be attained by a liquid by capillary rise can be determined from Equation 5 [5]: ℎ∞=
4. 𝜇. 𝑐𝑜𝑠𝜃 𝜌. 𝜎. 𝑑𝑒𝑓𝑓
Equation 5 The mass increase during the infiltration of the liquid can also be used to calculate the value of the effective diameter 𝑑𝑒𝑓𝑓 by modifying Equation 4:
𝑚2 𝑡 = 𝜎. 𝑐𝑜𝑠𝜃 4. 𝜇 . 𝜌 2. 𝜀2. 𝑆2. 𝑑 𝑒𝑓𝑓 Equation 6 where 𝑚 is the infiltrated mass of the liquid, 𝜌 is the density of the liquid, 𝜀 is the porosity rate of the sample, and 𝑆 is the infiltration section of the sample. According to Equation 6, the weight increase varies linearly with time as the effective diameter 𝑑𝑒𝑓𝑓 is constant for a narrow pore distribution as
found in our previous work [27]. The Darcy’law describes the volumetric flow rate 𝑄 of a porous media of length 𝐿: 𝑄 =𝑝 𝜇. 𝑆.𝑃 𝐿 Equation 7 where 𝑝 is the permeability, 𝑃 is the capillary pressure. If the pores are all of the same diameter 𝑑𝑒𝑓𝑓,
the flow rate can be expressed with Equation 8 [31]: 𝑝 =𝜀. 𝑑𝑒𝑓𝑓
2
32
Equation 8 Then Equation 6 can be modified to:
𝑝 =𝑚 4 𝑡2 𝜇2 2. 𝜎2. (𝑐𝑜𝑠𝜃)2. 𝜌4. 𝜀3. 𝑆4 Equation 9 Few recent studies were focused on the effect of bimodal pore distribution and cracks on the capillary rise and the saturation time [32-34]. To our knowledge, no analysis method was developed to examine and understand the capillary infiltration of liquid in porous media containing a multimodal pore size
5
distribution with or without cracks. Such a method could be useful to the production of porous or composite materials of SiC [35].
3. Experimental
3.1 Starting materials
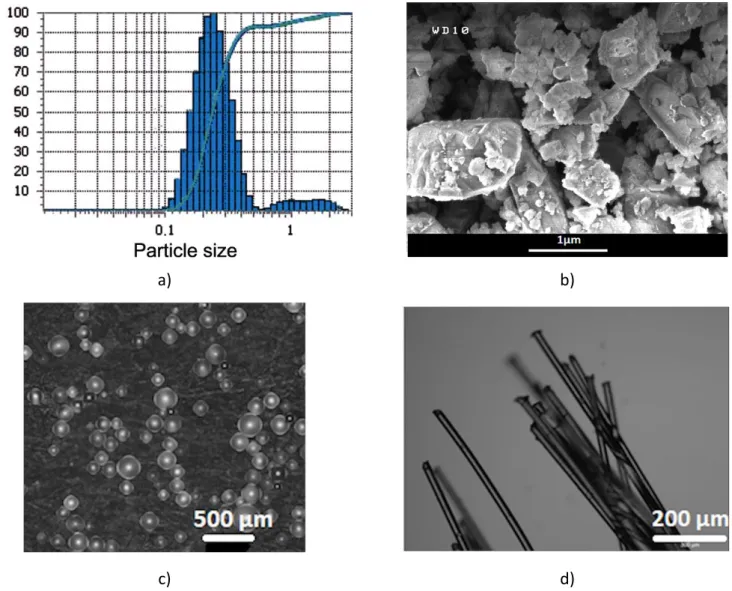
Commercial green β-SiC powder (99.8% purity, Alfa Aesar GmbH & Co KG, Germany) was used as raw material. This powder exhibits a bimodal distribution with a population centered at 0.2µm and a larger population centered between 1 and 2µm as shown in Figure 1-a,b). As reported elsewhere, this SiC powder was found to contain mainly cubic 3C-SiC polytype (β-SiC) [27]. The porous SiC compacts were obtained from mixtures composed of 3g of freshly prepared or 1-year-aged β-SiC powder and 1cm3 of commercial ethanol as lubricant which were uniaxially pressed into rectangular specimens of about 50×5×5mm3 at 100MPa using stainless steel die. The use of aged powder is known to create cracks because of the agglomeration of the grains; the height of these samples was limited to 36mm because of their mechanical weakness. The compacts from fresh, R#, and aged powders, C#, were labeled R1, R2, R3, C1, C2, C3, and C4. Porous SiC ceramics with bimodal and multimodal pore size distributions were also prepared from the mixture of fresh SiC powder with porogens: i) PMMA micro balls (Goodfellow) with a mean size of 131±46 µm (Figure 1-c)); or ii) with pyrolyzed LLDPE fibers (CANOE Technology Center, France) with a mean diameter of 32±3 µm and a length of 1.0±0.1 mm (Figure 1-d)). These pore agents and the SiC powder were slowly mixed by a planet ball miller at a low speed of 300rpm (Emax, Retsch, France) with zirconia balls as milling medium and ethanol as dispersion medium. The slurry was dried to remove the ethanol. The contents of PMMA balls (B#) or LLDPE fibers (F#) additives were 2.5%vol., 5.0%vol., 7.5%vol., and 10%vol., and the corresponding samples were labeled as B2.5, B5.0, B7.5, B10, F5.0, F7.5 and F10, the figures indicating the percentage of additive. Compacts were obtained from these powders following the method described herein. Then, the compacts were fired at 600°C for 2h in air atmosphere to decompose the PMMA balls and LLDPE fibers. All green β-SiC compacts were presintered at 1400°C for 3h under high vacuum (2×10⁻⁴ mbar) to obtain strengthened and manipulable porous SiC ceramics. Industrial porous SiC compacts (Galtenco Solutions, France) were considered in this study, they are labeled as G1, G2, G3 and G4. Commercial foams of SiC (SiC4 grade, SICAT, France) were also used in this study, they are labeled as F1, F2, F3 and F4. These foams
6
contain less than 500ppm of total impurities. Industrial compacts and commercial foams were cut into rectangular specimens of about 50×5×5mm3 and 45×8×5mm3, respectively. All compacts were settled by polishing with a precision of at least 100 µm to homogenize their section. This stage is of importance as the capillary infiltration kinetic of a liquid depends on the cross section. Laboratory grade hexadecane provided by Sigma Aldrich Co. (USA) was used for the capillary infiltration experiments at 20°C. In Table 1 we give the contact angle on SiC, the dynamic viscosity, the density and the surface tension of hexadecane [36].
3.2 Characterization of the materials
Pore-size distributions of each type of sample were obtained from mercury intrusion porosimetry (Autopore IV, Micromeritics Instrument Corp., USA) for a sample volume between 0.6 and 1.2 cm3. The porosity ε of the samples was calculated by applying the formula 𝜀 = 1 −𝑑𝑎
𝑑𝑡 with the apparent
density 𝑑𝑎 obtained from mercury intrusion porosimetry and the true density 𝑑𝑡 measured from helium
pycnometry (AccuPyc 1340, Micromeritics Instrument Corp., USA). The pore size distributions of the SiC consolidated compacts are shown in Figure 2. The pore size distribution of the porous SiC compacts presents a single peak with a narrow width, signifying a uniform pore size distribution centered on 0.22µm. The dimensions and the porosity percentage of all compacts are given in Table 2. The capillary infiltration experiments were performed on a commercial modified tensiometer (TensioCad W TE-5200 MO, CAD Instrument, France) operating at 20°C in a temperature-regulated room. Figure 3-a) shows the experimental setup of the infiltration experiments and the picture of a compact. The SiC compacts were hanged along their longest dimension to a modified analytical balance, which was connected to a computer. A crystallizer containing the solvent (hexadecane) was automatically raised until the contact with the solvent. The mass variations were recorded every second. Losses due to solvent evaporation were estimated to be less than 1% of the imbibed solvent and were hence considered as negligible. Indeed, the saturatation vapor pressure of hexadecane at 20°C is very low since equal to 4.8810-2 Pa [37], so its evaporation can be neglected. Hexadecane was selected because of its low volatility. The time dependence of hexadecane infiltration in the SiC compacts was recorded by monitoring the weight gain increase. A typical curve of a compact is plotted in Figure 3-b). One can note that for the shortest durations, hexadecane rises very quickly by capillary action. Then, the infiltration kinetic is lower for
7
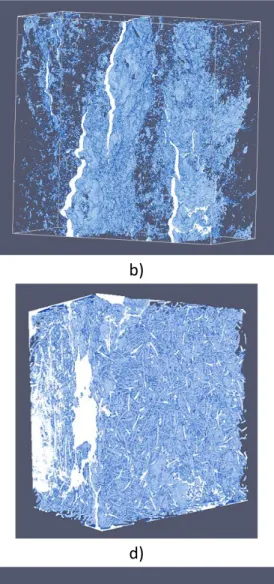
longer durations and the weight of the meniscus can be deduced after the breakage of the contact with the liquid. The computed tomography ray scans of the compacts were performed using a 140kV X-ray source with an intensity of 60μA (GE v|tome|x s research edition, General Electrics, USA). A 500ms exposure time and a spatial resolution of 8μm per voxel unit: this is the highest achievable resolution as dictated by the dimension of the specimens and the performance of the CT machine. These measurements give views of the size and distribution of the largest porosities (cracks, cavities), as shown in Figures 4 and 5. The reconstructed images were obtained with Image Analysis System (ImageJ) [38]. It can be seen in these figures that, compared to the reference compact, more or less large cracks and/or holes are present. It must be noted that the large pores do not connect directly to each other.
4. Results and discussion
4.1 Infiltration of hexadecane
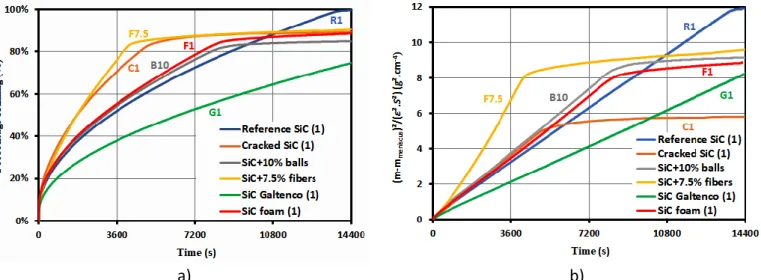
It is assumed that the infiltration of the liquid through the porous SiC compacts is isothermal. No interfacial chemical reaction occurs in the process and the SiC compacts are considered as rigid bodies. The curves plotted in Figures 6-a) show the time dependence of the hexadecane filling percentage of compacts representative of the six types of SiC compacts studied. Theses curves indicate that after 14400s, i.e. 4h, the complete filling is only obtained for Reference SiC (1), called R1, which is free of macro porosities. The squared weight gains corrected from the meniscus weight and normalized to the infiltration section and to the pore fraction, i.e. (𝑚−𝑚𝑚𝑒𝑛𝑖𝑠𝑐𝑢𝑠
𝜀.𝑆 ) 2
= 𝑓(𝑡), are plotted in Figure 6-b). It can be seen that all the different types of samples exhibit similar behaviors with a first linear variation follows by a second linear variation but with a noticeable lower slope. For R1, the second slope is found null. It must be noted that the first slopes of the compacts made from aged SiC powder or with balls or with fibers are higher than the slope of the reference SiC compact. At the opposite, the first linear slopes of the foam and SiC from Galtenco are lower. The second slopes of all samples seem also practically linear, this second slope for SiC Galtenco appears later and is not visible in Figure 6-b). The transition between the two filling rates occurs at various durations without apparent relationship with the nature of the porosity and their quantity. On a general manner, after 4h, the compacts with cracks and voids are far from the complete filling. The first linear variations are in good agreement with the Washburn equation, but this law cannot describe the second linear variations. These behaviors are confirmed on the graphs
8 in Figure 7 which show the (𝑚−𝑚𝑚𝑒𝑛𝑖𝑠𝑐𝑢𝑠
𝜀.𝑆 ) 2
= 𝑓(𝑡) curves for all the samples of this study compared to R1 compact. Three reference SiC compacts are considered with the higher (R2) and lower (R3) slopes obtained with these compacts, R1 has an intermediate slope (Figure 7-a)). These three compacts have similar behaviors with a relative rapid saturation, the main difference lies in the values of their slopes which are more or less elevated. It must be noted that all these measurements are totally reproducible. To our opinion, this variation is induced by the microstructure of the area in contact with the liquid. The shapes of the curves of the four compacts made from aged SiC powder, called C1, C2, C3 and C4, are relatively similar with two successive linear variations (Figure 7-b)). The main differences lie: i) in the values of their slopes, which are close (C1, C2) or higher (C3, C4) than the references, and ii) in the transition time between the two-filling kinetics. The curves of the four compacts obtained from PMMA balls addition are shown in Figure 7-c). They exhibit also two successive rates of filling and their first respective slopes are also close (B10) or higher (B2.5, B5.0, B7.5) than the reference compacts, and there is no evidence of any influence of the added balls content. Similar observations can be deduced from Figure 7-d) showing the curves of the compacts elaborated with fibers. The slopes are clearly larger than the references and no effect of the fraction of fibers added is evidenced. The curve shapes of the SiC foams (F1 to F4) are close during the two successive filling kinetics (Figure 7-e)). The first slope is within the range of the reference compacts but the second one is very low. The squared normalized weight gain curves of the SiC from Galtenco exhibit also two filling kinetics, the first being clearly slower than the reference compacts (Figure 7-f)). Two kinds of behaviors are identified for these compacts with a faster initial kinetic and a sooner transition time leading to a more important filling rate for G1 and G2 samples than for the G3 and G4 samples. On a general manner, these experimental results show variations of the filling kinetics induced by different filling mechanisms. The reference compacts (R1 to R3) are the only ones that strictly verify the Washburn equation as they exhibit a unique filling slope until saturation. The filling mechanisms of all the others compacts involve apparently two consecutive stages. The first kinetics are relatively rapid and close, higher or lower than the filling kinetic of the references. The second kinetics are blatantly sluggish with kinetics around ten times lower. All these different observations confirm the determinant role plays by cracks and large porosities on the filling kinetic by capillary infiltration. But such complex behaviors cannot be described by the Washburn equation. That is why, an analytical analysis is proposed below.
9
4.2 Analytical analysis of hexadecane infiltration
As mentioned above, many interesting studies were realized about the capillary infiltration of liquid in capillaries and some works deal with the infiltration in porous materials. This last case is more complex as the porosities may be irregular and some large defects can easily occur which may have a significant effect on the kinetic of saturation. Thus, it was previously identified in porous materials that a difference of time occurs between the filling of quickly penetrated capillaries and the complete filling of slow penetrating capillaries which implies the presence of at least two characteristic pore sizes [26]. Kumar et al. also consider the effect of two types of pore with different sizes on the infiltration of 3D-stitched C-C preforms [30]. In those two cases, a modification of the Washburn equation is made to explain the measurements with two pore sizes based on one infiltration kinetic. These considerations are not directly applicable to the results reported herein as two filling kinetic are clearly identified. This can be justified by the elevated difference in size between the small pores and the large defects in our model materials. Others classical analytical theories can be considered depending on the limiting phenomenon. Particularly, the asymptotic solution describing the saturation of porous materials can be expressed by a relaxation law which consists in an exponential variation of the front height in time [39]. Another interesting analytic solution to describe the saturation effect implies the Lambert equation [40]. In our opinion, no one of these theories can accurately model the two-staged weight increases reported in the present work. Consequently, a new model is proposed here. As two successive linear variations of the squared weight gain with time are observed, it can be considered that two kinetics, called 𝑘1 and 𝑘2,
occur successively in time. For a given solvent i, the kinetic 𝑘1𝑖 relates to the fast filling of the smaller
pores, and the kinetic 𝑘2𝑖 describes the slow filling of the larger and isolated pores. In a first step, the
squared weight gain, ∆𝑚2, increases linearly in time according to the 𝑘1𝑖 kinetic (g2.mm-4.s-1). Then, in
a second step, it is supposed to increase slowly according to the 𝑘2𝑖 kinetic (g2.mm-4.s-1). The overall
squared-weight gain ∆𝑚2 is normalized to the squared porous section (𝑆. 𝜀) and its evolution is
calculated with Equation 6: ∆𝑚2 𝑆2. 𝜀2 = ∑ 𝑘1 𝑖. (𝑡 𝑖− 𝑡𝑖−1). 𝑓(𝑡𝑖) + 𝑘2𝑖. (𝑡𝑖− 𝑡𝑖−1). (1 − 𝑓(𝑡𝑖)) 𝑗 𝑖=1 𝑡0=0 Equation 6
10
The expression of 𝑓(𝑡𝑖) function is given in Equation 7 which varies between 0 and 1. It describes the
more or less rapid transition between the two filling processes: 𝑓(𝑡𝑖) =
1
1 + (𝛼 + 𝛽. 𝑡𝑖+ 𝛾. 𝑡𝑖3). 𝑒𝑥𝑝 (𝑡𝛿 𝑖)
Equation 7 where 𝛼, 𝛽, 𝛾 and 𝛿 are adjustment coefficients. The validity of Equation 6 was tested by fitting the experimental curves with this equation by adjusting the values of 𝑘1𝑖, 𝑘2𝑖, 𝛼, 𝛽, 𝛾 and 𝛿 with the help of
a numerical solver. The obtained values of 𝑘1𝐻𝑒𝑥 and 𝑘1𝐻𝑒𝑥 kinetics with hexadecane (𝐻𝑒𝑥) are given is
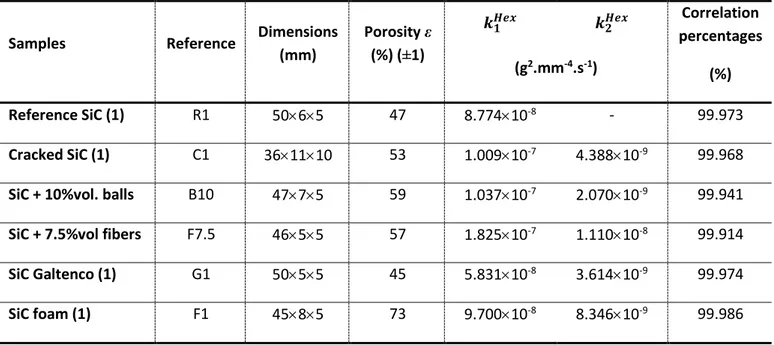
Table 2 for the six main compacts (R1, C1, B10, F7.5, G1 and F1). The correlation percentages are quite acceptable since they are greater than 99.9%. All the samples have a non-null 𝑘2𝐻𝑒𝑥 kinetic except
Reference SiC (1). This confirms that the filling of the reference occurs only with one mechanism, contrary to all the others samples. The experimental and fitted curves giving the mass increase versus time for these six compacts are shown in Figures 8-a,b,c,d,e,f). These figures show also the fitted variations of the mixing functions 𝑓(𝑡) and 1 − 𝑓(𝑡) for the six samples. As expected from the elevated correlation percentages, all the fitted weight gain curves are very close to the experimental measurements. The fit of the reference compact (R1) describes pretty well the saturation of this sample which occurs after a duration of about 14100 seconds, accordingly with visual observations. This value is very close to the crossing time of the 𝑓(𝑡) and 1 − 𝑓(𝑡) functions at 13500 seconds, i.e. 𝑓(𝑡) = 1 − 𝑓(𝑡) = 0.5. The S-like shape of the 𝑓(𝑡) is only due to the sudden variation of the experimental slope which cannot easily be described mathematically, even with the function considered here. The fits could be improved by adding a weighting scheme to increase the weight of the points close to the transition. However, it seems that the fitting of the curves provides not only significant values of 𝑘1𝐻𝑒𝑥 and 𝑘2𝐻𝑒𝑥
kinetics, but also the duration for saturation of the smallest porosities. Indeed, for all the others samples, it is found that the crossing times of the 𝑓(𝑡) and 1 − 𝑓(𝑡) functions are also in good agreement with the experimental transition times, as shown in Figures 8-b,c,d,e,f). These values are not directly comparable as they depend on the height of each sample. The 𝑘1𝐻𝑒𝑥 and 𝑘2𝐻𝑒𝑥 kinetics are compared in
Figure 9. It can be seen that the 𝑘1𝐻𝑒𝑥 values are relatively different. On a general manner, the 𝑘1𝐻𝑒𝑥 values of C1 and B10 compacts are close and slightly higher than for the references, as already seen in Figure 7. Much higher values are obtained with the compacts prepared by fibers addition, the calculated
11
kinetic is almost twice as high as the kinetic of the reference R1. The 𝑘1𝐻𝑒𝑥 kinetics of the Galtenco
samples are almost half of the reference R1, and the kinetics of the foams are close to the kinetic of the reference R1. The 𝑘2𝐻𝑒𝑥 kinetics are clearly lower than the 𝑘1𝐻𝑒𝑥 kinetics and are less than one-tenth of
the corresponding 𝑘1𝐻𝑒𝑥 value. This second kinetic is clearly correlated to the presence of larger porosities (cracks, holes). A scrupulous examination of the fittings confirms their relevance. Indeed, the calculated values of the weight gains at the transition durations with the 𝑘1𝐻𝑒𝑥 kinetics differ from the
experimental data by a maximum value of 1.3% (R1: 1.3%; C1: 1.0%; B10: 1.2%; F7.5: 1.0%; G1: 1.0% and F1: 1.0%). The deviations of the weight gains at the last measured points are equal to or less than 1.3% (R1: 1.3%; C1: 1.0%; B10: 0.2%; F7.5: 0.4%; G1: 0.9% and F1: 0.2%). It can be then considered that the fitted values as significant and can be relevant for a better understanding of the filling mechanisms. It is then clear that the largest porosities can have a positive and a negative effect on the filling kinetic and, consequently, on the filling time. In accordance with the porosimetry measurements (Figure 2-a)), the presence of cracks or holes in the SiC compact slightly increases the mean size of the smaller pores, so that the filling kinetics are increased as experimentally measured. At the opposite, a lower mean size of the smaller pores induces a lower kinetic of filling as measured for Galtenco compacts and SiC foams (Figure 2-b)). The very low values of the 𝑘2𝐻𝑒𝑥 kinetics are dramatically
detrimental to the completeness of the filling. There are clearly correlated to the filling of the largest pores. But it depends also on the interconnectivity of these large pores as evidenced by the SiC+balls compacts. Indeed, the holes generated by the balls are large and poorly interconnected, consequently, the direct and relative rapid filling from the liquid source is almost impossible. The Galtenco compacts have a particular behavior induced by their heterogeneity: a part of the compacts contains no large pores and another part contains the large pores. This can probably justify the particular and unique shape of the 𝑓(𝑡) curve in Figure 8-e) with a very slow decrease to 0. It occurs probably a rapid filling of the small pores in the area containing the large pores and, in parallel, a slower progression in the area without these large pores. A slow decrease of the 𝑓(𝑡) curve below 0.5 could reveal the highly heterogeneous character of a material evidenced by the rounded shape of the squared weight gain in time. The low 𝑘1𝐻𝑒𝑥 kinetics obtained with the Galtenco compacts are correlated to the low size of their smallest pores,
which confirms that the smallest pores are filled first. From the fitting equations, one can deduce also that: i) the time needed for the saturation of each samples, as shown in Figure 10-a), and ii) the
12
percentage of filling associated to each kinetic, as shown in Figure 10-b). The comparison of these figures reveals that the duration for the complete filling increase in the presence of large porosities, as the reference samples need the shortest durations for full filling. The presence of large and practically isolated porosities induced a large increase of the saturation time as highlighted by the compacts prepared with balls. It should be noted that the isolated large pores cannot be completely filled because of the presence of air trapped in these pores. The estimation of the filling volumes during the two kinetic stages can be compared with mercury porosimetry analyses to determine the limiting size of pores filled during the first stage assuming that the smaller porosities are filled first. In this way, the transition occurs for pores close to 1µm for C1 and B10 compacts. The upper limit size of filled pores during the first stage is found close to 10µm for F7.5 and 3µm for F1 samples. A limit value of 0.2µm is identified for G1 sample. The findings reported herein could be highly useful for a better understanding of the liquid filling of porous materials with bimodal or multimodal pores distribution. From these results, a partial permeability value can be obtained for each stage. Indeed, for each kinetic a value of the filled porosity can be estimated and these values can be used in Equation 9 to calculate the two partial permeabilities 𝑝1𝐻𝑒𝑥 and 𝑝2𝐻𝑒𝑥. These values are reported in Table 3. The 𝑝1𝐻𝑒𝑥 values of R1, C1 and B10 samples are
close, which confirms the filling of the smaller pores. While the values of F7.5 and F1 are respectively 4 and 16 times greater than the reference R1. This difference can be correlated to the complex pore network of F7.5 and F1, which promotes the flow of the liquid. The 𝑝2𝐻𝑒𝑥 values are clearly lower than
the corresponding 𝑝1𝐻𝑒𝑥 values which demonstrates that the filling of the larger pores is slower. It can
be considered that the ratios 𝑝1𝐻𝑒𝑥/𝑝2𝐻𝑒𝑥 are all the more elevated than the larger pores are large. Further
works are expected to improve the analysis of the capillary rise measurements and to establish precisely the filling mechanisms and their limitations. Others solvents can be used in this aim on the condition that their saturation vapor pressure remains sufficiently low to limit the losses by evaporation. A solution to work around this limitation consists in operating in a closed and temperate setup under saturatation pressure of the solvent. It was also recently demonstrated that the penetration velocity is sensitive to the geometry of the porous media, and can be tuned by varying the evaporation rate for a given geometry [41]. The inhibition of liquid penetration by evaporation can be offset by varying the geometry of the porous layer. Consequently, the application of the capillary infiltration to the characterization of a porous object with complex shape and relatively large surface is possible on the condition of operating with a
13
solvent having a suitable saturation vapor pressure to limit the losses. This parameter must be considered carefully before any test under penalty of erroneous measurements.
5. Conclusion
The infiltration of several different porous SiC materials by hexadecane have been investigated. These model materials contain at least a bimodal pore population generated by cracks and holes. Their filling by the liquid is compared to reference compacts containing only one pore population. The capillary infiltration experiments reveal two successive stages with different kinetics of the weight gain. The first kinetic is clearly larger than the second kinetic. These kinetics depend on the size of the filled pores, the smallest pores being impregnated first. The saturation time is consequently more or less strongly increased in the presence of these large defects. A new analytical function was used successfully to analyze the experimental measurements. The transition times between the two stages and the kinetics of each stage are determined with this function. It was evidenced different values of the kinetics revealing the occurrence of different infiltration mechanisms. Extrapolations were also realized to estimate the duration for the complete filling of each sample. This analysis method of the infiltration data is an interesting way to characterize porous materials and to reveal their microstructure defects. In Part B, studies on molten silicon capillary infiltration have been reported.
Acknowledgement
The authors wish to thank Olivier Caty and Muriel Alrivie from the Laboratory of ThermoStructural Composites (LCTS - UMR 5801 - UB-CNRS-CEA-SAFRAN) for their kind assistance. The Galtenco company is thanked for the supply of custom samples. A part of this work has been performed within
the frame of the training of Kylia Marcus-Cesaire from the University of Bordeaux, France.
14 References
[1] Y. Tsunazawa, T. Yokoyama, N. Nishiyama, An experimental study on the rate and mechanism of capillary rise in sandstone, Annu. Rev. Earth Planet. Sci. 3 (2016) 8.
https://doi.org/10.1186/s40645-016-0086-5
[2] L. Hanzic, L. Kosec, I. Anzel, Capillary absorption in concrete and the Lucas–Washburn equation, Cement & Concrete Comp. 32 (2010) 84-91. https://doi.org/10.1016/j.cemconcomp.2009.10.005 [3] A. Perwuelz, P. Mondon, C. Caze, Experimental Study of Capillary Flow in Yarns, Textile Res. J.
70 (2000) 333-339. https://doi.org/10.1177/004051750007000409
[4] S. Gruener, H.E. Hermes, B. Schillinger, S.U. Egelhaaf, P. Huber, Capillary rise dynamics of liquid hydrocarbons in mesoporous silica as explored by gravimetry, optical and neutron imaging: Nano-rheologyand determination of pore size distributions from the shape of imbibition fronts, Colloids Surf., A496 (2016) 13-27. http://dx.doi.org/10.1016/j.colsurfa.2015.09.055
[5] M. Mirzajanzadeh, V.S. Deshpande, N.A. Fleck, Water rise in a cellulose foam: By capillary or diffusional flow? J. Mech. Phys. Solids 124 (2019) 206-219.
https://doi.org/10.1016/j.jmps.2018.10.009
[6] L. Forny, A. Marabi, S. Palzer, Wetting, disintegration and dissolution of agglomerated water soluble powders, Powder Technol. 206 (2011) 72-78. https://doi.org/10.1016/j.powtec.2010.07.022 [7] J. Berthier, P. Silberzan, Microfluidics for biotechnology, second ed., Artech House, Boston, 2010. [8] K. Vafai (Ed.), Porous Media: Applications in Biological Systems and Biotechnology, CRC Press,
2010.
[9] M.K. Aghajanian, M.A. Rocazella, J.T. Burke, S.D. Keck, The fabrication of metal matrix composites by a pressureless infiltration technique, J. Mater. Sci. 26 (1991) 447-454.
https://doi.org/10.1007/BF00576541
[10] M. Rosso, Ceramic and metal matrix composites: Routes and properties, J. Mater. Process. Technol. 175 (2006) 364-375. https://doi.org/10.1016/j.jmatprotec.2005.04.038
[11] I.A. Ibrahim, F.A. Mohamed, E.J. Lavernia, Particulate reinforced metal matrix composites - a review, J. Mater. Sci. 23 (1991) 1137-1156. https://doi.org/10.1007/BF00544448
[12] G. Rajesh, R.B. Bhagat, Infiltration of liquid metals in porous compacts: Modeling of permeabilities during reactive melt infiltration, Transport in Porous Media 36 (1999) 43-68.
15
[13] K.M. Sree Manu, L. Ajay Raag, T.P.D. Rajan, M. Gupta, B.C. Pai, Coninck, Liquid Metal Infiltration Processing of Metallic Composites: A critical review, Metall. Mater. Trans. 47B (2016) 2799-2819. https://doi.org/10.1007/s11663-016-0751-5
[14] H. Fu, Kinetics of molten metal capillary flow in non-reactive and reactive systems, Thesis, 2016.
http://dx.doi.org/10.13023/ETD.2016.163
[15] H. Sharifi. M.R. Nasresfahani, Investigation into the kinetic behavior of molten aluminum pressureless infiltration into SiC performs, Int. J. Mater. Res. 107 (2016) 954-959.
https://doi.org/10.3139/146.111422
[16] K. Zhang, Z. Shi, G. Liu, G. Qiao, SiC/Cu composite prepared by spontaneous infiltration of copper alloy into porous SiC ceramic, Mater. Sci. For. 814 (2015) 569-573.
https://doi.org/10.4028/www.scientific.net/MSF.814.569
[17] C. Zollfrank, H. Sieber, Microstructure Evolution and Reaction Mechanism of Biomorphous Si/SiC Ceramics, J. Am. Ceram. Soc. 88 (2005) 51-58. https://doi.org/10.1111/j.1551-2916.2004.00028.x [18] D. Zhu, M. Gao, S. Zhang, H. Wu, Y. Pan, Y. Liu, H. Pan, F.J. Oliveira, J.M. Vieira, A
high-strength SiCw/SiC–Si composite derived from pyrolyzed rice husks by liquid silicon infiltration, J. Mater. Sci. 47 (2012) 4921-4927. https://doi.org/10.1007/s10853-012-6365-7
[19] J. Roger, L. Guesnet, A. Marchais, Y. Le Petitcorps, SiC/Si composites elaboration by capillary infiltration of molten silicon, J. Alloys Compd 747 (2018) 484-494.
https://doi.org/10.1016/j.jallcom.2018.03.024
[20] J.H. Eom, Y.W. Kim, S. Raju, Processing and properties of macroporous silicon carbide ceramics: A review, J. Asian Ceram. Soc. 1 (2013) 220-242. http://dx.doi.org/10.1016/j.jascer.2013.07.003 [21] D.V. Bru, A.R. Martínez. Macroporous Silicon: Technology and Applications, In: New Research
on Silicon - Structure, Properties, Technology, Vitalyi Igorevich Talanin, IntechOpen, 2017. [22] J. Lewandowska, A. Szymkiewicz, W. Gorczewska, M. Vauclin, Infiltration in a double-porosity
medium: Experiments and comparison with a theoretical model, Water Resour. Res. 41 (2005) W02022. https://doi.org/10.1029/2004WR003504
[23] S. Suo, M. Liu, Y. Gan, Modelling Imbibition Processes in Heterogeneous Porous Media, Transport Porous Med. 126 (2019) 615-631. https://doi.org/10.1007/s11242-018-1146-7
[24] E.W. Washburn, The dynamics of capillary flow, Phys. Rev., 17 (1921) 273-283.
16
[25] M. Abraham, D.C. Ruben, Characterization of porous media by the kinetics of liquid penetration: vertical capillaries model, J. Colloid Inter. Sci., 189 (1997) 299-304.
https://doi.org/10.1006/jcis.1997.4816
[26] D.V. Trong, J. Hupka, Characterization of porous materials by capillary rise method, Physicochem. Probl. Min. Process., 39 (2005) 47-65.
[27] A. Marchais, J. Roger, Y. Le Petitcorps, Capillary infiltration of hexadecane in packed SiC powder and in SiC/SiC preforms: Pore description and calculation of molten Si infiltration, Ceram. Inter. 42 (2016) 7774-7780. http://dx.doi.org/10.1016/j.ceramint.2016.01.203
[28] L.M. Anovitz, D.R. Cole, Characterization and analysis of porosity and pore structures, Reviews in Mineralogy & Geochemistry 80 (2015) 61-164. http://dx.doi.org/10.2138/rmg.2015.80.04
[29] M. Karoglou, A. Moropoulou, A. Giakoumaki, M.K. Krokida, Capillary rise kinetics of some building materials, J. Colloid Interface Sci. 284 (2005) 260-264.
https://doi.org/10.1016/j.jcis.2004.09.065
[30] S. Kumar, A. Kumar, A. Shukla, A.K. Gupta, R. Devi, Capillary infiltration studies of liquids into 3D-stitched C–C preforms Part A: Internal pore characterization by solvent infiltration, mercury porosimetry, and permeability studies, J. Eur. Ceram. Soc., 29 (2009) 2643-2650.
https://doi.org/10.1016/j.jeurceramsoc.2009.03.007
[31] D. Benavente, C. Pla, N. Cuetoa, S. Galvañ, J.Martínez-Martínez, M.A. García-del-Cura, S. Ordóñez, Predicting water permeability in sedimentary rocks from capillary imbibition and pore structure, Eng. Geol. 195 (2015) 301-311. http://dx.doi.org/10.1016/j.enggeo.2015.06.003
[32] Y. Li, X. Yang, D. Liu, J. Chen, D. Zhang, Z. Wu, Permeability of the porous Al2O3 ceramic with bimodal pore size distribution, Ceram. Inter. 45 (2019) 5952-5957.
https://doi.org/10.1016/j.ceramint.2018.12.064
[33] Z. Jiang, M.I.J. van Dijke, S. Geiger, J. Ma, G.D. Couples, X. Li, Pore network extraction for fractured porous media, Adv. Water Resour. 107 (2017) 280-289.
http://dx.doi.org/10.1016/j.advwatres.2017.06.025
[34] S. Suo, M. Liu, Y. Gan, Modelling imbibition processes in heterogeneous porous media, Transport in Porous Med. 126 (2019) 615–631. https://doi.org/10.1007/s11242-018-1146-7
17
[35] L. Esposito, D. Sciti, A. Piancastelli, A. Bellosi, Microstructure and properties of porous b-SiC templated from soft woods, J. Eur. Ceram. Soc. 24 (2004) 533-540. https://doi.org/10.1016/S0955-2219(03)00195-X
[36] U. Onken, J. Rarey-Nies, J. Gmehling, The Dortmund Data Bank: a computerized system for retrieval, correlation, and prediction of thermodynamic properties of mixtures, Int. J. Thermophys. 10 (1989) 739-747. https://doi.org/10.1007/BF00507993
[37] D.L. Camin, A.F. Forziati, F.D. Rossini, Physical Properties of Hexadecane, n-Decylcyclopentane, n-Decylcyclohexane, 1-Hexadecene and n-Decylbenzene, J. Phys. Chem. 58 (1954) 440-442. https://doi.org/10.1021/j150515a015
[38] C.A. Schneider, W.S. Rasband, K.W. Eliceiri, NIH Image to ImageJ: 25 years of image
analysis, Nature Methods 9 (2012) 671-675.
https://doi.org/10.1038/nmeth.2089
[39] B.V. Zhmud, F. Tiberg, K. Hallstensson, Dynamics of capillary rise, J. Colloid Interface Sci. 228 (2000) 263-269. https://doi.org/10.1006/jcis.2000.6951
[40] X. Yang, Y. Yang, Y. Zhu, Capillary Microflows in Porous Metals, 21st Australasian Fluid Mechanics Conference (2018).
[41] M. Liu, J. Wu, Y. Gan, D.A.H. Hanaor, C.Q. Chen, Tuning capillary penetration in porous media: Combining geometrical and evaporation effects, Int. J. Heat Mass Transf. 123 (2018) 239-250.
18
a)
b)
c)
d)
Figure 1: Starting materials: a) grain size distribution of the SiC powder, b) secondary electrons image
(magnification x30000) of the SiC powder; c) optical microscopy (magnification x5) of the PMMA balls and
d) optical microscopy (magnification x5) of the LLDPE fibers.
a)
b)
Figure 2: Pore-size distribution of the six SiC compacts types: a) for reference SiC, cracked SiC and SiC
+10%vol. balls, SiC+7.5%vol. fibers; and b) reference SiC, SiC foam and SiC Galtenco.
19
a)
b)
Figure 3: Capillary rise tests of hexadecane in SiC compacts:
20
a)
b)
c)
d)
e)
f)
Figure 4: Representative 3D reconstructed computed tomography X-ray image of some
of the samples tested in this study: a) reference SiC (555mm
3); b) cracked SiC
(10105mm
3); c) SiC+10%vol. balls (558mm
3); d) SiC+7.5%vol. fibers (556mm
3); e)
21
a)
b)
c)
d)
e)
f)
Figure 5: Cross-section images reconstructed from computed X-ray tomography of some
of the samples tested in this study: a) reference SiC; b) cracked SiC; c) SiC+10%vol. balls; d)
22
a)
b)
Figure 6: Time dependence of the weight gain during hexadecane capillary rise in one compact of each
family: a) percentage of filling curves and b) squared weight gain curves normalized to the section.
23
a)
b)
c)
d)
e)
f)
Figure 7: Time dependence of the squared weight gain curves normalized to the section during
hexadecane capillary rise compared to reference SiC (1): a) reference SiC, b) cracked SiC, c) SiC + balls, d)
24
a)
b)
c)
d)
e)
f)
Figure 8: Experimental and fitted time dependence of the weight gain during hexadecane capillary rise and
fitted values of 𝑓(𝑡) and 1 − 𝑓(𝑡): a) reference SiC (R1), b) Cracked SiC (C1), c) SiC + balls (B10), d) SiC +
25
Figure 9: Graphic comparison of the 𝑘
1𝐻𝑒𝑥and 𝑘
2𝐻𝑒𝑥kinetics for the six main samples.
a)
b)
Figure 10: Extrapolations for the six main samples: a) estimated saturation times and b) estimated ratio
of the filled volumes with 𝑘
1𝐻𝑒𝑥and 𝑘
2𝐻𝑒𝑥kinetics.
26
Table 1: Physical properties of hexadecane at 20°C [36]
Physical properties Hexadecane (20°C)
Contact angle on β-SiC (°) 0
Dynamic viscosity
μ
(g.cm-1.s-1) 3.04×10⁻²Density ρ (g.cm-3) 0.77
Surface tension σ (g.s-2) 27.42
Table 2: Porosity, dimensions and filling kinetics of the six main samples
Table 3: Experimental partial permeabilities 𝒑
𝟏𝑯𝒆𝒙and 𝒑
𝟐𝑯𝒆𝒙, and their ratio for
the six main samples
Samples Reference Dimensions
(mm) Porosity ε (%) (±1) 𝒌𝟏𝑯𝒆𝒙 𝒌𝟐𝑯𝒆𝒙 Correlation percentages (%) (g2.mm-4.s-1) Reference SiC (1) R1 5065 47 8.77410-8 - 99.973 Cracked SiC (1) C1 361110 53 1.00910-7 4.38810-9 99.968
SiC + 10%vol. balls B10 4775 59 1.03710-7 2.07010-9 99.941
SiC + 7.5%vol fibers F7.5 4655 57 1.82510-7 1.11010-8 99.914
SiC Galtenco (1) G1 5055 45 5.83110-8 3.61410-9 99.974 SiC foam (1) F1 4585 73 9.70010-8 8.34610-9 99.986 Samples Reference 𝒑𝟏 𝑯𝒆𝒙 𝒑 𝟐 𝑯𝒆𝒙 𝒑 𝟏 𝑯𝒆𝒙/𝒑 𝟐 𝑯𝒆𝒙 (m2) Reference SiC (1) R1 6.33110-15 - - Cracked SiC (1) C1 6.86010-15 4.87810-18 1406 SiC + 10%vol. balls B10 7.78910-15 5.68710-19 13696 SiC + 7.5%vol fibers F7.5 2.82010-14 1.85810-19 1518 SiC Galtenco (1) G1 1.87510-15 3.07910-18 609