HAL Id: cea-02542712
https://hal-cea.archives-ouvertes.fr/cea-02542712
Submitted on 30 Apr 2020
HAL is a multi-disciplinary open access archive for the deposit and dissemination of sci-entific research documents, whether they are pub-lished or not. The documents may come from teaching and research institutions in France or abroad, or from public or private research centers.
L’archive ouverte pluridisciplinaire HAL, est destinée au dépôt et à la diffusion de documents scientifiques de niveau recherche, publiés ou non, émanant des établissements d’enseignement et de recherche français ou étrangers, des laboratoires publics ou privés.
Evaluation of PENFAST – A fast Monte Carlo code for
dose calculations in photon and electron radiotherapy
treatment planning
Bouchra Habib, Bénédicte Poumarede, François Tola, Jean Barthe
To cite this version:
Bouchra Habib, Bénédicte Poumarede, François Tola, Jean Barthe. Evaluation of PENFAST – A fast Monte Carlo code for dose calculations in photon and electron radiotherapy treatment planning. Physica Medica, Elsevier, 2010, 26 (1), pp.17-25. �10.1016/j.ejmp.2009.03.002�. �cea-02542712�
Evaluation of PENFAST - a fast Monte Carlo code for dose calculations in photon and electron radiotherapy treatment planning
B Habib, B Poumarede, F Tola and J Barthe
CEA, LIST, Département des Technologies du Capteur et du Signal, F-91191 Gif-sur-Yvette, France.
bouchra.habib@cea.fr
Abstract
The aim of the present study is to demonstrate the potential of accelerated dose
calculations, using the fast Monte Carlo (MC) code referred to as PENFAST, rather than the
conventional MC code PENELOPE, without losing accuracy in the computed dose. For this
purpose, experimental measurements of dose distributions in homogeneous and
inhomogeneous phantoms were compared with simulated results using both PENELOPE and
PENFAST. The simulations and experiments were performed using a Saturne 43 linac
operated at 12 MV (photons), and at 18 MeV (electrons). Pre-calculated phase space files
(PSF) were used as input data to both the PENELOPE and PENFAST dose simulations. Since
depth-dose and dose profile comparisons between simulations and measurements in water
were found to be in good agreement (within ± 1% to 1 mm), the PSF calculation is considered
to have been validated. In addition, measured dose distributions were compared to simulated
results in a set of clinically relevant, inhomogeneous phantoms, consisting of lung and bone
heterogeneities in a water tank. In general, the PENFAST results agree to within a 1% to 1
mm difference with those produced by PENELOPE, and to within a 2% to 2 mm difference
with measured values. Our study thus provides a pre-clinical validation of the PENFAST
code. It also demonstrates that PENFAST provides accurate results for both photon and
electron beams, equivalent to those obtained with PENELOPE. CPU time comparisons
between both MC codes show that PENFAST is generally about 9-21 times faster than
Key words: Fast Monte Carlo dose calculation, experimental verification, inhomogeneous
phantoms
1. Introduction
Conventional treatment planning systems (TPS) are fast, but sometimes insufficiently
accurate, especially in the vicinity of interfaces between materials, where the effects of
electron transport cannot be accurately handled by conventional deterministic dose
algorithms. Monte Carlo (MC) methods are considered to provide the best calculation engine
today available in medical radiation physics [1,2]. However, conventional MC methods still
require long calculation times. During the last few decades, a growing number of MC-based
dose simulation engines (e.g. Macro MC [3], Super MC [4], Voxel MC [5], PEREGRINE [6],
Dose Planning Method [7], MCDOSE/MCSIM [8] and others) have been developed, thanks
to the optimization of dedicated radiation transport algorithms, and the implementation of
variance-reduction techniques and suitable approximations. PEREGRINE was the first
commercially available electron and photon beam treatment planning system, whereas the
commercial implementation of other codes is applicable to electron beams only (Voxel MC
incorporated into the Masterplan TPS of Nucletron, and Macro MC implemented in the
Eclipse TPS of Varian). Recently, a new MC code called PENFAST, for the fast simulation of
photon and electron dose distributions in computerized tomography (CT) structures, was
developed by Salvat et al. [9-11] in the framework of the European Integrated Project referred
to as MAESTRO (LSHC-CT-2004-503564). As PENFAST is a proprietary code,
implemented as a new functionality in the TPS ISOgray™ of the French company DOSIsoft
algorithms included in PENFAST. In the following paragraphs, a synthetic comparison
between the general-purpose MC code PENELOPE [13-15] and its faster version PENFAST
is presented.
PENELOPE [13-15] performs an accurate MC simulation of coupled electron-photon
transport phenomena, in arbitrary materials over a wide range of energies (from a few
hundred eV to 1 GeV). Photon transport is simulated by means of the conventional detailed
simulation scheme. Electron and positron histories are generated on the basis of a mixed
procedure, which combines a detailed simulation of hard events with a condensed simulation
of soft interactions. A geometry package called PENGEOM [14,15] enables the generation of
random electron-photon showers in material systems consisting of homogeneous bodies,
limited by quadric surfaces (i.e., planes, spheres, cylinders, etc), and allows the modelling of
geometries of various forms and compositions. PENELOPE (as for all conventional MC
codes) requires long computation times, which are impractical for the routine planning of
clinical treatments.
PENFAST [9-11,16] simulates photons, electrons and positrons transport in voxelised
geometries starting from pre-calculated PSFs with the general-purpose PENELOPE code.
This algorithm is based on the same physical interaction models as those used in the
conventional MC code PENELOPE, but it implements new transport mechanics for electrons
and positrons tailored to optimize the simulation speed. One of the typical features of
PENFAST is the consistent use of complete-grouping condensed simulation for electron and
positron transport. In this approach the collective effect of all interactions undergone by a
transported electron along a given path length is simulated, in an approximate manner, with a
single computational step. The use of class I simulation for absorbed dose estimation in
radiotherapy has been hindered by the inability of multiple-scattering theories to accurately
multiple-scattering distributions (i.e. energy loss and angular distributions) generated with
PENELOPE. This procedure freeds this class I algorithm from most of the limitations of
conventional multiple-scattering theories. PENFAST also uses a simplified photon transport
model adapted to CT geometries and which has been tailored to take full advantage of the
peculiarities of the CT geometry and the limited variability of atomic numbers found in
radiotherapy dose estimations. Apart from several small simplifications, the photon
interaction models adopted in PENFAST are equivalent to those used in PENELOPE.
Geometrical aspects are handled by using the delta-scattering method [17,18], which does not
require control of the interface crossings, and simplifies the tracking of photons through the
CT structure, combined with the variance-reduction techniques of interaction forcing and
splitting (as implemented in PENELOPE). In practical dose calculations the CT scan which
describes the morphology of the patient is used as input data to the PENFAST code. Since CT
image information is expressed in Hounsfield units (HU), the use of such data involves
converting HU to the chemical composition and the mass density required by PENFAST for
each voxel. The conversion to chemical composition is performed on HU ranges. All voxels
with a HU lying within a certain range are assigned to the same material. The chemical
composition is defined using a material file read by the MC code. For the conversion to mass
density (in g.cm-3) the calibration curve of the CT scanner, that relates HUs to mass density, is
used. PENFAST has in its database chemical composition and multiple-scattering
distributions for air, water, compact bone, lung, titanium and lead (the two latter materials are
used for specific applications: electron insert and prosthesis). Additionally, it gives the
possibility of generating new materials for the database according to need. Therefore, the MC
simulation in every part of the patient is performed in the appropriate medium. Additionally,
it is possible to influence the voxelised patient matrix by varying its resolution. This is
estimation grid is limited to being an integer multiple of the resolution of the original CT
image. In order to calculate the mass density corresponding to the grouped voxel, the HUs of
the CT image voxels are averaged and then the conversion to mass density is applied to the
average HU value via the considered CT calibration curve. The material assignment is
determined by converting each of the CT image voxel to a material, and then the most
abundant material present is chosen to represent the grouped voxels.
A large number of studies have already demonstrated the ability of the conventional
MC code PENELOPE to provide a reliable description of the transport of photons and
electrons in matter, as well as in the vicinity of material interfaces [19-22]. Recently, Blazy et
al. [22] compared experimental measurements with simulated dose distributions obtained with
the PENELOPE code (2003 release) in inhomogeneous phantoms (lung and bone slabs). The
study was carried out for an 18 MeV electron beam, and a 12 MV photon beam from a
Saturne 43 accelerator. Dose distributions were measured with Fricke dosimeters and with
plane and cylindrical ionization chambers (IC). They showed a good agreement between the
PENELOPE simulations and the experimental measurements, and demonstrated the ability of
the PENELOPE code to account for fluence disturbances in the vicinity of the heterogeneity
interfaces.
The goal of this paper is to assess the influence of the approximations used, in the
physical models and transport algorithms included in PENFAST, for dose calculations.
Experimental measurements of dose distributions in homogeneous and inhomogeneous
phantoms were thus compared to simulated results obtained with PENELOPE (latest release
2006 [15]) and PENFAST. A comparison of the calculation times, for both MC codes, is also
presented. This study provides a pre-clinical validation of the PENFAST code, using
experimental data measured by Blazy et al. [22] at the LNHB (the French National
2. Materials and methods
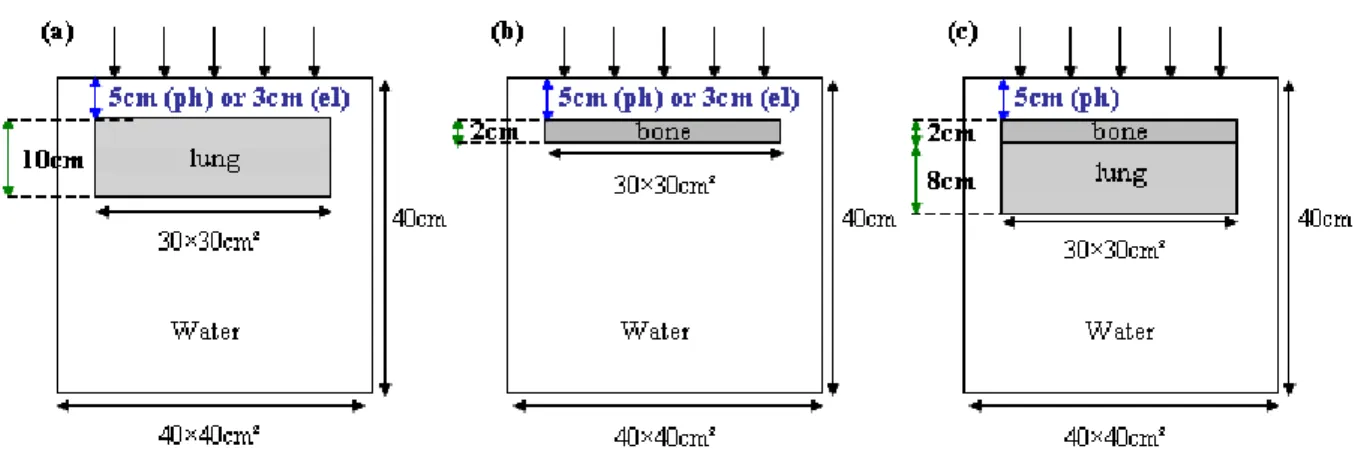
2.1. Phantom configurations
Phantoms consist of parallelepipedic slabs of CIRS lung equivalent material (0.3
g/cm3) and CIRS bone equivalent material (1.8 g/cm3), placed in a water tank. The water tank
is made of 1.5 cm thick plexiglas (PMMA) walls, with the exception of that in front of the
beam which is only 0.4 cm thick. The phantom configurations used are presented in Figure 1.
These cover a large number of heterogeneous interfaces encountered in radiotherapy:
water/lung/water (figure 1a and 1d), water/bone/water (figure 1b) and water/lung/bone/water
(figure 1c).
Figure 1. (a) and (b) show the inhomogeneous phantoms containing the lung and bone equivalent layers, respectively. The position of the heterogeneity layer depends on the beam quality; these configurations are common to the photon and electron beams. (c) shows the inhomogeneous phantom containing the bone and lung
layers; this configuration is peculiar to the photon beam.
2.2. Dose measurements in inhomogeneous phantoms
Dose measurements have been carried out in inhomogeneous phantoms at the LNHB
laboratory, using special precautions (e.g. accurate geometrical positioning, no drift, etc.) in
Depending on the experimental conditions, depth-dose distributions were measured
upstream and downstream of the heterogeneity (figure 1a-c) using ICs (plane parallel:
NACP-02, PTW-34001 and cylindrical: PTW-310NACP-02, NE-2571), and near to the interfaces using
Fricke dosimeters. All measured central axis dose distributions were normalized relative to
the dose at the reference depth (10 cm and 4.2 cm for photons and electrons respectively)
measured in a homogeneous water phantom using IC and Frick dosimeters. The dosimeters
are not included in the simulations. The measurements are therefore converted to an
equivalent dose in the medium (water), for the purposes of comparison with the MC
calculations, which directly provide the dose in the medium itself. The IC relative
measurements in the electron beam are corrected by the water to air ratio of the stopping
power calculated on the central axis. The Fricke dosimeter values are corrected for the wall
perturbation calculated by PENELOPE. For further details concerning the determination of
these correction factors and their values, see the paper of Blazy et al. [22].
Moreover, the dose profiles were measured using a cylindrical IC (PTW-31002) at
depths 2.5 cm and 14.5 cm in the water-lung-water phantom (figure 1a) for the electron beam,
and at depths 22 cm and 25 cm in the mediastinum configuration phantom (figure 1d) for the
photon beam. All measured dose profiles were normalized relative to the dose on the central
axis.
For IC relative measurements, the uncertainty due to the calibration factor of the
dosimeter at a reference beam quality “disappears” when dealing with relative dose. The type
A uncertainties (reproducibility) are negligible compared to type B uncertainties
(experimental conditions) which are estimated to be 0.56% (1σ) for electron beams, and
0.36% (1σ) for photon beams. For the Frick dosimeters, the uncertainties are estimated to be
2.3. Monte Carlo simulations
The MC simulations were separated into two parts: the first involves the detailed
simulation of particle transport through the accelerator head. An impact detector is located at
the entry surface of the phantom; when crossing this scoring plane, particle characteristics
(e.g. mainly type, position, energy, direction, weight) are stored in a PSF. These calculations
were made using the 2006 release of the MC code PENELOPE [15]. Then, in the second part
of the simulation, this PSF is used as input data to compute the three-dimensional dose
distribution in phantoms, using both MC codes: PENELOPE and PENFAST.
2.3.1. PHASE SPACE FILE CALCULATIONS
Detailed modelling of the Saturne 43 linac head (used at the LNHB) was performed
using the MC code PENELOPE. Both the photon (12 MV) and electron (18 MeV) beams are
simulated according to the manufacturer’s data. The chosen field size is 10 ×10 cm² at a
distance of 100 cm from the source, in accordance with the IAEA protocol [23].
To determine the initial electron parameters (energy spectrum and beam spot size),
several simulations were carried out with the PENELOPE code. The values of the parameters
defining the source were then determined by least squares minimization of the difference
between the measured and simulated dose distributions in water. This novel method for beam
commissioning will be discussed in a further paper, since the main objective here is to
validate the dose calculation with PENFAST, by starting from a pre-calculated PSF.
The PSF was calculated at 90 cm and 100 cm from the source, for the photon beam
and the electron beam respectively. The number of simulated events was adjusted so as to
achieve an average statistical uncertainty of 0.4%, in regions where the dose is greater than
50% of the maximum dose. This led to respectively 65 and 52 million particles scored in the
variance-reduction methods [15,18] were used to increase the efficiency of the simulation:
bremsstrahlung splitting in the target, Russian roulette coupled with splitting, both outside and
inside the beam, and circular splitting. When compared with analogue simulations (with no
variance-reduction), these techniques allowed the simulation efficiency to be improved by a
factor greater than 500 [24].
To validate the calculated PSF, depth-dose curves and dose profiles were measured in
a 30 × 30 × 30 cm3 water phantom, using a PTW-31002 cylindrical IC for the photon beam
and a NACP-02 plane parallel IC for the electron beam. Dose profiles were measured at the
reference depth: 10 cm for the 12 MV beam and 4.2 cm for the 18 MeV beam [22,23]. The
measurement accuracy was better than 0.4% (1σ) for the photon beam and better than 0.6%
(1σ) in the case of the electron beam. These measurements were compared to the simulated
results, obtained with PENELOPE and PENFAST, in order to validate the PSF.
2.3.2. CALCULATION OF DOSE DISTRIBUTIONS IN INHOMOGENEOUS
PHANTOMS
The PSF obtained during the beam modelling process serves as input data for both the
PENELOPE and the PENFAST dose simulations. The same number of histories is thus used
when comparing the results of both calculations.
For the PENELOPE dose simulations, the phantoms (figure 1a-d) were modelled using
PENGEOM, assuming the chemical composition specified by the manufacturer. In all
PENELOPE calculations, the cutoff energy was set to 100 keV for electrons and positrons,
and 10 keV for photons. The parameter C1, which determines the mean free path between
hard elastic events, was set to 0.05, and the parameter C2, which gives the maximum average
fractional energy loss in a single step, was set to 0.05. The cutoff energy loss for inelastic
For the PENFAST simulations, the voxelised phantoms (figure 1a-d) were generated
numerically using a homemade Fortran program which assigns the correct chemical
composition and mass density to each voxel. The CT scans were not used in order to avoid the
accuracy limitations which arise when converting HUs to tissue parameters. In the following,
we evaluate the influence of material composition on dose distributions. In fact, the phantom
walls were made with PMMA, the data of which is not available in the original version of
PENFAST. In the first step, for the PENFAST simulations, the PMMA voxels were assigned
to have the same composition as water (the material with the closest density to that of
PMMA), although with the correct density of PMMA (1.19 g.cm-3). As a consequence, large
discrepancies (> 3%) can be noticed, between the PENFAST and PENELOPE dose
simulations, in the PMMA wall. Recently, Verhaegen and Devic [25] showed that medium
and mass density mis-assignements can lead to dose errors of up to 10% for 6 and 15 MV
photons, and 30% for 18 MeV electrons. Consequently, in the second step we generated
look-up tables (angular multiple-scattering and energy loss distributions were generated by means
of MC simulations using PENELOPE) for PMMA, which were then included in the
PENFAST library. When the correct material composition and density are used, the
differences previously seen in PMMA disappear. It must be emphasized that for accurate MC
dose calculations, the material’s chemical composition and mass density must be scrupulously
respected.
3. Results and discussion
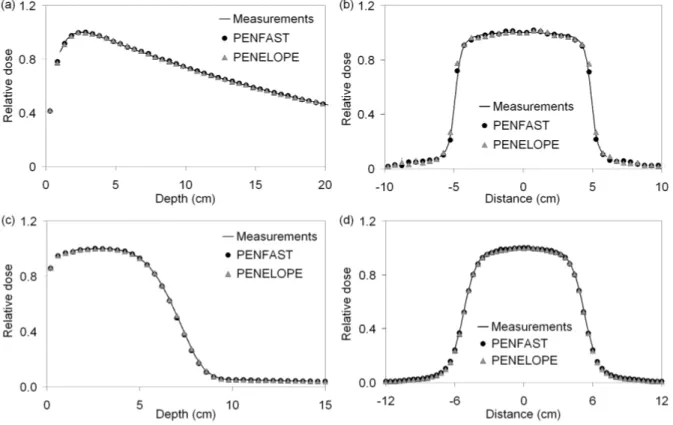
3.1. Homogeneous phantom comparisons
Figures 2(a-d) show the depth-dose curves and dose profiles, for IC measurements and
18 MeV electron beams. These simulations were made using cubic voxels of 5 mm wide for
the photon beam and 4 mm wide for the electron beam.
Figure 2. Depth-dose and profiles in water for a photon beam (a,b) and an electron beam (c,d).
All depth-dose curves are normalized to the maximum dose. The statistical
uncertainties associated with the simulated depth-dose curves are less than 0.4% for the high
dose regions and less than 1% elsewhere.
The dose profiles are normalized to the averaged dose of the three central points, in
order to reduce fluctuations on either side of the central point. The statistical uncertainties of
the simulated profiles are less than 0.6% (1σ) in the central region, and less than 2% (1σ) in
the penumbra regions.
Overall, the PENFAST and PENELOPE simulations fall within 1% - 1 mm of the
measured values. These results validate the PSFs used later, as input data for the
3.2. Inhomogeneous phantom comparisons
In the following analysis, experimental measurements of depth-dose curves and dose
profiles are compared to simulated results obtained with both PENELOPE and PENFAST
codes. The comparisons are made in inhomogeneous phantoms (figure 1) for both the electron
beam and the photon beam. The measured and simulated central axis dose distributions are
normalized relative to the dose at the reference depth in water, while all measured and
simulated dose profiles are normalized relative to the dose on the central axis.
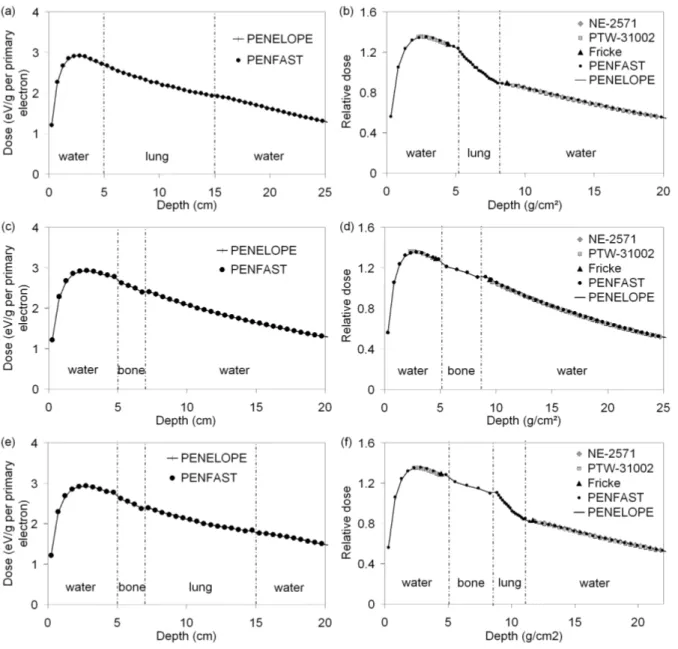
3.2.1. 12 MV PHOTON BEAM
Figures 3(a), (b) and (c) provide comparisons between measured and simulated
depth-dose curves (for both PENELOPE and PENFAST simulations) in the water-lung-water (figure
1a), water-bone-water (figure 1b) and water-bone-lung-water (figure 1c) phantoms,
Figure 3. Photon 12 MV beam: (a), (b) and (c) central axis dose distributions; (d), (e) and (f) depth-dose curves for the water lung-water, water-bone-water and water-bone-lung-water phantoms respectively.
Figure 3(d) shows the comparison between measured and simulated dose profiles at
depths 22 and 25 cm in the water-lung mediastinum phantom (figure 1d). Dose profiles were
tallied using cubic voxels of 2 mm wide. The statistical uncertainty of the simulated results
was of the order of 1% in the central region of the dose profiles and between 1.5-3% in the
penumbra. In all regions, the discrepancies between measurements and PENFAST, as well as
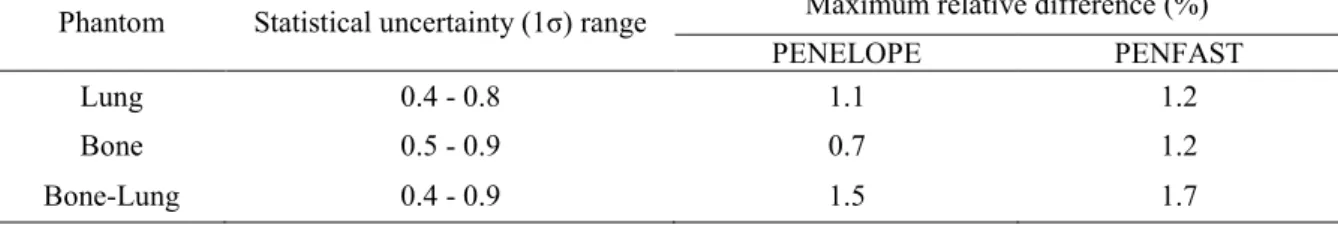
Table 1 presents the statistical uncertainties (1σ) associated with the simulations, as
well as the maximum relative difference between measurements and MC results in the three
phantoms. For all phantoms, good agreement is found between the PENFAST and
PENELOPE simulations in water and inside the heterogeneity layer. The largest discrepancy
is less than 1% - 1 mm. Furthermore, the PENFAST calculations are found to be in good
agreement with the experimental measurements. The maximum relative difference between
the latter and the PENFAST depth dose calculations is observed in the vicinity of the
heterogeneity, where it reaches 1.2% for the water-lung-water and the water-bone-water
phantoms, and 1.7% for the water-bone-lung-water phantom. This difference decreases
rapidly, when it is determined at greater distances from the heterogeneity. These discrepancies
can be partly explained by the fact that the cylindrical IC tends to underestimate the dose, due
to the attenuation of low energy electrons by its wall (see figure 3b, at depths of 7.3-8.5 cm
near the bone/water interface). These electrons are however taken into account in the
simulations, since the latter do not include the detectors.
Table 1. Maximum relative difference between measurements and both PENELOPE and PENFAST simulations in the three phantoms. The statistical uncertainty (1σ) range associated with MC simulations is also shown.
Phantom Statistical uncertainty (1σ) range Maximum relative difference (%)
PENELOPE PENFAST
Lung 0.4 - 0.8 1.1 1.2
Bone 0.5 - 0.9 0.7 1.2
Bone-Lung 0.4 - 0.9 1.5 1.7
These results show good agreement between the measurements and the MC
simulations made using PENFAST for the photon beam, since for TPS commissioning the
suggested dose accuracy in inhomogeneous phantoms is usually 3% - 2 mm in the high dose
3.2.2. 18 MEV ELECTRON BEAM
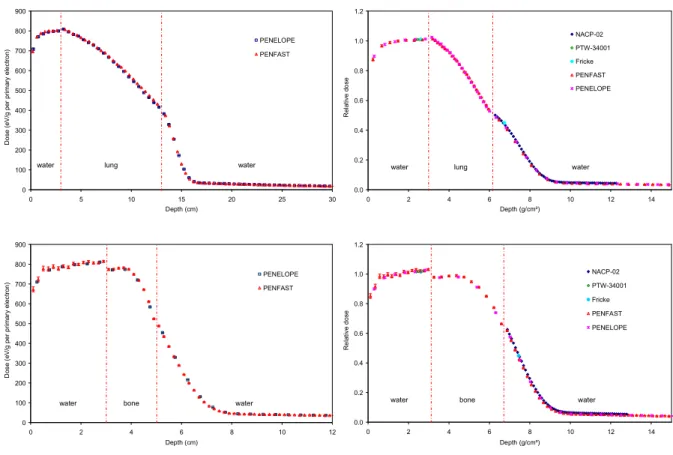
The comparisons between measured and simulated depth-dose curves with
PENELOPE and PENFAST, for the water-lung-water and the water-bone-water phantoms,
are shown in figures 4(a) and (b) respectively. The same voxel size was used for the
PENELOPE and PENFAST simulations. This was set to 4 mm for the water-lung-water
phantom and 2 mm for the water-bone-water phantom, in order to conserve the correct
material composition and mass density at the centre of each voxel.
0 100 200 300 400 500 600 700 800 900 0 5 10 15 20 25 30 Depth (cm) D o s e ( e V /g p e r p ri m a ry e le c tr o n ) PENELOPE PENFAST
water lung water
0.0 0.2 0.4 0.6 0.8 1.0 1.2 0 2 4 6 8 10 12 14 Depth (g/cm²) R e la ti v e d o s e NACP-02 PTW-34001 Fricke PENFAST PENELOPE
water lung water
0 100 200 300 400 500 600 700 800 900 0 2 4 6 8 10 12 Depth (cm) D o s e ( e V /g p e r p ri m a ry e le c tr o n ) PENELOPE PENFAST
water bone water
0.0 0.2 0.4 0.6 0.8 1.0 1.2 0 2 4 6 8 10 12 14 Depth (g/cm²) R e la ti v e d o s e NACP-02 PTW-34001 Fricke PENFAST PENELOPE
water bone water
Figure 4. Electron 18 MeV beam: (a) and (b) central axis dose distributions; (c) and (d) depth-dose curves for the water-lung-water and water-bone-water phantoms respectively.
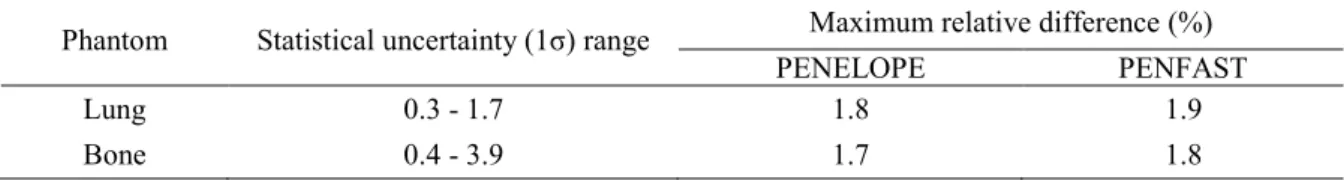
The statistical uncertainties (1σ) associated with the simulations, as well as the
maximum relative difference between the measurements (IC and Fricke dosimeter) and the
to within the statistical uncertainties of the simulations, good agreement is found between
PENFAST and PENELOPE, the largest discrepancy being less than 1% - 1 mm. Moreover, a
good agreement is found between measured and simulated depth doses with PENFAST. The
maximum relative difference between the measurements and the PENFAST simulations is
1.9% for the water-lung-water phantom, and 1.8% for the water-bone-water phantom.
Figure 4(c) shows the comparison between measured and simulated dose profiles at
depths 2.5 cm (in front of the equivalent heterogeneity) and 14.5 cm (behind the
lung-equivalent heterogeneity) in the water-lung-water phantom. The statistical uncertainty of the
simulated results was of the order of 1% in the central region of the dose profiles and between
1.5-3% in the penumbra. The agreement between the measurements and simulations is good,
the differences being usually below the 2% - 2 mm level. The maximum differences are found
especially at depth 14.5 cm and in regions which are outside the beam.
Table 2. Maximum relative difference between measurements and both PENELOPE and PENFAST simulations in the two phantoms. The statistical uncertainty (1σ) range associated with MC simulations is also shown.
Phantom Statistical uncertainty (1σ) range Maximum relative difference (%)
PENELOPE PENFAST
Lung 0.3 - 1.7 1.8 1.9
Bone 0.4 - 3.9 1.7 1.8
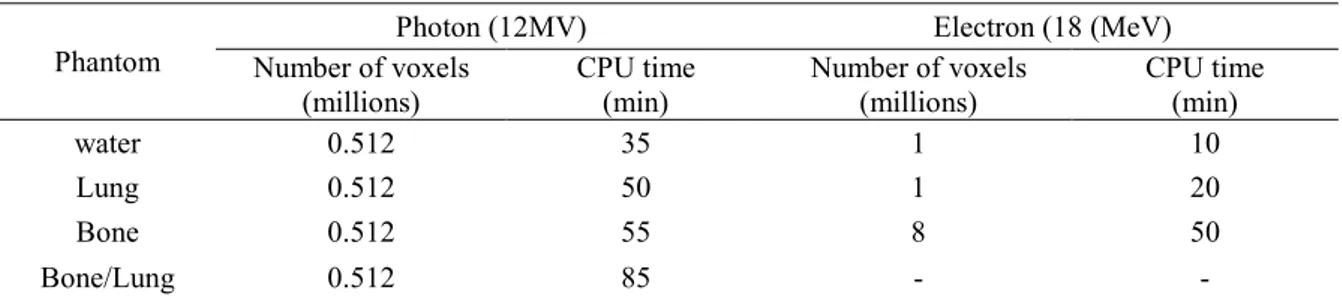
3.3. Dose calculation time
A comparison between PENELOPE and PENFAST dose calculation times obtained in
water and inhomogeneous phantoms is presented in Table 3. The PENELOPE and PENFAST
calculations are performed under the same conditions, on a cluster including 22 processors
(64 bits AMD Opteron), each equipped with 8 Go of RAM and operating at 2.4 GHz.
Therefore, the same pre-calculated PSF is used for both PENELOPE and PENFAST dose
simulation parameters used in PENELOPE are described above (Section 2.3.2), and the CPU
times are those needed to obtain a 1% average statistical uncertainty, in regions where the
dose exceeds 50% of the maximum dose.
Table 3. PENFAST computation times depending on the beam quality and number of voxels defining the phantom.
Phantom
Photon (12MV) Electron (18 (MeV)
Number of voxels (millions) CPU time (min) Number of voxels (millions) CPU time (min) water 0.512 35 1 10 Lung 0.512 50 1 20 Bone 0.512 55 8 50 Bone/Lung 0.512 85 - -
As noted in Table 3, the CPU time required by PENFAST is generally of the order of a
few minutes, whereas PENELOPE requires several hours on the 22 PC network. Depending
on the simulated configuration, PENFAST is estimated to be about 14-20.5 times faster than
PENELOPE for photons, and 9-10.5 times faster than PENELOPE for electrons. The main
reason for the largest execution speed gain in PENFAST face to the general-purpose
PENELOPE code is the use of pre-calculated data in PENFAST (i.e. look-up tables of
interaction properties are pre-generated for wide angles and various energy ranges, using
some of the subroutines of PENELOPE), whereas with PENELOPE these data are determined
during the particle transport simulation (as in any other conventional MC code). In that way a
large part of calculation time is made before the use of PENFAST as a hidden execution time.
It is difficult to make an accurate comparison between the CPU times obtained using
PENFAST and other available dose calculation engines, since the simulation time depends on
the beam quality, the number of histories, the number of voxels used to define the patient
anatomy, the number of histories per cm², the simulation parameters, the number of voxels
defining the geometry, and CPU characteristics. However, to illustrate the typical differences
generally of the order of a few minutes for an electron beam calculation, and a few hours for a
photon beam calculation on a standard CPU. PENFAST is thus able to provide considerably
shorter computing times for photons, and similar computing times for electrons, when
compared to other existing systems. It must be noted that compared to the abovementioned
fast simulation codes, PENFAST does not rely on virtual source models or MC kernels for
performing MC treatment planning, but on a detailed description of the whole geometry of the
accelerator together with a full MC simulation from the exit of the bending magnet down to
the patient [9-11]. This approach allows the possibility of accurately estimating the absorbed
dose in the patient.
4. Conclusions
The work presented in this paper demonstrates that, for photon and electron beams,
PENFAST provides results which are equivalent, in terms of accuracy (with discrepancies of
less than 1% - 1 mm), and which are substantially faster than those obtained using
PENELOPE. The PENFAST code can run 9-21 times faster than the PENLEOPE code,
depending on the beam quality and simulation geometry. In addition, the good agreement
found between PENFAST simulations and measurements in inhomogeneous phantoms
(generally within ± 2% - 2 mm relative agreement) demonstrates this code’s ability to produce
accurate photon and electron dose simulations, in situations with fluence disturbances in the
regions of electronic equilibrium.
However, more testing will be needed before PENFAST can be used in a clinical
environment. For example, the issue of accurate dose calculations in small field conditions is
important for the evaluation of the MC code, in situations where lateral electron
disequilibrium can be significant. Another important topic involves the conversion of HUs to
voxel in the CT scan geometry. As this data is used as an input to the MC dose simulations,
an accurate conversion is required in order to guarantee suitable accuracy in the dose
calculations. These issues, along with others, are at the focus of current studies.
Acknowledgments
We would like to thank L Blazy, A Ostrowsky, D Baltes and other members of the
LNHB laboratory for their contributions to the experimental parts of this study. We are
grateful to Pr. F Salvat from the University of Barcelona, for providing the PENFAST source
code and programs used to generate our materials database. This work was performed in the
framework of a PHD thesis funded by the CEA for the TELEDOS and MAESTRO projects.
References
[1] Chetty IJ, Curran B, Cygler JE, DeMarco JJ, Ezzell G, Faddegon BA, Kawrakow I, Keall
PJ, Liu H, Ma CM, Rogers DW, Seuntjens J, Sheikh-Bagheri D, Siebers JV. Report of the
AAPM Task Group No. 105: issues associated with clinical implementation of Monte
Carlo-based photon and electron external beam treatment planning. Med. Phys. 2007; 34: 4818-53
[2] Reynaert N, van der Marck SC, Schaart DR, Van der Zee W, Van Vliet-Vroegindeweij C,
Tomej M, Jansen J, Heijmen B, Coghe M and De Wagter C. Monte Carlo treatment planning
for photon and electron beams. Radiat. Phys. Chem. 2007; 76: 643-86
[3] Neuenschwander H, Mackie TR and Reckwerdt PJ. MMC – A high-performance Monte
Carlo code for electron beam treatment planning. Phys. Med. Biol. 1995; 40: 543-74
[4] Keall PJ and Hoban PW. Super-Monte Carlo – a 3D electron beam dose calculation. Med.
Phys. 1996; 23: 2023-34
[5] Kawrakow I, Fippel M and Friedrich K. 3D Electron Dose Calculation using a Voxel
[6] Hartmann Siantar CL, Walling RS, Daly TP, Faddegon B, Albright N, Bergstrom P,
Bielajew AF, Chuang C, Garrett D, House RK, Knapp D, Wieczorek DJ and Verhey LJ.
Description and dosimetric verification of the PEREGRINE Monte Carlo dose calculation
system for photon beams incident on a water phantom. Med. Phys. 2001; 7: 1322-37
[7] Sempau J, Wilderman SJ and Bielajew AF. DPM – a fast, accurate Monte Carlo code
optimized for photon and electron radiotherapy treatment planning dose calculations. Phys.
Med. Biol. 2000; 45: 2263-91
[8] Ma CM, Li JS, Pawlicki T, Jiang SB, Deng J, Lee MC, Koumrian T, Luxton M and Brain
S. A Monte Carlo dose calculation tool for radiotherapy treatment planning. Phys. Med. Biol.
2002; 47: 1671-89
[9] Salvat F. Photons: theoretical background-PENELOPE Symposium on Monte Carlo
treatment planning systems: for a new paradigm in radiotherapy. Institut Gustave Roussy
Villejuif, France 2008
[10] Salvat F. Electrons: theoretical background-PENELOPE Symposium on Monte Carlo
treatment planning systems: for a new paradigm in radiotherapy. Institut Gustave Roussy
Villejuif, France 2008
[11] Salvat F, Brualla L, Sempau J. Simulation of electron-photon transport in CT
structures using PENELOPE and a new dedicated transport algorithm. In preparation.
[12] DOSIsoft. 45/47, avenue Carnot - 94230 Cachan – France. http://www.dosisoft.com/
[13] Baró J, Sempau J, Fernández-Varea JM, Salvat F. PENELOPE: An algorithm for
Monte Carlo simulation of the penetration and energy loss of electrons and positrons in
matter. Nucl. Instr. and Meth. B 1995; 100: 31-46
[14] Salvat F, Fernández-Varea JM, Acosta E, Sempau J. PENELOPE – A Code System
for Monte Carlo Simulation of Electron and Photon Transport. OECD ISBN 92-64-18475-9,
[15] Salvat F, Fernández-Varea JM, Sempau J. PENELOPE-2006, A Code System for
Monte Carlo Simulation of Electron and Photon Transport. OECD ISBN 92-64-02301-1,
Barcelona, Spain 2006.
[16] Isambert A, Brualla L, Benkebil M, Lefkopoulos D. DVH-based study for determining
the optimum statistical uncertainty and voxel size to perform electron-beam Monte Carlo
absorbed dose estimation. In preparation.
[17] Lux I and Koblinger L. Monte Carlo Particle Transport Methods: Neutron and Photon
Calculations. CRC Press. 1991.
[18] Kawrakow I and Fippel M. Investigation of variance reduction techniques for Monte
Carlo photon dose calculation using XVMC. Phys. Med. Biol. 2000; 45: 2163-84
[19] Sempau J, Fernandez-Varea JM, Acosta E and Salvat F. Experimental benchmarks of
the Monte Carlo code PENELOPE. Nucl. Instr. and Meth. B 2003; 207: 107-23
[20] Carrasco P, Jornet N, Duch MA, Weber L, Ginjaume M, Eudaldo T, Jurado D, Riuz A
and Ribas M. Comparison of dose calculation algorithms in phantoms with lung equivalent
heterogeneities under conditions of lateral electronic equilibrium. Med. Phys. 2004; 31:
2899-911
[21] Carrasco P, Jornet N, Duch MA, Panettieri V, Weber L, Eudaldo T, Ginjaume M, and
Ribas M. Comparison of dose calculation algorithms in slab phantoms with cortical bone
equivalent heterogeneities. Med. Phys. 2007; 34: 3323-33
[22] Blazy L, Baltes D, Bordy JM, Cutarella D, Delaunay F, Gouriou J, Leroy E,
Ostrowsky A and Beaumont S. Comparison of PENELOPE Monte Carlo dose calculations
with Fricke dosimeter and ionization chamber measurements in inhomogeneous phantoms (18
MeV electron and 12 MV photon beams). Phys. Med. Biol. 2006; 51: 5951-65
[23] International Atomic Energy Agency (IAEA 2000). Absorbed Dose Determination in
[24] Poumarède B, Tola F, Habib B. TELEDOS : Bulletin de validation pour code de
calcul (gain en performance et en précision). Délivrable TELEDOS SP2.4. 2008
[25] Verhaegen F and Devic S. Sensitivity study for CT image use in Monte Carlo
treatment planning. Phys. Med. Biol. 2005; 50: 937-46
[26] Venselaar J, Welleweerd H, Mijnheer B. Tolerances for the accuracy of photon beam
dose calculations of treatment planning systems. Radiother. Oncol. 2001; 60: 191-201
[27] International Atomic Energy Agency (IAEA 2004). Commissioning and quality
assurance of computerized planning systems for radiation treatment of cancer. Technical