HAL Id: hal-02352293
https://hal.univ-lorraine.fr/hal-02352293
Submitted on 6 Nov 2019
HAL is a multi-disciplinary open access
archive for the deposit and dissemination of
sci-entific research documents, whether they are
pub-lished or not. The documents may come from
teaching and research institutions in France or
abroad, or from public or private research centers.
L’archive ouverte pluridisciplinaire HAL, est
destinée au dépôt et à la diffusion de documents
scientifiques de niveau recherche, publiés ou non,
émanant des établissements d’enseignement et de
recherche français ou étrangers, des laboratoires
publics ou privés.
Molecular emissions in sonoluminescence spectra of
water sonicated under Ar- based gas mixtures
R. Pflieger, E Fayard, T. Belmonte, C. Noël, Sergey I. Nikitenko
To cite this version:
R. Pflieger, E Fayard, T. Belmonte, C. Noël, Sergey I. Nikitenko. Molecular emissions in
sonolumi-nescence spectra of water sonicated under Ar- based gas mixtures. 24th International Symposium on
Plasma Chemistry (ISPC 24), Jun 2019, Naples, Italy. �hal-02352293�
Molecular emissions in sonoluminescence spectra of water sonicated under
Ar-based gas mixtures
R. Pflieger1, E. Fayard1, T. Belmonte2, C. Noel2 and S.I. Nikitenko1
1Institut de Chimie Séparative de Marcoule, ICSM UMR 5257 – CEA, CNRS, Univ Montpellier, ENSCM,
Bagnols-sur-Cèze Cedex, France
2Université de Lorraine, Institut Jean Lamour, UMR CNRS 7198, Nancy, France
Abstract: Sonoluminescence (SL) spectroscopy is one of the very few ways to study the
plasma formed in solutions submitted to ultrasound. Unfortunately, up to now only very limited emission bands were reported in SL spectra of aqueous solutions. It is shown here that by adding some N2 and/or CO2 in Ar, new molecular emissions can be observed and
that rovibronic temperatures can be derived.
1. Introduction
When a liquid is irradiated with ultrasounds (with a frequency in the range 20 kHz – 1 MHz), a particular chemical activity is observed, called sonochemistry. Its origin is acoustic cavitation: nucleation, growth and violent collapse of microbubbles containing dissolved gases and vapour of the bulk liquid. The formation of a plasma in cavitation bubbles at collapse is now widely admitted1 even though the underlying mechanism remains
unclear. Moreover characterization of this plasma is not straightforward due to its small size (< 1 µm), its short lifespan (< 1 µ s) and the stochastic (non-predictable) nature of its apparition. Two main directions can be followed to study it: monitoring of its chemical activity and emission spectroscopy of sonoluminescence (SL, the light emitted by the sonochemical plasma). This work focuses on the different spectroscopic probes that can be observed in SL spectra of water irradiated at 362 kHz under different gas mixtures in Ar.
2. Experimental
Deionized water (Milli-Q 18.2 MΩ cm) was used. Ar and mixtures of N2 (5%) or CO2 (0.5%) in Ar were
provided by Air Liquide (purity > 99.999%).
For all experiments, 250 mL of deionized water were placed in a thermostated glass reactor equipped with a 362-kHz transducer (ELAC Nautik, 25 cm2) at its bottom.
The absorbed acoustic power was determined calorimetrically (Pac = 43 W). The solution was submitted
to a continuous gas flow (82 mL/min) starting half an hour before the experiment and maintained during the ultrasonic treatment. Emission spectra of sonoluminescence were collected through a flat quartz window mounted on the sonoreactor and recorded in the spectral range 250-650 nm by means of SP 2356i Roper Scientific spectrometer (gratings 150blz500, 600blz300 and 1200blz300) coupled with a CCD camera that is equipped with UV coating (SPEC10-100BR Roper Scientific) cooled by liquid nitrogen. Spectral calibration was performed using a Hg(Ar) pen-ray lamp (LSP035, LOT-Oriel). The spectra acquisition was started after reaching a steady-state temperature. For each experiment,
at least ten 300-s (150blz500 grating), respectively 600-s (600blz300 and 1200blz300 gratings), spectra were averaged and corrected for the background noise and for the quantum efficiencies of gratings and CCD. Gases formed during the sonolysis were measured online by mass spectrometry (Prima BT, Thermo Fischer Scientific).
3. Results
3.1. Sonoluminescence emission spectra
Figure 1 presents the UV parts of SL spectra of water sonicated at 362 kHz under Ar-5%N2, Ar-0.5%CO2 and
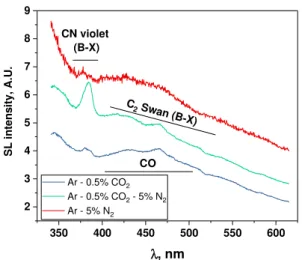
Ar-0.5%CO2-5%N2 gas flows, and Figure 2 their visible
parts.
Fig. 1: UV part of SL spectra of water under Ar-5%N2,
Ar-0.5%CO2 and Ar-0.5%CO2-5%N2 (362 kHz, 14°C,
600blz300 grating). 240 260 280 300 320 340 360 1.0 1.5 2.0 2.5 3.0 NH (A-X) S L i n te n s it y , A .U . λ, nm Ar - 5% N 2 Ar - 0.5% CO2 Ar - 0.5% CO 2 - 5% N2 OH (A-X)
Fig. 2: Visible part of SL spectra of water under Ar-5%N2, Ar-0.5%CO2 and Ar-0.5%CO2-5%N2 (362 kHz,
14°C, 150blz500 grating).
Like the usually reported SL spectrum of water under Ar, they show an intense continuum spanning from the UV to the near IR and the emission from excited OH radicals (OH (A-X)). The latter arises from the dissociation of water molecules in cavitation bubbles at collapse:
H2O ))) H + OH (1)
When the saturating gas is Ar-5%N2, a molecular
emission is present around 337 nm that is assigned to NH (A-X).2 One mechanism of formation of this excited
species is:
N2 ))) 2 N (2)
N + H NH (3)
The sonolysis of water in the presence of Ar-0.5%CO2
gas mixture leads to a complex SL spectrum. A tiny peak appears near 386 nm and is attributed to CN violet3; CN
can be formed in the presence of air traces:4
N2 + CO2 ))) CN + NO2 (4)
Besides, the maxima of C2 Swan bands are recognizable
but superimpose with a broad not-well-defined emission, likely CO (X-X)3:
CO2 ))) CO +1/2 O2 (5)
CO2 + H ))) CO + OH (6)
The presence of CO was confirmed by mass spectrometry analysis of the outlet gas.
Adding conjointly 0.5% CO2 and 5% N2 in Ar leads to
the observation of OH (A-X), NH (A-X), CN violet (confirming the nature of the emission at 386 nm) and C2
Swan bands. The absence of CO emission and the absence of CO in the outlet gas can be traced back to the reaction4
of CO with N2:
N2 + CO ))) CN + NO (7)
3.2. Derived rovibronic temperatures
Molecular emissions observed in SL spectra were simulated whenever possible using Specair software5.
Derived rovibronic temperatures are summarized in Table 1 in the form vibrational temperature Tv / rotational
temperature Tr.
Table 1. Estimated rovibronic temperatures (± 1000 K unless otherwise specified).
Gas OH NH C2 CN Ar – 5% N2 11500 K / 6500 K 10000 K / 10000 K Ar – 0.5% CO2 11500 K / 6500 K Ar – 0.5% CO2 - 5% N2 11500 K / 6500 K 22000 K / 5000 K 10000-15000 K / 10000 K 4. Conclusion
Although it was long considered that SL spectra of aqueous solutions were relatively featureless compared to those of exotic liquids (e.g. concentrated sulfuric acid), thus strongly limiting the possibility to study the formed plasma, this study shows that besides usual OH and C2
emissions and the recently reported NH one, at least two more molecular emissions can be observed in high-frequency SL spectra of aqueous solutions, namely CN and CO. This finding enriches the “toolbox” available to characterize the sonochemical plasma, the conditions reached at collapse of cavitation bubbles and the chemical reactions taking place in bubble cores.
5. References
[1] P.J. Bruggeman, et al., Plasma-liquid interactions: a review and roadmap, Plasma Sources Science & Technology, 25(5), 053002 (2016)
[2] T. Ouerhani, R. Pflieger, W. Ben Messaoud, and S.I. Nikitenko, Journal of Physical Chemistry B, 119, 15885−15891 (2015)
[3] R.W.B. Pearse, and A.G. Gaydon, The Identification
of Molecular Spectra. 4th ed.; Chapman and Hall: London, 1976.
[4] G. Schlesinger, and S.L. Miller, Journal of Molecular Evolution, 19 (5), 383-390 (1983)
[5] C.O. Laux, T.G. Spence, C.H. Kruger, R.N. Zare, Plasma Sources Science & Technology, 12 (2), 125-138 (2003). 350 400 450 500 550 600 2 3 4 5 6 7 8 9 CO C2 Swan (B-X) CN violet (B-X) S L i n te n s it y , A .U . λ, nm Ar - 0.5% CO2 Ar - 0.5% CO2 - 5% N2 Ar - 5% N2