HAL Id: cea-03086182
https://hal-cea.archives-ouvertes.fr/cea-03086182
Submitted on 22 Dec 2020HAL is a multi-disciplinary open access archive for the deposit and dissemination of sci-entific research documents, whether they are pub-lished or not. The documents may come from teaching and research institutions in France or abroad, or from public or private research centers.
L’archive ouverte pluridisciplinaire HAL, est destinée au dépôt et à la diffusion de documents scientifiques de niveau recherche, publiés ou non, émanant des établissements d’enseignement et de recherche français ou étrangers, des laboratoires publics ou privés.
A Common Data Format for Mass Spectrometry
Imaging
Andreas Römpp, Thorsten Schramm, Alfons Hester, Ivo Klinkert, Jean-Pierre
Both, Ron M. A. Heeren, Markus Stoeckli, Bernhard Spengler
To cite this version:
Andreas Römpp, Thorsten Schramm, Alfons Hester, Ivo Klinkert, Jean-Pierre Both, et al.. imzML: Imaging Mass Spectrometry Markup Language: A Common Data Format for Mass Spectrometry Imaging. Methods in Molecular Biology, Humana Press/Springer Imprint, 2011, 696, pp.205-224. �10.1007/978-1-60761-987-1_12�. �cea-03086182�
Chapter 12
imzML: Imaging Mass Spectrometry Markup Language:
A Common Data Format for Mass Spectrometry Imaging
Andreas Römpp, Thorsten Schramm, Alfons Hester, Ivo Klinkert,
Jean-Pierre Both, Ron M.A. Heeren, Markus Stöckli,
and Bernhard Spengler
Abstract
Imaging mass spectrometry is the method of scanning a sample of interest and generating an “image” of the intensity distribution of a specific analyte. The data sets consist of a large number of mass spectra which are usually acquired with identical settings. Existing data formats are not sufficient to describe an MS imaging experiment completely. The data format imzML was developed to allow the flexible and efficient exchange of MS imaging data between different instruments and data analysis software.
For this purpose, the MS imaging data is divided in two separate files. The mass spectral data is stored in a binary file to ensure efficient storage. All metadata (e.g., instrumental parameters, sample details) are stored in an XML file which is based on the standard data format mzML developed by HUPO-PSI. The original mzML controlled vocabulary was extended to include specific parameters of imaging mass spectrometry (such as x/y position and spatial resolution). The two files (XML and binary) are connected by offset values in the XML file and are unambiguously linked by a universally unique identifier. The resulting datasets are comparable in size to the raw data and the separate metadata file allows flexible handling of large datasets.
Several imaging MS software tools already support imzML. This allows choosing from a (growing) number of processing tools. One is no longer limited to proprietary software, but is able to use the pro-cessing software which is best suited for a specific question or application. On the other hand, measure-ments from different instrumeasure-ments can be compared within one software application using identical settings for data processing. All necessary information for evaluating and implementing imzML can be found at http://www.imzML.org.
Imaging mass spectrometry is the method of scanning a sample of interest and generating an “image” of the intensity distribution of a specific analyte. The principle of this method is shown
1. Introduction
205
Michael Hamacher et al. (eds.), Data Mining in Proteomics: From Standards to Applications, Methods in Molecular Biology, vol. 696, DOI 10.1007/978-1-60761-987-1_12, © Springer Science+Business Media, LLC 2011
in Fig. 1. The application of MS imaging is rapidly growing with a constantly increasing number of different instrumental systems and software tools. An overview of methods and applications of mass spectrometry imaging has been recently published (1). This method results in a large number of spectra which are typically acquired with identical measurement parameters. The data for-mat described in this chapter was developed within the EU-funded project COMPUTIS (2). The goal of this project was to develop new and improved technologies for molecular imaging mass spec-trometry. An important task was the comparison of images gener-ated by diverse types of mass spectrometers. Therefore a standard format for the exchange of MS imaging data was needed. Both the DICOM standard for in-vivo imaging data (3) and the mzML standard (4) by HUPO-PSI (5, 6) are not able to completely represent an imaging MS experiment. Therefore a standardized data format was developed to simplify the exchange of imaging MS data between different instrument and data analysis software. The following institutions were involved in the development of imzML: Justus Liebig University (JLU), Giessen, Germany; FOM Institute for Atomic and Molecular Physics (FOM), Amsterdam, The Netherlands; Commissariat à l’Énergie Atomique (CEA), Saclay, France; and Novartis Institutes for BioMedical Research (Novartis), Basel, Switzerland.
Several data formats for MS imaging utilize two separate files: a small file (ini or XML) for the metadata and a larger (binary) file for the mass spectral data (e.g., Biomap (7) and internal data for-mats at FOM and JLU). This structure proved to be very useful for flexible and fast handling of the imaging MS data and it was decided to follow this approach for the new data format. In order to keep as close as possible to existing formats, we decided that the (small) metadata file should be based on the mass spectrom-etry standard mzML developed by HUPO-PSI (8). A more detailed discussion on why mzML was not fully implemented and about the relation between the two data formats (mzML and imzML) is found in Note 1. A new controlled vocabulary was
Fig. 1. Schematic process of scanning microprobe MALDI-MS. A desorption laser scans the surface of the target (e.g., a cell or tissue). The intensity of a selected peak in the resulting mass spectrum is transformed into a pixel of a grayscale image.
compiled for imzML to include parameters that are specific for imaging experiments (see Subheading 2.1.2). All relevant infor-mation about imzML including specifications and example files can be found at http://www.imzML.org.
The following section describes the design philosophy of imzML. The data structure is discussed in more detail in
Subheading 2. Properties and possibilities of imzML files are dis-cussed in Subheading 4. Available software applications including an example for a file converter are presented in Subheading 5.
The fundamental goal while developing imzML was to design a data format for the efficient exchange of mass spectrometry imag-ing data. At the same time, the format should be easily inter-changeable with mzML.
The main goals can be summarized as
1. Ensure complete description of imaging MS experiments 2. Minimize file size
3. Ensure fast and flexible data handling
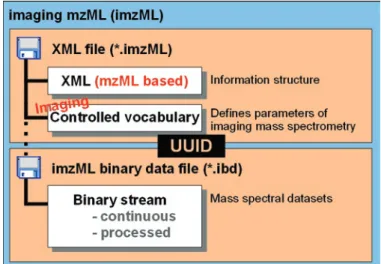
4. Keep the (XML part of) imzML as close as possible to mzML imzML consists of two separate files: one for the metadata and one for the mass spectral data. The metadata is saved in an XML file (*.imzML). The mass spectral data is saved in a binary file (*.ibd). A schematic representation of the imzML file structure is shown in Fig. 2. The connection between the two files is made via
2. imzML Data
Format
2.1. Data Structure
links in the XML file which contain the offset positions of the mass spectra in the binary file. It is important to keep in mind that the information is only valid if both files are available. Therefore the user should be very careful when copying or moving those files; inaccurate file handling can result in data loss. It is recom-mended to keep both files in the same folder and to use the same names for the .imzML part and the .ibd part.
Corresponding XML and binary files contain the same universally unique identifier (UUID) (9) in order to link them unequivocally. The UUID is a controlled vocabulary entry in the <fileContent> tag of the XML file and is also stored at the begin-ning of the binary file. Comparing both UUIDs allows finding out if the two files belong to the same measurement/data set. More details on the implementation of UUIDs are discussed in Note 2.
The XML file holds the metadata of a MS imaging experiment which is described by the mzML-based XML structure and the controlled vocabulary. The XML model of imzML is the same as for mzML (see the mzML version 1.1.0 documentation for fur-ther details) (8). The controlled vocabulary was extended in order to include additional parameters which are needed to describe an MS imaging experiment (see Subheading 2.1.2). Most of the changes in the XML part are related to cvParam mapping rules for the newly introduced parameters of the imaging controlled vocabulary. One of the most important changes compared to mzML is the function of the <binary> element which not contain base64-encoded binary data anymore. It stays empty, which is compatible to mzML 1.1.0. This results in predefined values for “encoded length” and “array length” of zero in the parent tags <spectrum> and <binaryDataArray>. The XML part of imzML passes mzML validators without errors (only warning messages for unknown cv entries are displayed). An example of XML code is given in Fig. 3. Modifications (compared to mzML) are printed bold and will be discussed in more detail in the following section.
The controlled vocabulary is used to unequivocally describe the information in the XML file. The additional imzML CV terms are stored in an open biomedical ontology ((10, 11)) – the imag-ingMS.obo file (12). They complement the mass spectrometry parameters of the MS controlled vocabulary provided by HUPO-PSI (13) in order to allow a complete description of MS imaging experiments. An overview of CV entries concerning imaging-spe-cific parameters and image properties is given in Table 1. These parameters include information about the image itself and acqui-sition parameters. For example: How many pixels does the image contain in the x and y dimension? Which position in
2.1.1. XML
2.1.2. Controlled Vocabulary
the image belongs to which spectrum? In which pattern was the image scanned? Which Matrix was used in which concentration? It is also necessary to give information about the instrumentation used. In addition to the mass spectrometer, the ablation laser type and parameters have to be documented such as wavelength, energy, and impact angle. The sample stage also plays an essential role when generating an image: step size and position accuracy. The parameters concerning the scanning process are explained in more detail in Subheading “Image Orientation”.
Additional entries were included, which are necessary for han-dling the external binary file. Four parameters were introduced
Table 1
Additional parameters of the controlled vocabulary
ibd file:External binary uri Location as an URI where to find the ibd file. ibd checksum:
ibd MD5 MD5 (Message-Digest algorithm 5) is a cryptographic hash function with a 128-bit hash value used to check the integrity of files.
ibd SHA-1 SHA-1 (Secure Hash Algorithm-1) is a cryptographic hash function designed by the National Security Agency (NSA) and published by the NIST as a U. S. government standard. It is also used to verify file integrity.
ibd binary type:
Continuous Way of saving spectra in an imzML binary data file (ibd). The m/z values for all spectra are saved at the beginning of the ibd file. Then the spectral values follow.
Processed Way of saving spectra in an imzML binary data file (ibd). Every spectrum is saved with its own m/z and intensity values. ibd identification:
Universally unique identifier Universally unique identifier is unique throughout the world and allows to doubtlessly identify the ibd file.
ibd offset handle:
External array length Describes how many fields the external data array contains. External data Shows that there is no data in the <binary> section of the file but
saved in an external file.
External encoded length Describes the length of the written data stream in byte. External offset The position in byte where the data of the data array of a mass
spectrum begins. Image:
Absolute position offset x Describes the position at the x-axis of the upper left point of the image on the target.
Absolute position offset y Describes the position at the y-axis of the upper left point of the image on the target.
Max count of pixels x Maximum number of pixels of the x-axis of the image. Max count of pixels y Maximum number of pixels of the y-axis of the image. Max dimension x Maximum length of the image in x-axis.
Max dimension y Maximum length of the image in y-axis. Pixel size x Describes the length in x-direction of the pixels. Pixel size y Describes the length in y-direction of the pixels. Image shape Describes the shape of the image.
Laser shot mode:
Pixel mode The laser keeps the position while firing at the same spot one or several times.
Raster mode The laser is moved while continuously firing at the sample.
Stigmatic mode The laser is moved around one point firing until moved to the next position (pixel).
Table 1
(continued)
Spectrum position:
Position x Attribute to describe the position of a spectrum in the direction of the x-axis in the image.
Position y Attribute to describe the position of a spectrum in the direction of the y-axis in the image.
Position z Attribute to describe the position of a spectrum in the direction of the z-axis in the image.
Subimage position x Describes the position of a subimage in the direction of the x-axis of the complete image.
Subimage position y Describes the position of a subimage in the direction of the y-axis of the complete image.
Subimage position z Describes the position of a subimage in the direction of the z-axis of the complete image.
Sample stage:
Target material Describes the material the target is made of. Linescan sequence:
Bottom up The starting point is at the bottom of the sample and the sequence of the linescans is in up direction (parallel to the y-axis).
Top down The starting point is at the top of the sample and the sequence of the linescans is in bottom direction (parallel to the y-axis). Left right The starting point is at the left of the sample and the sequence of
the linescans is in right direction (parallel to the x-axis).
Right left The starting point is at the right of the sample and the sequence of the linescans is in left direction. (parallel to the x-axis).
No direction The linescans are performed randomly on the sample without any sequence.
Scan pattern:
Meandering The scanning happens in non-stop way. As soon as the end of the sample is reached, the scanning direction will be switched and the scanning is continued. There is no new positioning necessary. Flyback The scanning always happens in the same direction. As soon as the
end of the sample is reached, the stage is positioned at the starting edge to begin the next run.
Random access The scanning points are randomly chosen and do not follow a pattern.
Scan type:
Horizontal linescan The scanning line is a horizontal one. Vertical linescan The scanning line is a vertical one. Linescan direction:
Linescan bottom up The starting point is at the bottom of the sample and the scanning happens in up direction (parallel to the y-axis).
Linescan left right The starting point is at the left of the sample and the scanning happens in right direction (parallel to the x-axis).
Linescan right left The starting point is at the right of the sample and the scanning happens in left direction. (parallel to the x-axis).
Linescan top down The starting point is at the top of the sample and the scanning happens in bottom direction (parallel to the y-axis).
into the controlled vocabulary to describe the position and length of the data in the binary file. The “external data” parameter indi-cates that the mass spectral data is stored in a binary file. The parameter “external offset” holds the information at which byte in the binary file the data of the corresponding array starts. If one adds the value of the “external encoded length” to the value of the “external offset” the result has to be equal to the “external offset” of the following binary data array. The parameter “exter-nal encoded length” describes the byte length, which has to be read to obtain all the data of the array completely. The parameter “external array length” indicates the number of values of the array.
A separate checksum for the binary file was added in order to find out if the external file has been manipulated or corrupted. It can be either a SHA-1 (Secure Hash Algorithm) or a MD-5 (Message-Digest Algorithm) hash.
Ensuring the integrity and authenticity of digital data is of growing importance in today’s information management systems especially for companies who have to operate in accordance with GLP regulations (14). Therefore imzML contains a mechanism to monitor (intentional or accidental) modifications of the data. This feature is based on asymmetric cryptosystems, also known as public key systems and hash functions. The checksum of the binary file is encrypted with a personal key. A public key is needed in order to verify the integrity of the checksum (and therefore the data). This feature (in its basic version) only requires three addi-tional CV entries in the XML file and can thus be easily added to existing imzML files. This modular setup also allows for changing the used encryption procedure, e.g., when one method turns out not to be secure anymore. The encryption is an additional optional feature. This means the data is still readable without the public key, but authenticity cannot be tested in this case. This will pro-tect data against loss (e.g., when one of the keys is lost) and also ensures readability of the data with (older) software that does not include the encryption feature.
The pixel in the upper left corner of the MS image is defined as position 1/1 (Fig. 4). This way every application should generate images of identical orientation. This particular orientation was chosen because it is used for image acquisition in several MS imaging systems. The information of x and y position is part of the CV parameters in the <spectrum> tag of each mass spectrum (see also Fig. 3).
Information about the pattern and sequence in which an image was acquired is not necessary for generating an image from the imzML file (because x and y position are specified for each indi-vidual spectrum). But these parameters can be very important for
2.1.2.1. Image Orientation
data analysis and interpretation and are therefore part of the imzML controlled vocabulary. The scan process is unambiguously described by four parameters. The different scan parameters are
illustrated by examples in Fig. 5. The parameter scan pattern
gives information if the sample was scanned in fly-back or mean-dering mode. Fly-back means that the linescans always occur in
the same direction. Meandering indicates that the linescans occur in alternating direction. The scan type defines horizontal or ver-tical linescans. The linescan direction defines the direction of
the (first) linescan(s). The linescan sequence specifies the
chron-ological order of the linescans.
Fig. 4. sample orientation.
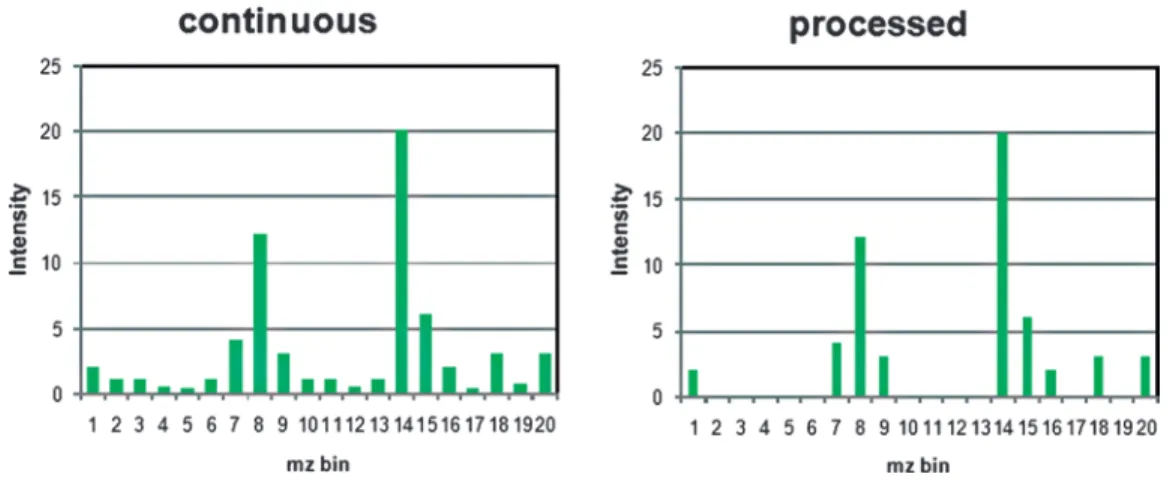
The imaging binary data file (*.ibd) contains the mass spectral data of the MS imaging measurement. The first 16 bytes of the binary file are reserved for the UUID. This identifier is also saved in the corresponding XML file so that a correct assignment of ibd and XML file is possible even if the names of both files are differ-ent. In order to ensure efficient storage, two different binary modes are defined: continuous and processed. Schematic
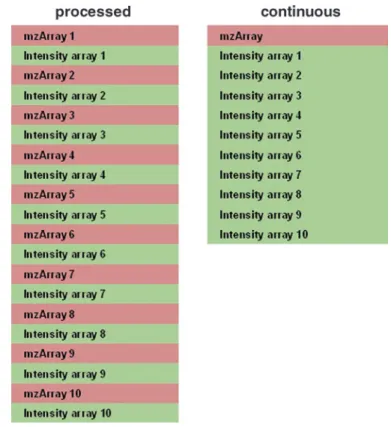
exam-ples of these two data types are shown in Fig. 6. “Continuous” means that an intensity value is stored for each m/z bin even if there is no signal (resulting in an intensity of zero). As a result, the m/z axis is identical for all spectra of one image (if the mass range and bin size is not changed). Therefore it is sufficient to store the m/z array only once in the binary file (directly behind the UUID). For each of the spectra only the corresponding inten-sity values are stored. This structure can reduce the file size sig-nificantly (see Subheading 3).
On the other hand mass spectra are often processed before they are stored, e.g., for noise-reduction, peak-picking, deisotoping. This results in discontinuous and non-constant m/z arrays. In this case, the m/z array has to be stored for each spectrum separately. These data are stored as alternating m/z and intensity arrays in the binary file of imzML. The different storage types are illus-trated in Fig. 7. More information on choosing the right binary mode is given in Note 3.
The second parameter influencing the file size is the binary data type, which is used to store the values of the spectra. The
imzML binary format allows the storage of values in the following signed integer types: 8 bit, 16 bit, and 32 bit. The values can also be saved in floating point data types (IEEE 754): 32 bit (single precision) or 64 bit (double precision). The byte order of mass spectral data in imzML is little endian (see also Note 2). One value saved in the 32 bit integer type needs four bytes of disk space. The disk space needed by all values of all spectra determines the
2.1.3. Binary Data File
overall file size. Therefore the choice of the data types for intensity and m/z values directly influences the file size of the binary file. The data type is specified for each binary data array separately by CV parameters. More details can be found in Note 4.
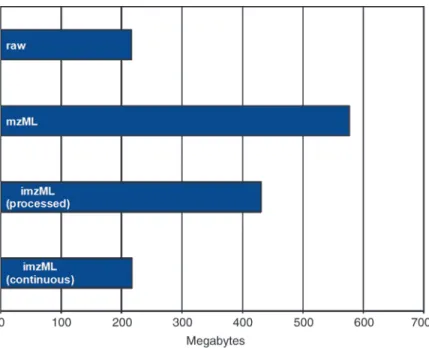
The efficient data storage of the imzML format is demonstrated by an example file consisting of 7,000 spectra (Fig. 8). This file represents a measurement on a linear ion trap mass spectrometer (LTQ, Thermo Scientific GmbH, Bremen) (linear ion trap) of 50 by 35 pixel with four spectra (profile mode) acquired for each pixel. The original raw data in the proprietary LTQ format has a file size of 215 MB. The imzML files were saved with the follow-ing settfollow-ings: m/z values were stored as 32 bit float and intensity values as 32 bit integer. Conversion of this data to an mzML file results in a file size of 577 MB. The imzML files are 430 MB and 217 MB for the processed and continuous mode, respectively. The smaller size of the processed imzML file compared to the mzML file is mainly due to base64 encoding of the mass spectral
3. imzML File
Properties
data in the mzML file. The even smaller file size of the continuous imzML file is due to the fact that the m/z array (which is identical for all mass spectra) is stored only once at the beginning of the binary file (see Subheading 2.1.3 for more details). The continu-ous imzML file is slightly larger (2 MB) than the original raw file. In addition to the smaller overall size of the imzML files, the small XML file (several MB) can be used to distribute metadata over the network. This information can be used to select interest-ing measurements for which the (large) binary files are down-loaded selectively (as opposed to downloading the complete dataset for all samples).
imzML is already implemented in a number of software tools (some of them are available on http://www.imzML.org). Several vendors of mass spectrometry imaging instrumentation support the format (e.g., through export filters). Please check the imzML website (http://www.imzML.org) for updated information on supported vendor platforms and available tools.
There are numerous ways to display and analyze MS imaging data and no single software application can combine all features. Therefore it is a big advantage if one can freely choose the most
4. Implementation
4.1. Displaying Tools
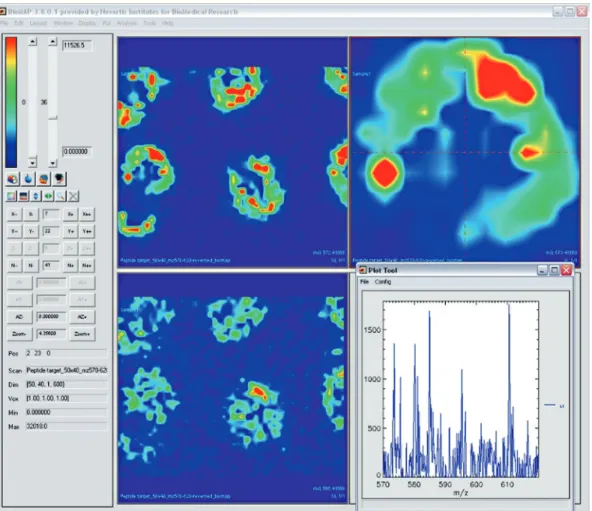
appropriate software and is not limited by (proprietary) data formats anymore. Examples of software tools that support imzML to display and analyze MS imaging data are shown in the follow-ing. A standard sample (peptide solution on a stainless steel tar-get) was used for a round-robin experiment in order to compare different mass spectrometry imaging systems. The images below show the analysis of this particular measurement on a linear ion trap mass spectrometer with different software tools. The selected ion image of m/z 573 is shown for each tool in order to verify that the data is read and displayed correctly. The specific advan-tages of each software are illustrated with selected examples.
Biomap by Novartis (Fig. 9) is one of the most widely used software tools for mass spectrometry imaging. It allows browsing through selected ion images as well as coregistration of images and includes a large number of additional analysis tools.
The Datacube Explorer tool by FOM allows dynamic
scroll-ing through masses in a dataset for fast and easy screenscroll-ing of a
dataset (Fig. 10). It also allows spectral analysis of regions of interest and contains advanced analysis features such as self-organizing maps for image classification. This tool is available for free on http://www.imzML.org.
The fxSpectViewer by CEA is especially suited for handling
very large data files without the need of binning (Fig. 11). It also
Fig. 10. Datacube Explorer (AMOLF).
includes automatic segmentation of images. This software runs under Linux and Windows.
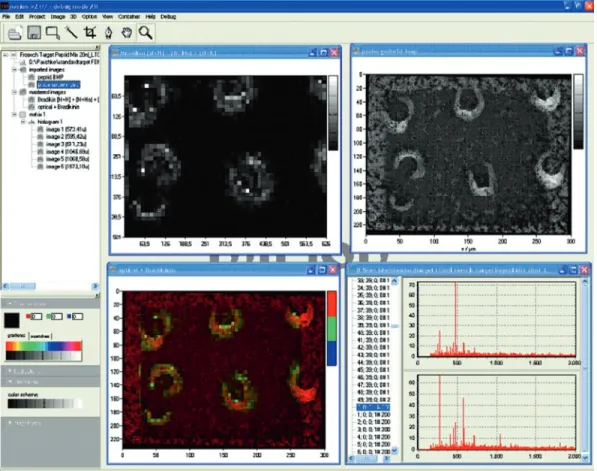
Mirion by JLU was especially developed for analyzing high
mass resolution images (Fig. 12). It allows a bin width of 0.001 mass units. This is necessary to take full advantage of the highly accurate mass data from FTMS instruments. It also allows over-laying different MS images as well as optical images. Individual mass spectra are directly accessible from the image.
Several converters for imzML are currently developed and some are already available on the imzML website (http://www.imzML. org). An example and general considerations for the conversion of proprietary data to the imzML format is discussed in the following. The example shows a software that converts LTQ-based *.RAW files (proprietary format of Thermo Scientific GmbH, Bremen).
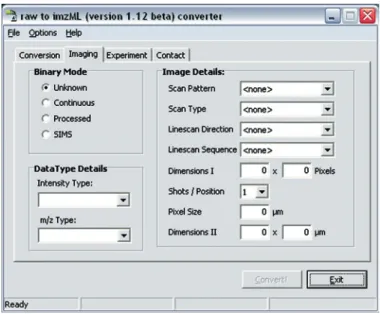
The “Conversion” tab contains details about the input RAW file. The “Imaging” tab (Fig. 13) includes the information that is essential to generate a valid imzML file – and therefore an unam-biguous image. “Binary Mode” determines in which way the data
4.2. Converters
Fig. 13. imzML converter: User interface for imaging details.
is stored in the binary file. This option can have significant influence on the size of the resulting imzML file (see also Fig. 8). A discussion on which binary mode to use (processed or continu-ous) can be found in Note 3.
The second property that influences the file size is the data type which is used to store the values of the m/z and intensity arrays. This information is included in the “Data Type Details.” Considerations for choosing the appropriate parameters are given in Note 4.
The original file might not contain all necessary information to generate a valid imzML file. This implies that the user has to add these details manually, for example, the entries on the right side (“Image Details”). The first four properties specify the char-acteristics of the scanning procedure which was used when the image was acquired (see Subheading “Scan Pattern”).
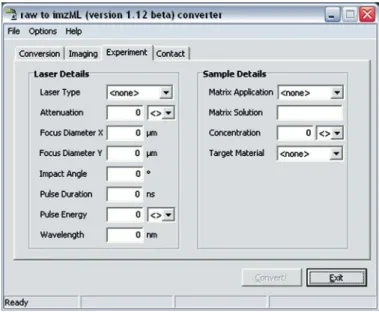
Further information to be put in manually is included in the “Experiment” tab (Fig. 14). The parameters on the left describe the laser which was used in the MALDI imaging experiment. On the right side, the properties of the sample are listed. These parameters can be included, but they are not required to create a valid imzML file
When programming such a converter it is important to keep in mind that redundant information should be avoided if possible (for the sake of small data files). Some information might be stored redundantly in XML part of imzML. If for example data is acquired within an imaging experiment, all the measurements are
usually acquired with the same instrumental settings and mea-surement conditions. Therefore it is sufficient to store this information only once per experiment and not for each spectrum separately. This redundant kind of information can nicely be merged into referenceable parameter groups (8). The file size can be reduced further by omitting CV param values that can be retrieved from the mass spectral data (e.g., base peak intensity).
1. Why not use mzML?
First of all mzML was not available at the beginning of the COMPUTIS project (2006). At later stages we evaluated mzML with respect to imaging MS data. The main concern was the file size of converted data sets. Storing the MS data in a separate binary file is crucial for handling the very large imaging MS data sets. After it became clear that our main requirement (a separate binary file) was not possible in mzML, we decided to continue with our own format. However, we decided to store our metadata in the mzML format in order to be able to easily convert between the two formats. During the last years we stayed in contact with HUPO-PSI at various occasions. The result of these discus-sions was that we call our format imzML (for imaging mzML) and that it will exist in parallel to mzML for specific use cases
5. Notes
(e.g., large data sets). The structure of the XML metadata file in imzML will remain compatible with mzML. The imaging specific CV parameters will be kept in a separate imagingMS obo file. A number of entries from this file (which were of general importance) have already been included in the PSI-MS OBO file.
imzML files can easily be converted to mzML files (with the consequence of increased file size and limited metadata) in order to use mzML-based tools.
2. Byte order of UUID
Binary data can be stored in “little endian” or “big endian” (net standard) byte order. Mass spectral data in imzML binary files is stored in little endian byte order. The universally unique identifier (UUID), however, is stored in big endian according to the RFC 4122 specifications (cf.).
Intel processors and clones use little endian, therefore integers in the computer memory are also little endian num-bers. Depending on the programming language which is used, byte order may be automatically “corrected” when reading big endian UUIDs. But some widely used program-ming languages have no such automatic correction. So the programmer has to take care of this.
In the imzML binary file the first 16 bytes are the binary representation of the UUID. A hexadecimal viewer can be used to examine these bytes, for example: 52 33 F9 E6 09 B9 4A 00 AB 01 AF 5D F4 BE 38 15.
In the corresponding imzML file the textual version of the UUID which consists of 5 blocks delimited by a “-”-char is: {5233F9E6-09B9-4A00-AB01-AF5DF4BE3815}. Be aware that in a correct implementation, both representations should have the same sequence of hexadecimal numerals.
When implementing imzML on a Microsoft operating system, one will usually use the Microsoft implementation of UUID: GUID (general unique identifier). Its memory rep-resentation is defined by:
TGUID = structure
Data1 : 4 byte unsigned integer; Data2 : 2 byte unsigned integer; Data3 : 2 byte unsigned integer; Data4 : array of 8 bytes;
end structure;
In this structure, Data1, Data2, and Data3 are numbers and therefore subject to byte order, whereas Data4 is just an array of 8 bytes (and thus independent of byte order). That means when dumping this memory representation on a little
endian computer into a binary file Data1, Data2 and Data3 are inverted whereas Data4 is not inverted.
3. Continuous or processed format
The binary mode (continuous or processed), which is used in the binary file has significant influence on the overall size of imzML files and is therefore an important parameter. Data with a continuous mass axis is often generated by time-of-flight instruments. Discontinuous data can be the result of data processing. In some cases the appropriate (most effec-tive) data format can vary for one instrument depending on the settings and mode of operation. For example, LTQ-based instruments can generate profile or continuous data in the linear ion trap mode. Measurements performed in the cen-troid mode always have to be saved as “processed” due to the discontinuous mass axis. When the acquisition is set to pro-file mode the data format depends on the mass analyzer used for the acquisition. Data from Fourier transform analyzers (ICR or Orbitrap) is always modified before storage and thus has to be stored as “processed” (because of on-the-fly data-processing). If the linear ion trap analyzer is used for detec-tion the data can be saved in continuous mode.
It is possible to convert continuous into processed data. The m/z values of the first spectrum simply have to be saved for every spectrum. After conversion, all advantages of the processed mode are usable: for example, skipping zero inten-sity values.
A special case is the storage of data acquired by secondary ion mass spectrometry (SIMS). This data is typically stored in an “event-based” format due to the much lower number of ions detected in this ionization mode. A data point consists of three values: x, y coordinates, and m/z (or time-of-flight) value. This data has to be converted in order be stored in the binary file. For each pixel the events are sorted by increasing m/z values (after conversion from time-of-flight, if neces-sary). These data have to be binned in order to be stored as mass spectra: events within a defined mass bin (e.g., 1 u) are summed up. The binned data can be stored in the binary file of the imzML format (usually in the “processed mode”). It has to be stressed again that the most efficient data
for-mat strongly depends on the type of data and has to be evalu-ated for each set of experiments.
4. How to choose the appropriate binary data type?
As already mentioned above the size of the binary file is dependent on the applied data. Choosing an unsuitable data type either results in loss of information or unnecessarily large data files. Some considerations on deciding which data type
to use for m/z and intensity values, respectively, are given below. If the data of a mass spectrometry imaging experi-ment was acquired by a very accurate mass spectrometer (e.g., FT-ICR), the accuracy of the measured m/z values
(up to eight significant digits) should be taken into account by choosing the “64 bit float” (double precision) data type (up to 15 significant digits). Storing the data in “32 bit float” (single precision) would only allow seven significant digits, resulting in a loss of precision.
Intensity values of acquired spectra can be of integer or
floating point data type. This depends on the way the ions are detected and on the digitizer of the used mass spectrom-eter. The best data type for integer values can be estimated by taking a look at the maximum intensity value of all spectra. If for example, the maximum intensity value is 125 then a data type of 8-bit integer will be sufficient to store these values. The usage of a data type with a range too small for all the values of a mass spectrometry imaging experiment will result in a loss of information. The same applies for the usage of an integer data type for floating point values, because the deci-mals of the numbers will be cut off by rounding.
References
1. McDonnell LA, Heeren RMA (2007) Imaging mass spectrometry. Mass Spectrom Rev 26:606–643
2. EU Project COMPUTIS (Accessed at http:// www.computis.org)
3. Digital imaging and communications in medicine – DICOM. (Accessed at http:// medical.nema.org)
4. Deutsch E (2008) mzML: a single, unifying data format for mass spectrometer output. Proteomics 8:2776–2777
5. Hermjakob H (2006) The HUPO proteom-ics standards initiative – Overcoming the frag-mentation of proteomics data. Proteomics 6(Suppl 2):34–38
6. Orchard S, Hermjakob H, Taylor CF et al (2005) Second Proteomics Standards Initiative Spring Workshop. Expert Rev Proteomics 2:287–289 7. Biomap. (Accessed at http://maldi-msi.org/
index.php?option=com_content&task=view &id=14&Itemid=39)
8. HUPO PSI mzML documentation version 1.1. (Accessed at http://psidev.info/index. php?q=node/257)
9. RFC 4122 – A Universally Unique IDentifier (UUID) URN Namespace. (Accessed at
http://tools.ietf.org/html/rfc4122)
10. Smith B, Ashburner M, Rosse C et al (2007) The OBO foundry: coordinated evolution of ontologies to support biomedical data integration. Nat Biotechnol 25: 1251–1255
11. Cote RG, Jones P, Martens L, Apweiler R, Hermjakob H (2008) The ontology lookup service: more data and better tools for con-trolled vocabulary queries. Nucleic Acids Res 36:372–376
12. Ontology of Mass Spectrometry Imaging. (Accessed at http://www.maldi-msi.org/ index.php?option=com_content&view=articl e&id=187&Itemid=67)
13. PSI MS obo. (Accessed at http://psidev.cvs. sourceforge.net/checkout/psidev/psi/psi-ms/mzML/controlledVocabulary/psi-ms. obo)
14. OECD (1995) The application of the princi-ples of GLP to computerised systems