HAL Id: hal-02957434
https://hal.archives-ouvertes.fr/hal-02957434
Submitted on 5 Oct 2020HAL is a multi-disciplinary open access archive for the deposit and dissemination of sci-entific research documents, whether they are pub-lished or not. The documents may come from teaching and research institutions in France or
L’archive ouverte pluridisciplinaire HAL, est destinée au dépôt et à la diffusion de documents scientifiques de niveau recherche, publiés ou non, émanant des établissements d’enseignement et de recherche français ou étrangers, des laboratoires
How laws affect the perception of norms: empirical
evidence from the lockdown
Roberto Galbiati, Emeric Henry, Nicolas Jacquemet, Max Lobeck
To cite this version:
Roberto Galbiati, Emeric Henry, Nicolas Jacquemet, Max Lobeck. How laws affect the perception of norms: empirical evidence from the lockdown. 2020. �hal-02957434�
DISCUSSION PAPER SERIES
DP15119
HOW LAWS AFFECT THE PERCEPTION
OF NORMS: EMPIRICAL EVIDENCE
FROM THE LOCKDOWN
Roberto Galbiati, Emeric Henry, Nicolas Jacquemet
and Max Lobeck
ISSN 0265-8003
HOW LAWS AFFECT THE PERCEPTION OF
NORMS: EMPIRICAL EVIDENCE FROM THE
LOCKDOWN
Roberto Galbiati, Emeric Henry, Nicolas Jacquemet and Max Lobeck
Discussion Paper DP15119
Published 01 August 2020
Submitted 30 July 2020
Centre for Economic Policy Research
33 Great Sutton Street, London EC1V 0DX, UK
Tel: +44 (0)20 7183 8801
www.cepr.org
This Discussion Paper is issued under the auspices of the Centre’s research programmes:
Public Economics
Any opinions expressed here are those of the author(s) and not those of the Centre for Economic
Policy Research. Research disseminated by CEPR may include views on policy, but the Centre
itself takes no institutional policy positions.
The Centre for Economic Policy Research was established in 1983 as an educational charity, to
promote independent analysis and public discussion of open economies and the relations among
them. It is pluralist and non-partisan, bringing economic research to bear on the analysis of
medium- and long-run policy questions.
These Discussion Papers often represent preliminary or incomplete work, circulated to encourage
discussion and comment. Citation and use of such a paper should take account of its provisional
character.
HOW LAWS AFFECT THE PERCEPTION OF NORMS:
EMPIRICAL EVIDENCE FROM THE LOCKDOWN
Abstract
Laws not only affect behavior due to changes in material payoffs, but they may also change the
perception individuals have of societal norms, either by shifting them directly or by providing
information on these norms. Using detailed daily survey data and exploiting the introduction of
lockdown measures in the UK in the context of the COVID-19 health crisis, we provide causal
evidence that the law drastically changed the perception of the norms regarding social distancing
behaviors. We show this effect of laws on perceived norms is mostly driven by an informational
channel.
JEL Classification: N/A
Keywords: N/A
Roberto Galbiati - roberto.galbiati@sciencespo.fr
CNRS-Sciences Economiques Sciences Po , https://sites.google.com/view/galbiatir1/ and CEPR
Emeric Henry - emeric.henry@sciencespo.fr
Sciences-Po Paris and CEPR
Nicolas Jacquemet - nicolas.jacquemet@univ-paris1.fr
Paris School of Economics
Max Lobeck - max.lobeck@psemail.eu
Paris School of Economics
How Laws Affect the Perception of Norms: Empirical Evidence
from the Lockdown
∗Roberto Galbiati† Emeric Henry‡ Nicolas Jacquemet§ Max Lobeck§ July 2020
Abstract
Laws not only affect behavior due to changes in material payoffs, but they may also change the perception individuals have of societal norms, either by shifting them directly or by providing information on these norms. Using detailed daily survey data and exploiting the introduction of lockdown measures in the UK in the context of the COVID-19 health crisis, we provide causal evidence that the law drastically changed the perception of the norms regarding social distancing behaviors. We show this effect of laws on perceived norms is mostly driven by an informational channel.
JEL Classification: K1, I12, I18.
Keywords: laws, norms, expressive function, misperception, COVID-19.
1
Introduction
Individual behavior is affected both by material incentives, in particular those codified in laws, and by societal sanctions or rewards, embodied in norms of behavior. The interactions between laws and norms is of growing interest both in law and in economics. Benabou and Tirole (2011) propose
∗We warmly thank Fetzer, Witte, Hensel, Jachimowicz, Haushofer, Ivchenko, Caria, Reutskaja, Roth, Fiorin,
G´omez, Kraft-Todd, G¨otz, and Yoeli as well as Hale, Webster, Petherick, Phillips, and Kira for making their data
publicly available, and Chris Roth for very useful feedback at earlier stages of this project.
†Sciences Economiques Sciences Po-CNRS and CEPR. Department of Economics Sciences Po, 28 rue des
Saints-P`eres 75007 Paris, France. roberto.galbiati@sciencepo.fr
‡Sciences Po and CEPR. Department of Economics Sciences Po, 28 rue des Saints-P`eres 75007 Paris, France.
emeric.henry@sciencepo.fr
§Paris School of Economics and University Paris 1 Panth´eon-Sorbonne. Centre d’Economie de la Sorbonne, 106
a theoretical framework that formalizes two types of interactions. First, laws, by changing material payoffs, affect the norm of behavior understood as an equilibrium object. Indeed, if fewer people take the condemned actions, the social stigma attached to these actions increases. Second, laws, when there is an underlying uncertainty on the prevailing norm, provide information on societal values. Both these mechanisms imply a shift in the perceived norm, in the first case because the norm did actually change and in the second through an informational channel. Taking into account such interactions between laws and norms is key to understand why policies designed to foster cooperation fail or succeed (see Bowles, 2008; Bowles and Polania-Reyes, 2012, for recent surveys).
In this paper, we take advantage of the lockdown measures introduced to face the Covid-19 pandemic and of rich survey data, gathered by Fetzer et al. (2020) worldwide, to provide causal evidence that laws affect the perception of norms. We show that the law immediately increased the belief that others think that social distancing measures should be followed. In the second part of the paper, we provide evidence that the informational channel in Benabou and Tirole (2011) appears to have played the largest role and that a direct shift of the norm seems less likely.
We focus on the case of Boris Johnson’s announcement of a nation-wide lockdown in the UK in the evening on March 23 2020. This setting has several key features that we can exploit to test the causal effect of laws on perceptions of the norm, and the possible mechanisms at play. First, the implementation of this law came as a relative surprise. Indeed it represented a sharp change in the UK government’s strategy that has previously signaled strong reserves regarding total lockdowns. Second, the law was far reaching, including several different policies, such as lockdown and store closures, that had been typically more gradually implemented in other countries.
The law had an immediate impact on mobility, reducing for instance trips to parks by 30% within days. We provide evidence that this strong effect on behavior is supported by changes in perceptions of the norm. To that end, we examine how the law affected individual’s beliefs of whether other people believe social-distancing measures are important. We test the causal effect of the lockdown announcement by comparing daily responses of individuals that were interviewed before March 23 2020 in the UK with those that were interviewed after March 23 2020 in the UK. Trends in the perception of the norm is controlled for by looking at the beliefs on the same days for respondents living in a set of control countries. This event study analysis shows that the lockdown announcement significantly increased the likelihood that individuals believe that their compatriots view positively staying at home, closing stores, and not participating in social gatherings. The effect is very sizable, representing for instance a 15 percentage points increase in the belief that other people think that stay at home measures should be followed. We show that these results are robust to various identification strategies.
In the second part of the paper, we distinguish the two mechanisms proposed in Benabou and Tirole (2011) that can explain the shift in the perception of the norm. We study directly the normative beliefs themselves, i.e., the individual response to whether social distancing measures
are important. First, we show that, before the law was passed, there was a large gap between the actual average normative belief and the average perception of the norm, a gap we call misper-ceptions. Second, performing the same event study exercise as on the perceived norm, we show that misperceptions sharply drop after the implementation of the policy. This mostly reflects the fact that the actual normative beliefs did not themselves shift much. Overall, this suggests that the law mostly acted to provide information on the underlying norm, and in particular to correct misperceptions about this norm. There is little evidence that the norm itself immediately shifted, even though this direct effect on the norm operating through equilibrium beliefs, could take longer to operate.
This paper relates to different strands of literature. First, it contributes to a literature in economics studying the interaction between laws and norms. Acemoglu and Jackson (2017) study a context where the effectiveness of laws depends on their coherence with social norms that drive social stigma for illegal behavior.1 In law and economics the interaction between laws and societal values has been the focus of studies analyzing the expressive function of the law. McAdams (2000) is the first study to argue that, when people seek social approval, laws both provide information about prevailing social values and affect ones’ own perceptions about the latter. Some recent papers have studied the effects of legal interventions on preferences and perceived norms in the laboratory — e.g., McAdams and Nadler (2008) in a coordination game setting and Galbiati and Vertova (2008, 2014); Tyran and Feld (2006); Galbiati et al. (2018) in the context of social dilemmas. Using a vignettes experiment, Lane and Nosenzo (2020) study the effect of laws on how people perceive certain behaviors as socially appropriate or not. Their findings show that laws exert an effect on the perception of the social appropriateness of certain behaviors. Their design however does not distinguish the direct impact of laws on normative beliefs from their effect on the perceived norms. In the field, Funk (2007) studies the effect of the removal of voting obligations in Switzerland and shows that, even though obligations to vote were backed only by symbolic fines, their removal drastically reduced turn-out. The study however shows an impact on behavior but does not document whether the effects are driven by preferences, perceived norms, or both. Aksoy et al. (2020) study the relationship between legal same-sex relationship recognition policies and attitudes toward sexual minorities in Europe. They find that legal recognition is associated with a significant improvement in attitudes toward sexual minorities. We see this work, focusing on attitudes instead of perceived norms, as a complement to ours. Our study also contributes to an emerging literature studying change in societal norms and its consequences in economics. Bursztyn et al. (2020) study how long-standing social norms can potentially change with the provision of information. They show that, in Saudi Arabia, individuals misperceive the level of societal support of women working outside home and provide experimental evidence that correcting beliefs about others increases married men’s willingness to help their wives search for
1
Some papers have looked at the effects of laws on social norms in the context of evolutionary preferences adaptation. Notable examples are Huck (1998) and Bohnet et al. (2001).
jobs. Our analysis shows that laws similarly provide information which corrects misperceptions about the prevailing norms.
2
Data
Our data come from a large online survey gathered by Fetzer et al. (2020, henceforth FWH). The survey collects data on individual attitudes and beliefs concerning Covid-19 measures. The survey was launched on March 20 and we use responses up to March 30, resulting in over 99, 000 respondents from up to 58 countries2 The data contains daily information on respondents’ beliefs about four distinct social distancing measures: social gatherings, avoiding handshakes, closing stores and implementing a general curfew. For each of these measures, respondents are asked about their perception of the social norm, specifically whether they believe other individuals in their countries think that these measures should be adopted (see the Online Appendix, Section A, for detailed information about the variables and their definition). We complement this information with external daily country-level data on coronavirus cases and deaths in the respondent’s country provided by the John’s Hopkins University (Dong et al., 2020).
Boris Johnson’s March 23 announcement of a full and immediate lockdown in the UK is our main source of identification.3 The lockdown prohibited citizens to leave their home except for one form of exercise per day, medical visits, shopping basic necessities, and traveling to and from work if work from home is not possible. It also banned gatherings of more than 2 people and ordered non-essential shops to close. Importantly, this decision marked a stark change in the government’s approach to contain the epidemic. Indeed, as late as March 22 the prime minister recommended that individuals stay two meters apart when interacting outdoors, noting that he “want[s] people to be able to go to the parks and open spaces and to enjoy themselves – it is crucial for health and mental and physical wellbeing” (office U.K.-Government, 2020). The government in fact initially suggested that they would aim at achieving heard immunity. The measures also marked a change in policy relative to other countries that did not implement any further restrictions (e.g., Sweden) or that have already implemented such measures on a large scale (e.g., France, see Hale et al., 2020).
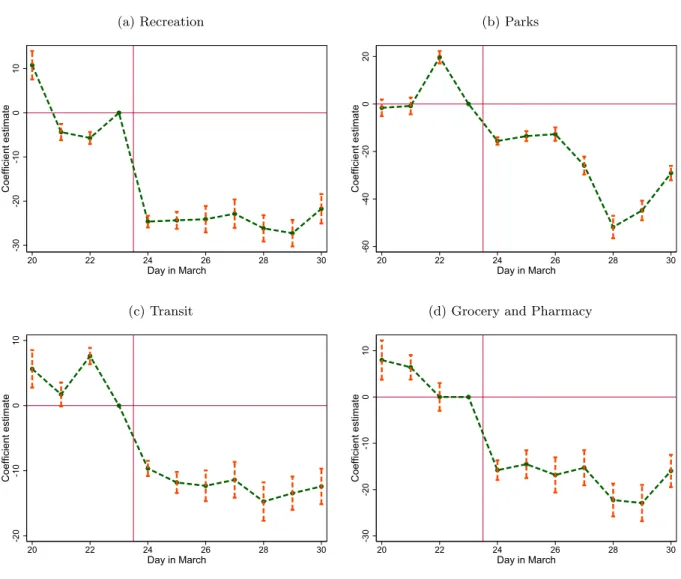
It turned out however that the enforcement was not as stringent as in other countries. Over a period of 3 months following the lockdown, less than 16, 000 fines for violation were issued (compared to more than a million in France), whereas the fine of 60 pounds was lower than in many other countries (135 Euros in France). The police force had been instructed to favor discussion and education over sanctions. Nevertheless the law had a strong impact on the behavior of the population. Using Google mobility data and regressing different measures of mobility, controlling for the state of the pandemic in each country, we show in Figure 1 that all types of movements were
2Responses are not representative but representativity can be reconstructed using country-specific weights. We
include all countries that had more than 200 respondents and completed the survey before March 30.
Figure 1: Mobility patterns in the UK (a) Recreation -30 -20 -10 0 10 Coefficient estimate 20 22 24 26 28 30 Day in March (b) Parks -60 -40 -20 0 20 Coefficient estimate 20 22 24 26 28 30 Day in March (c) Transit -20 -10 0 10 Coefficient estimate 20 22 24 26 28 30 Day in March
(d) Grocery and Pharmacy
-30 -20 -10 0 10 Coefficient estimate 20 22 24 26 28 30 Day in March
Note. These figures plot the day-fixed effects of a specification that regresses a measure of mobility on days as well as Covid deaths and confirmed cases. The outcome variable is mobility data provided by Google. It characterizes in percent how many individuals spend time in (a) recreational areas, (b) parks, (c) transit, and (d) stores and pharmacy relative to a baseline. This baseline is the average number of visit on the same weekday between January 3rd and February 6th. A negative value thus means that there are fewer people at a given place than in the baseline period. The unit of observation is percent and the coefficients have to be interpreted as percentage points.
significantly reduced after March 23rd in the UK, in particular those for recreational purposes.4 For example, the lockdown reduced time spent in parks by 29 percentage points compared to the average time spent in parks on the same weekday between January 3rd and February 6th. Note that this is the pure effect of the lockdown, controlling for behavioral changes before the lockdown. Our aim is to examine whether this large impact of the law on mobility is supported by changes in the perception of the social norm.
To that end, we exploit the lag in the implementation of similar policies in other countries.
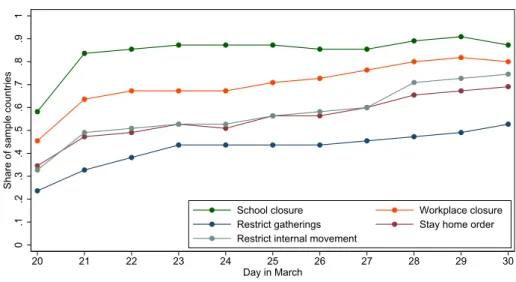
Figure 2: Timeline of policies implementation in the control group 0 .1 .2 .3 .4 .5 .6 .7 .8 .9 1
Share of sample countries
20 21 22 23 24 25 26 27 28 29 30 Day in March
School closure Workplace closure Restrict gatherings Stay home order Restrict internal movement
Note. The figure reports the share of countries in the control group where the corresponding policy was enforced on each day provided on the x-axis.
This policy information comes from the Oxford COVID-19 Government Response Tracker that tracks social distancing policies on the country level by day (Hale et al., 2020). Figure 2 displays the timeline of the implementation of the following policies: school closing, workplace closing, cancellation of public events, stay at home requirements, closure of public transportation, re-strictions on internal movements and rere-strictions on international travel.5 Figure 2 shows that, even though there was gradual adoption of more stringent policies around the world, there is no discontinuity around March 23rd, the date of the UK lockdown. This will be the basis of our estimation strategy, as described below.
3
Results
3.1 The causal effect of the law on perceived norms
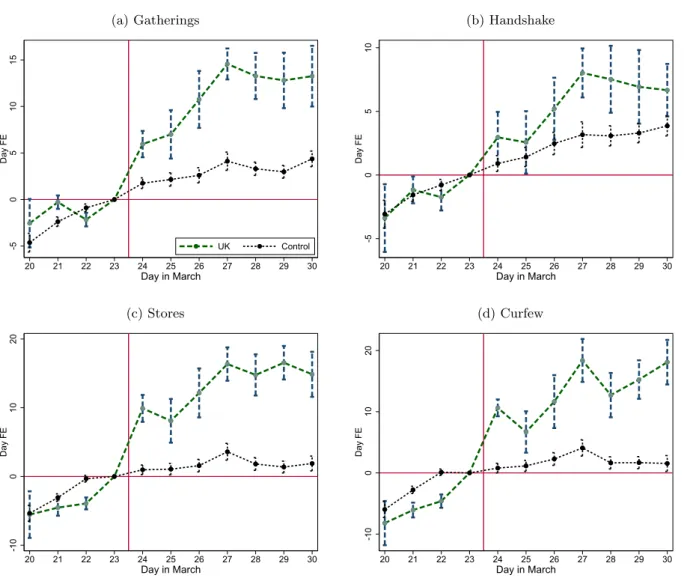
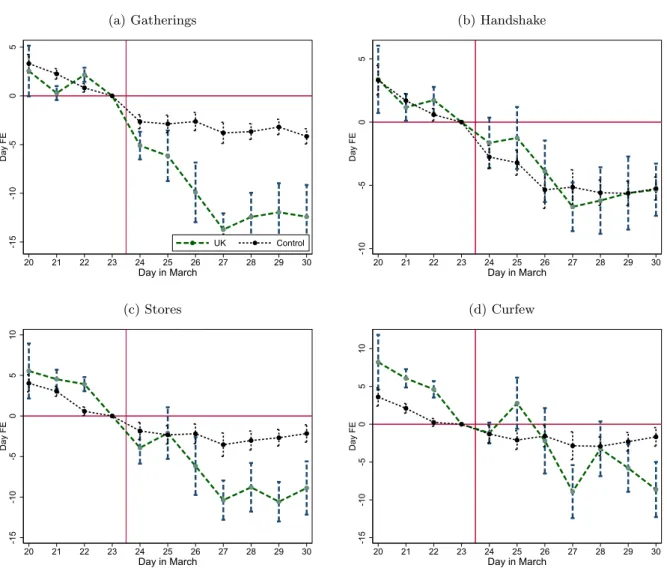
Figure 3 provides descriptive support for our main result. For each of the four policy measures (forbid social gatherings, no handshake, close stores and introduce a curfew), we report the day-fixed effects for the regressions of the perceived norm in the UK and in control group countries. We control for differences in observed heterogeneity by including country, age (measured in bins of 5 years), gender, education, and income-fixed effects, as well as a measure of household composition. For all four social distancing measures the pre-trends are similar prior to the announcement by Boris Johnson. However there is a sharp discontinuity in the trend for the UK after March 23rd.
5
We focus on the ‘containment and closure’ category and restrict only to mandatory policies, disregarding simple recommendations from the governments.
Figure 3: Time pattern of perceived norms in the UK and the control group (a) Gatherings -5 0 5 10 15 Day FE 20 21 22 23 24 25 26 27 28 29 30 Day in March UK Control (b) Handshake -5 0 5 10 Day FE 20 21 22 23 24 25 26 27 28 29 30 Day in March (c) Stores -10 0 10 20 Day FE 20 21 22 23 24 25 26 27 28 29 30 Day in March (d) Curfew -10 0 10 20 Day FE 20 21 22 23 24 25 26 27 28 29 30 Day in March
Note. The figure reports the day-fixed effects along with their 95% confidence intervals from separate regressions in the UK and in the control group of the perceived norm measured in the survey about (a) social gatherings, (b) handshaking, (c) stores closure and (d) a total curfew, controlling for country, age, gender, education, and income-fixed effects, as well as household composition. Standard errors are clustered at the country-age-gender level.
We statistically test for these effects by running difference-in-difference (DiD) regressions on the perceived norm for each of the four policies, measured at the individual level, i, on each day d. We generalize the approach as compared to the usual linear model by introducing day and country fixed-effects (which allow for a non-linear effect of the post-treatment and the treatment-group
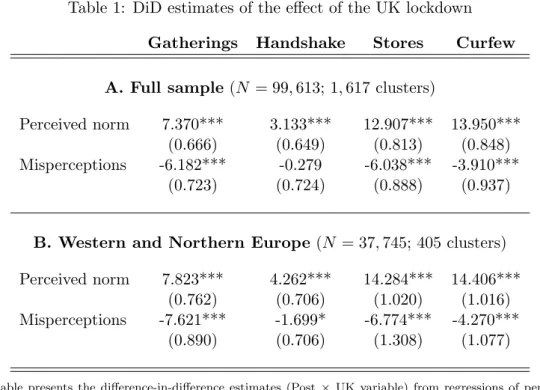
Table 1: DiD estimates of the effect of the UK lockdown
Gatherings Handshake Stores Curfew
A. Full sample (N = 99, 613; 1, 617 clusters)
Perceived norm 7.370*** 3.133*** 12.907*** 13.950***
(0.666) (0.649) (0.813) (0.848)
Misperceptions -6.182*** -0.279 -6.038*** -3.910***
(0.723) (0.724) (0.888) (0.937)
B. Western and Northern Europe (N = 37, 745; 405 clusters) Perceived norm 7.823*** 4.262*** 14.284*** 14.406***
(0.762) (0.706) (1.020) (1.016)
Misperceptions -7.621*** -1.699* -6.774*** -4.270***
(0.890) (0.706) (1.308) (1.077)
Note. This table presents the difference-in-difference estimates (Post × UK variable) from regressions of perceived norms (first row in each panel) and misperceptions (second row) on country-age-gender, country-education, income quintile, and day fixed-effects as well as controls for household composition and COVID-19 statistics (lagged and current confirmed cases and deaths). The sample uses all countries and respondents that answered between March 20 and 30. Standard errors are clustered at the country-age-gender level. Significance levels: ∗5%,∗∗1%,∗∗∗0.1%.
dummy variables) and estimate the following model (bold letters denote column vectors):6
yid= α + βP ostd× U Ki+ Country0iγ + Dayd0φ + x0idκ + uid, ∀i, d (1)
The control variables in the x vector notably include (current and lagged) measures of date variations in Covid deaths and confirmed cases. We also include age-gender, country-education, income quintile, and day fixed-effects as well as a control for the household composition. Last, we account for individual correlation in unobserved heterogeneity both over time within countries and between individuals within countries by clustering the standard errors at country-age-gender level.7
The results of DiD estimates are provided in the first row of Table 1, where we perform the estimation both on the whole set of countries available in the sample (panel A) and on the more homogeneous subset of Western and Northern European countries (panel B; the list is provided in the Online Appendix, Table A). The lockdown announcement has a strong positive effect on
6
The outcome variable, yid, denotes either one of the four perceived norms, or one of the four measures of
misperceptions as defined in Section 3.2.
7
In the main tables we only report the estimates of the β parameters; the full results tables are provided in the Online Appendix, Section C. Also note that we do not control for normative beliefs in our preferred regressions on perceived norms, since they are likely to be endogenous to unobserved heterogeneity generating differences perceived norms. The robustness check available from authors upon request, shows that the results still holds when normative beliefs are controlled for and, if anything, are stronger both statistically and in terms of magnitude.
the perceived norm, for all of the different social distancing measures (note that their unit is the same). The effect is strongest for the implementation of a general curfew and the closure of stores. It is weaker for social gatherings and positive, small, and for the most part insignificant for the no handshake policy. The effect is similar in magnitude if we only compare the UK respondents to respondents from other North-Western countries (panel B).
3.2 Robustness analysis
The main challenge to our identification strategy of the causal effect of the UK announcement on the perception of norms is the risk that our estimates capture the announcement of similar policies in control group countries. To tackle this issue, we run several robustness checks, the results of which are summarized in the Online Appendix, Section D.
Our first set of robustness checks relies on alternative identification strategies. First, as ex-plained in Section 2, our main source of identification is the discontinuity in the government response in the UK on March 23. As an alternative to the difference-in-difference estimates on the whole sample period, we narrow the analysis to the neighborhood of the discontinuity and focus solely on data observed on March 22 and March 24 (see panel A in the Online Appendix, Section D.1). Second, Figure 2 shows that some policy variation does occur in the control group during the sample period — although the trend is very flat around this discontinuity. To wash-out these variations from the estimated effect, we run the difference-in-difference estimation in (1) on the control group made only of countries in which no policy variation happens between March 20 and March 30 (see panel B). Both exercises lead to very similar estimates in terms both of mag-nitude and statistical significance. Third, we exploit changes in the timing of the introduction of lockdowns in all countries over the time period of interest (which is the case of 49 countries out of the 172 represented in our sample), by regressing perceived norms on country fixed effects, day fixed effects and an indicator variable measuring whether a lockdown is in place (we moreover account for the same control variables as in other regressions; see panel C). The results show that the introduction of a lockdown is correlated with a significant and large increase in perceived norms.
Our second set of robustness checks relies on variations in the composition of the control group used to generate the estimates provided in Table 1. We replicate the estimation based on the same control group, but from which we remove each country one at a time (the results are provided in the Online Appendix, Section D.2). All estimated coefficients are statistically indistinguishable from the baseline coefficient (first line in the figure). This shows that our results are not driven by dynamics in one particular country.
3.3 The gap between perceived and actual norm
The results in the previous section clearly show that the law had a strong effect on individual perceptions of the normative beliefs of others. We now examine the mechanism that could lie
Figure 4: Time pattern of misperceptions in the UK and the control group (a) Gatherings -15 -10 -5 0 5 Day FE 20 21 22 23 24 25 26 27 28 29 30 Day in March UK Control (b) Handshake -10 -5 0 5 Day FE 20 21 22 23 24 25 26 27 28 29 30 Day in March (c) Stores -15 -10 -5 0 5 10 Day FE 20 21 22 23 24 25 26 27 28 29 30 Day in March (d) Curfew -15 -10 -5 0 5 10 Day FE 20 21 22 23 24 25 26 27 28 29 30 Day in March
Note. The figure reports the day-fixed effects along with their 95% confidence intervals from separate regressions in the UK and in the control group of the misperception about (a) social gatherings, (b) handshaking, (c) stores closure and (d) a total curfew, controlling for country, age, gender, education, and income-fixed effects, as well as household composition. Standard errors are clustered at the country-age-gender level.
behind this effect. Benabou and Tirole (2011) suggest two main channels: first, the law, by changing material payoffs of the socially desired action, also affects the norm of behavior resulting from equilibrium behavior. In particular, if individuals start adopting the prescribed action because of sanctions imposed by laws, those who still do not take this action will signal their extreme attitudes and carry worse stigma. Here, the law thus directly affects the norm. A second channel is that the law may bring information on the norm, even if the norm remains unchanged. These two explanations notably differ regarding whether the norm actually changes. We build a measure of actual norms thanks to an additional variable in the survey asking respondents about their normative beliefs, i.e. whether they believe each individual policy is important (the variable
is described in the Online Appendix, Section A). If the information about the prevalent norm was perfect, the average over the entire population of these normative beliefs should be equal to the average perception of the norm. We thus build a measure of the actual norm based on the average normative belief and taking into account that our sample is not representative of the entire population. We compute the weighted average of this variable at the country level separately before and after March 23, where the weights rescale the data to make our sample representative of the gender-age-income-household size composition of the population at the country level.
Using this measure, we first show that there was an initial gap between the norm and the perception of the norm in the UK, a gap we call misperceptions. Section E in the Online Appendix presents misperceptions before March 23 in the left panel and after in the right panel. The left panel clearly shows that before the lockdown, misperceptions were very high, in other words, the perceptions of the norm were significantly below the norm itself for most dimensions, except for handshake where the discrepancy was much lower. The right panel shows that after March 23, this misperception sharply drop. This evolution observed in the raw data is confirmed in Figure 4 where we replicate Figure 3 but on the misperception measure. As shown in Table 1 (second row in each subpanel), these results all are statistically significant based on DiD estimates from linear models similar to (1) in which the misperception is used as a dependent variable. This effect on misperceptions, that echoes the effect on the perceived norms, is essentially driven by the fact that normative beliefs themselves do not change (see the Online Appendix, Section F; we also ascertain that the effect is not driven by the use of weights thanks to a replication on weighted data of the DiD estimation of the effect on perceived norms, see Section D.1, panel D). This set of results suggest that the most plausible channel is that the law changed the perceptions of the norm without actually changing the norm itself. In fact, for handshakes, the dimension where misperceptions was initially the lowest, the law had virtually no effect on the perceptions of the norm.8
4
Conclusion
In this paper, we use the announcement of a sudden and drastic lockdown in the UK to provide causal evidence that laws affect the perception of societal norms in the population. We also show that the most plausible mechanism is an informational channel over a direct change in the norms. The UK had several features that favoured this informational channel. First, the population was initially pessimistic about the prevalent norm, as indicated by the large misperception gap before
8
This interpretation is further substantiated by the analysis of the heterogeneity of the response of perceived norms to the UK lockdown. When interacting the treatment effect with subjective perception variables in separate models, the only dimension of heterogeneity that seems to matter is how well individuals are informed about COVID itself, measured as the gap between their estimate of the number of COVID cases and the actual number in their country. The higher that gap, the more the perception of the norm relative to the curfew variable shifts up. These results are provided in the Online Appendix, Section G, along with the results from interactions with individual covariates. Non of these interactions with socio-economic variables are significant, except for gender.
March 23rd, leaving room for new informations to affect beliefs. Second, as described in Section 2, the enforcement of the law was relatively weaker than in other countries, decreasing the potential for a direct impact on a norm change. In this context, our results show the law does provide information, resulting in a large change in what norm the population thinks prevails. Our study thus sheds new light on the mechanisms explaining why and under what circumstances laws are effective and contributes to a better understanding of how perceptions about prevailing norms are formed.
References
Acemoglu, Daron and Matthew O. Jackson. Social Norms and the Enforcement of Laws. Journal of the European Economic Association, 15(2):245–295, 2017.
Aksoy, Cevat G., Christopher S. Carpenter, Ralph De Haas, and Kevin D. Tran. Do laws shape attitudes? Evidence from same-sex relationship recognition policies in Europe. European Economic Review, 124: 103399, 2020.
Benabou, Roland and Jean Tirole. Laws and Norms. NBER WP, 17579, 2011.
Bohnet, Iris, Bruno S. Frey, and Steffen Huck. More Order with Less Law: On Contract Enforcement, Trust, and Crowding. American Political Science Review, 95(1):131–144, 2001.
Bowles, S. Policies Designed for Self-Interested Citizens May Undermine “The Moral Sentiments”: Evidence from Economic Experiments. Science, 320(5883):1605–1609, 2008.
Bowles, Samuel and Sandra Polania-Reyes. Economic Incentives and Social Preferences: Substitutes or Complements? Journal of Economic Literature, 50(2):368–425, 2012.
Bursztyn, Leonardo, Alessandra L. Gonz´alez, and David Yanagizawa-Drott. Misperceived Social Norms: Women Working Outside the Home in Saudi Arabia. American Economic Review, Forthcoming, 2020. Dong, Ensheng, Hongru Du, and Lauren Gardner. An interactive web-based dashboard to track COVID-19
in real time. The Lancet Infectious Diseases, 2020.
Fetzer, Thiemo, Marc Witte, Lukas Hensel, Jon Jachimowicz, Johannes Haushofer, Andriy Ivchenko, Stefano Caria, Elena Reutskaja, Christopher Roth, Stefano Fiorin, Margarita G´omez, Gordon Kraft-Todd, Friedrich Martin G¨otz, and Erez Yoeli. Perceptions of an Insufficient Government Re-sponse at the Onset of the COVID-19 Pandemic are Associated with Lower Mental Well-Being. https://doi.org/10.31234/osf.io/3kfmh, 2020.
Funk, Patricia. Is There An Expressive Function of Law? An Empirical Analysis of Voting Laws with Symbolic Fines. American Law and Economics Review, 9(1):135–159, 2007.
Galbiati, Roberto and Pietro Vertova. Obligations and cooperative behaviour in public good games. Games and Economic Behavior, 64(1):146–170, 2008.
Galbiati, Roberto and Pietro Vertova. How laws affect behavior: Obligations, incentives and cooperative behavior. International Review of Law and Economics, 38:48–57, 2014.
Galbiati, Roberto, Emeric Henry, and Nicolas Jacquemet. Dynamic effects of enforcement on cooperation. Proceedings of the National Academy of Sciences, 115(49):12425–12428, 2018.
Hale, Thomas, Samuel Webster, Anna Petherick, Toby Phillips, and Beatriz Kira. Oxford covid-19 gov-ernment response tracker. Blavatnik School of Govgov-ernment, 25, 2020.
Huck, Steffen. Trust, Treason, and Trials: An Example of How the Evolution of Preferences Can Be Driven by Legal Institutions. Journal of Law, Economics, and Organization, 14(1):44–60, 1998.
Lane, Tom and Daniele Nosenzo. Law and norms: Empirical evidence. LISER Working Paper Series, 20-03, 2020.
McAdams, Richard H. An attitudinal theory of expressive law. Oregon Law Review, 79:339, 2000. McAdams, Richard H. and Janice Nadler. Coordinating in the Shadow of the Law: Two Contextualized
Tests of the Focal Point Theory of Legal Compliance. Law & Society Review, 42(4):865–898, 2008. U.K.-Government, Prime˜ministeroffice . Prime Minister’s statement on coronavirus (COVID-19): 22
March 2020. https://www.gov.uk/government/speeches/pm-statement-on-coronavirus-22-march-2020, 2020.
Tyran, Jean-Robert and Lars P Feld. Achieving compliance when legal sanctions are non-deterrent. Scan-dinavian Journal of Economics, 108(1):135–156, 2006.
Online Appendix
A
Sample information
A.1 Variables and data source
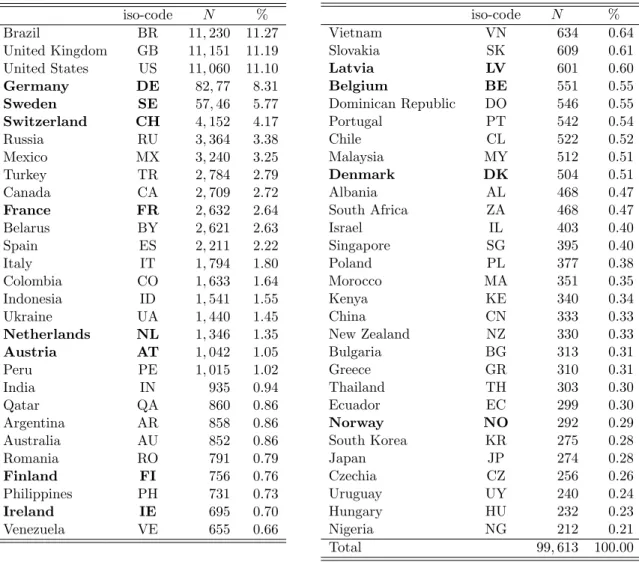
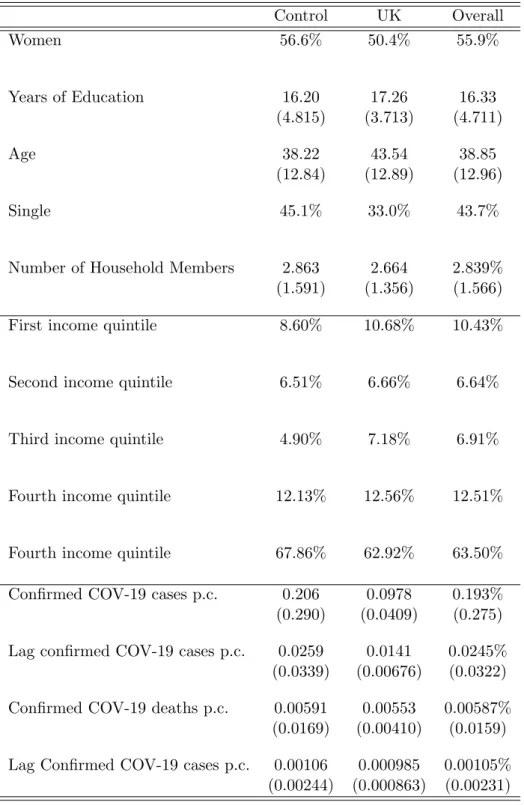
The entire set of variables available in the data is described in FWH. We only describe below the variables used as the main outcomes in the analysis. Table A reports the distribution of answers across countries, and Table B provides a comparison of the descriptive statistics observed in the UK and in other countries.
Perceived norms. Our measure of perceived norms come from questions about the perception of others’ beliefs about Coronavirus measures:
• sob social: How many of 100 people in your country do you think believe that participation at social gatherings should be cancelled because of the coronavirus right now? [slider ranging from 0 to 100 — initiated at 0]
• sob handshake: How many of 100 people in your country do you think believe that one should not shake other people’s hands because of the coronavirus right now? [slider ranging from 0 to 100 — initiated at 0]
• sob stores: How many of 100 people in your country do you think believe that all shops in your country other than particularly important ones, such as supermarkets, pharmacies, post offices, and gas stations, should be closed because of the coronavirus right now? [slider ranging from 0 to 100 — initiated at 0]
• sob curfew: How many of 100 people in your country do you think believe there should be a general curfew in your country (with the exception of grocery shopping, necessary family trips, and the commute to work) because of the coronavirus right now? [slider ranging from 0 to 100 — initiated at 0]
Misperception. In order to build a measure of misperception, we rely on questions about normative beliefs:
• fob social: “What do you think: should people in your country cancel their participation at social gatherings because of the coronavirus right now? ” [No = 0; Yes = 1]
• fob handshake: “What do you think: should people in your country not shake other people’s hands because of the coronavirus right now?” [No = 0; Yes = 1]
• fob stores: “What do you think: should all shops in your country other than particularly important ones, such as supermarkets, pharmacies, post offices, and gas stations, be closed because of the coronavirus right now?” [No = 0; Yes = 1]
• fob curfew: “What do you think: should there be a general curfew in your country (with the exception of grocery shopping, necessary family trips, and the commute to work) because of the coronavirus right now?” [No = 0; Yes = 1]
For each policy, we compute the weighted average of this variable at the country level, separately before and after March 23. The weights aim at restoring the national representativity of the sample regarding observed heterogeneity available in the data.
Weights. The dataset also contains information about the distribution of the population in each country over age, gender, education, income and household composition (assuming independence in the population between these characteristics). We use this additional source of information to build weights rescaling the observations available in the sample to make them representative of the country population.
Table A: Distribution of responses across countries iso-code N % Brazil BR 11, 230 11.27 United Kingdom GB 11, 151 11.19 United States US 11, 060 11.10 Germany DE 82, 77 8.31 Sweden SE 57, 46 5.77 Switzerland CH 4, 152 4.17 Russia RU 3, 364 3.38 Mexico MX 3, 240 3.25 Turkey TR 2, 784 2.79 Canada CA 2, 709 2.72 France FR 2, 632 2.64 Belarus BY 2, 621 2.63 Spain ES 2, 211 2.22 Italy IT 1, 794 1.80 Colombia CO 1, 633 1.64 Indonesia ID 1, 541 1.55 Ukraine UA 1, 440 1.45 Netherlands NL 1, 346 1.35 Austria AT 1, 042 1.05 Peru PE 1, 015 1.02 India IN 935 0.94 Qatar QA 860 0.86 Argentina AR 858 0.86 Australia AU 852 0.86 Romania RO 791 0.79 Finland FI 756 0.76 Philippines PH 731 0.73 Ireland IE 695 0.70 Venezuela VE 655 0.66 iso-code N % Vietnam VN 634 0.64 Slovakia SK 609 0.61 Latvia LV 601 0.60 Belgium BE 551 0.55 Dominican Republic DO 546 0.55 Portugal PT 542 0.54 Chile CL 522 0.52 Malaysia MY 512 0.51 Denmark DK 504 0.51 Albania AL 468 0.47 South Africa ZA 468 0.47 Israel IL 403 0.40 Singapore SG 395 0.40 Poland PL 377 0.38 Morocco MA 351 0.35 Kenya KE 340 0.34 China CN 333 0.33 New Zealand NZ 330 0.33 Bulgaria BG 313 0.31 Greece GR 310 0.31 Thailand TH 303 0.30 Ecuador EC 299 0.30 Norway NO 292 0.29 South Korea KR 275 0.28 Japan JP 274 0.28 Czechia CZ 256 0.26 Uruguay UY 240 0.24 Hungary HU 232 0.23 Nigeria NG 212 0.21 Total 99, 613 100.00
Table B: Respondents’ covariates Control UK Overall Women 56.6% 50.4% 55.9% Years of Education 16.20 17.26 16.33 (4.815) (3.713) (4.711) Age 38.22 43.54 38.85 (12.84) (12.89) (12.96) Single 45.1% 33.0% 43.7%
Number of Household Members 2.863 2.664 2.839%
(1.591) (1.356) (1.566)
First income quintile 8.60% 10.68% 10.43%
Second income quintile 6.51% 6.66% 6.64%
Third income quintile 4.90% 7.18% 6.91%
Fourth income quintile 12.13% 12.56% 12.51%
Fourth income quintile 67.86% 62.92% 63.50%
Confirmed COV-19 cases p.c. 0.206 0.0978 0.193%
(0.290) (0.0409) (0.275) Lag confirmed COV-19 cases p.c. 0.0259 0.0141 0.0245%
(0.0339) (0.00676) (0.0322) Confirmed COV-19 deaths p.c. 0.00591 0.00553 0.00587%
(0.0169) (0.00410) (0.0159) Lag Confirmed COV-19 cases p.c. 0.00106 0.000985 0.00105%
A.2 Verbatim of Boris Johnson’s March 23 announcement
According to UK government official communication, the speech reads as follows (https://www.gov. uk/government/speeches/pm-address-to-the-nation-on-coronavirus-23-march-2020, text empha-sized by us):
Good Evening,
The coronavirus is the biggest threat this country has faced for decades – and this country is not alone. All over the world we are seeing the devastating impact of this invisible killer.
And so tonight I want to update you on the latest steps we are taking to fight the disease and what you can do to help.
And I want to begin by reminding you why the UK has been taking the approach that we have.
Without a huge national effort to halt the growth of this virus, there will come a moment when no health service in the world could possibly cope; because there won’t be enough ventilators, enough intensive care beds, enough doctors and nurses.
And as we have seen elsewhere, in other countries that also have fantastic health care systems, that is the moment of real danger.
To put it simply, if too many people become seriously unwell at one time, the NHS will be unable to handle it - meaning more people are likely to die, not just from Coronavirus but from other illnesses as well.
So it’s vital to slow the spread of the disease.
Because that is the way we reduce the number of people needing hospital treatment at any one time, so we can protect the NHS’s ability to cope - and save more lives.
And that’s why we have been asking people to stay at home during this pandemic.
And though huge numbers are complying - and I thank you all - the time has now come for us all to do more.
From this evening I must give the British people a very simple instruction - you must stay at home.
Because the critical thing we must do is stop the disease spreading between households.
That is why people will only be allowed to leave their home for the following very limited purposes:
• shopping for basic necessities, as infrequently as possible
• one form of exercise a day - for example a run, walk, or cycle - alone or with members of your household;
• any medical need, to provide care or to help a vulnerable person; and travelling to and from work, but only where this is absolutely necessary and cannot be done from home. That’s all - these are the only reasons you should leave your home.
You should not be meeting friends. If your friends ask you to meet, you should say No. You should not be meeting family members who do not live in your home.
You should not be going shopping except for essentials like food and medicine - and you should do this as little as you can. And use food delivery services where you can.
If you don’t follow the rules the police will have the powers to enforce them, including through fines and dispersing gatherings.
To ensure compliance with the Government’s instruction to stay at home, we will imme-diately:
• close all shops selling non-essential goods, including clothing and electronic stores and other premises including libraries, playgrounds and outdoor gyms, and places of wor-ship;
• we will stop all gatherings of more than two people in public – excluding people you live with;
• and we’ll stop all social events, including weddings, baptisms and other ceremonies, but excluding funerals.
Parks will remain open for exercise but gatherings will be dispersed. No Prime Minister wants to enact measures like this.
I know the damage that this disruption is doing and will do to people’s lives, to their businesses and to their jobs.
And that’s why we have produced a huge and unprecedented programme of support both for workers and for business.
And I can assure you that we will keep these restrictions under constant review. We will look again in three weeks, and relax them if the evidence shows we are able to.
But at present there are just no easy options. The way ahead is hard, and it is still true that many lives will sadly be lost.
And yet it is also true that there is a clear way through.
Day by day we are strengthening our amazing NHS with 7500 former clinicians now coming back to the service.
With the time you buy - by simply staying at home - we are increasing our stocks of equipment. We are accelerating our search for treatments.
We are pioneering work on a vaccine.
And we are buying millions of testing kits that will enable us to turn the tide on this invisible killer. I want to thank everyone who is working flat out to beat the virus.
Everyone from the supermarket staff to the transport workers to the carers to the nurses and doctors on the frontline.
But in this fight we can be in no doubt that each and every one of us is directly enlisted. Each and every one of us is now obliged to join together.
To halt the spread of this disease.
To protect our NHS and to save many many thousands of lives. And I know that as they have in the past so many times. The people of this country will rise to that challenge. And we will come through it stronger than ever.
We will beat the coronavirus and we will beat it together.
And therefore I urge you at this moment of national emergency to stay at home, protect our NHS and save lives.
B
Effect of March 23 lockdown measures on movements in the
UK
The Table below reports the results of the Difference-in-Difference estimation (Post × UK variable) of the March 23 lockdown decision in the UK on mobility data collected from Google’s community mobility reports. Each outcome variable is the change in spending time at a given place relative to the median value of the same weekday in the January 3-February 6 period. The specification controls for COVID-19 statistics (lagged and current confirmed cases and deaths) as well as a non-linear effect of the group and Post variable through day- and country fixed-effects.
Retail Pharmacy Parks Transit
/recreation /Grocery
A. Full sample (N = 960; 124 Clusters)
Post × UK -25.642*** -21.746*** -29.655*** -16.521***
(1.024) (1.167) (2.007) (0.987)
Lag confirmed COV-19 cases p.c. 14.350 49.672 3.192 16.562*
(10.109) (31.207) (25.382) (8.224) Lag confirmed COV-19 deaths p.c. 114.559 -39.607 -1378.007 -85.451 (221.077) (331.812) (827.303) (175.091)
Confirmed COV-19 cases p.c. 9.915* 8.681* 5.391 9.175*
(3.825) (3.393) (3.855) (4.151)
Confirmed COV-19 deaths p.c. 32.310 -24.885 61.112 36.770
(49.066) (46.384) (58.136) (45.195) B. Western and Northern Europe (N = 167; 16 Clusters)
Post × UK -30.497*** -26.002*** -29.849*** -20.610***
(1.379) (1.470) (3.774) (1.064)
Lag confirmed COV-19 cases p.c. 4.168 24.933 -49.647 2.981
(6.110) (34.540) (28.724) (5.409)
Lag confirmed COV-19 deaths p.c. -703.338 -594.192 -3024.148 -627.219 (521.176) (457.703) (1572.284) (332.433)
Confirmed COV-19 cases p.c. 2.174 2.860 7.658* 1.882
(1.618) (2.114) (3.262) (1.693)
Confirmed COV-19 deaths p.c. 176.052 -60.292 234.398 75.669
(115.063) (98.899) (324.278) (91.025)
C
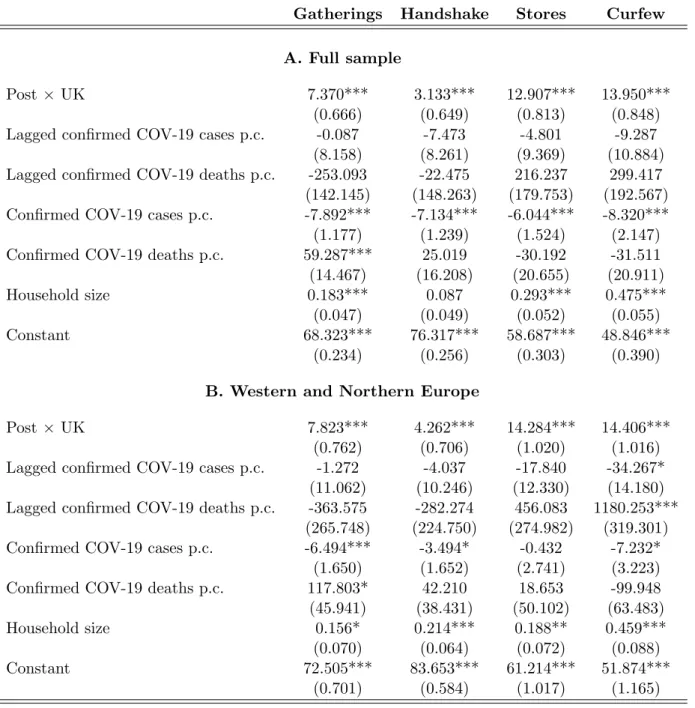
Full results from Table 1
Table C: DiD estimates of the effect of the UK lockdown on Perceived norms
Gatherings Handshake Stores Curfew
A. Full sample
Post × UK 7.370*** 3.133*** 12.907*** 13.950***
(0.666) (0.649) (0.813) (0.848)
Lagged confirmed COV-19 cases p.c. -0.087 -7.473 -4.801 -9.287
(8.158) (8.261) (9.369) (10.884)
Lagged confirmed COV-19 deaths p.c. -253.093 -22.475 216.237 299.417 (142.145) (148.263) (179.753) (192.567) Confirmed COV-19 cases p.c. -7.892*** -7.134*** -6.044*** -8.320***
(1.177) (1.239) (1.524) (2.147)
Confirmed COV-19 deaths p.c. 59.287*** 25.019 -30.192 -31.511
(14.467) (16.208) (20.655) (20.911)
Household size 0.183*** 0.087 0.293*** 0.475***
(0.047) (0.049) (0.052) (0.055)
Constant 68.323*** 76.317*** 58.687*** 48.846***
(0.234) (0.256) (0.303) (0.390)
B. Western and Northern Europe
Post × UK 7.823*** 4.262*** 14.284*** 14.406***
(0.762) (0.706) (1.020) (1.016)
Lagged confirmed COV-19 cases p.c. -1.272 -4.037 -17.840 -34.267* (11.062) (10.246) (12.330) (14.180) Lagged confirmed COV-19 deaths p.c. -363.575 -282.274 456.083 1180.253***
(265.748) (224.750) (274.982) (319.301)
Confirmed COV-19 cases p.c. -6.494*** -3.494* -0.432 -7.232*
(1.650) (1.652) (2.741) (3.223)
Confirmed COV-19 deaths p.c. 117.803* 42.210 18.653 -99.948
(45.941) (38.431) (50.102) (63.483)
Household size 0.156* 0.214*** 0.188** 0.459***
(0.070) (0.064) (0.072) (0.088)
Constant 72.505*** 83.653*** 61.214*** 51.874***
(0.701) (0.584) (1.017) (1.165)
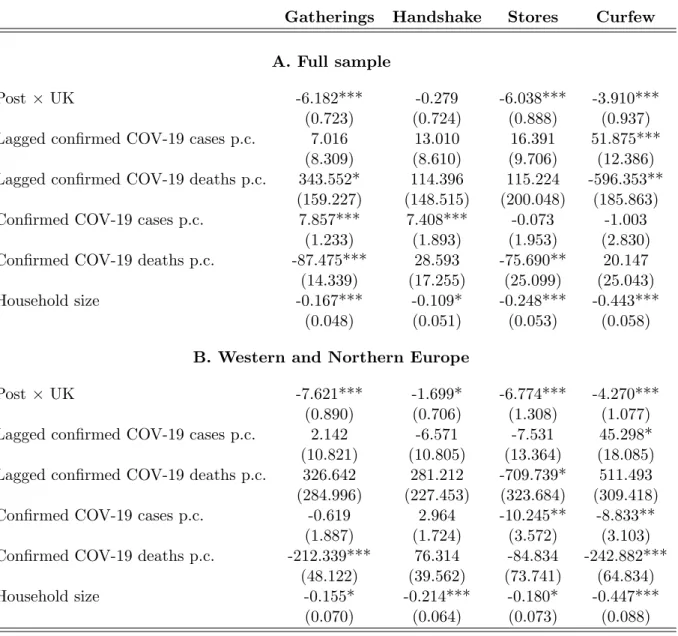
Table D: DiD estimates of the effect of the UK lockdown on Misperceptions
Gatherings Handshake Stores Curfew
A. Full sample
Post × UK -6.182*** -0.279 -6.038*** -3.910***
(0.723) (0.724) (0.888) (0.937)
Lagged confirmed COV-19 cases p.c. 7.016 13.010 16.391 51.875***
(8.309) (8.610) (9.706) (12.386)
Lagged confirmed COV-19 deaths p.c. 343.552* 114.396 115.224 -596.353** (159.227) (148.515) (200.048) (185.863)
Confirmed COV-19 cases p.c. 7.857*** 7.408*** -0.073 -1.003
(1.233) (1.893) (1.953) (2.830)
Confirmed COV-19 deaths p.c. -87.475*** 28.593 -75.690** 20.147 (14.339) (17.255) (25.099) (25.043)
Household size -0.167*** -0.109* -0.248*** -0.443***
(0.048) (0.051) (0.053) (0.058)
B. Western and Northern Europe
Post × UK -7.621*** -1.699* -6.774*** -4.270***
(0.890) (0.706) (1.308) (1.077)
Lagged confirmed COV-19 cases p.c. 2.142 -6.571 -7.531 45.298*
(10.821) (10.805) (13.364) (18.085) Lagged confirmed COV-19 deaths p.c. 326.642 281.212 -709.739* 511.493 (284.996) (227.453) (323.684) (309.418)
Confirmed COV-19 cases p.c. -0.619 2.964 -10.245** -8.833**
(1.887) (1.724) (3.572) (3.103)
Confirmed COV-19 deaths p.c. -212.339*** 76.314 -84.834 -242.882*** (48.122) (39.562) (73.741) (64.834)
Household size -0.155* -0.214*** -0.180* -0.447***
(0.070) (0.064) (0.073) (0.088)
D
Results from the robustness analysis
D.1 Regression resultsThe Table below reports the Difference-in-Difference estimates from the robustness analysis described in Section 3.2. The full results are available from the authors upon request.
Gatherings Handshake Stores Curfew N Clusters A. March 22 vs March 24
Full sample 5.422*** 2.826** 11.969*** 12.447*** 49, 272 1,367 (0.921) (1.046) (1.404) (1.163)
Western and Northern Europe 4.789*** 2.800** 11.279*** 11.590*** 20, 029 362 (0.949) (1.057) (1.538) (1.283)
B. Countries with no change in their lockdown policy
Full sample 8.147*** 3.913*** 14.387*** 14.722*** 20, 533 1,211 (0.718) (0.699) (0.887) (0.897)
Western and Northern Europe 8.382*** 4.475*** 14.946*** 14.885*** 7, 588 315 (0.724) (0.679) (0.949) (0.933)
C. Effect of a strict lockdown on pooled data
Full sample 2.721*** 0.855* 5.558*** 7.193*** 99, 613 1, 617 (0.370) (0.418) (0.517) (0.540)
Western and Northern Europe 3.303*** 2.058*** 7.394*** 8.146*** 37, 745 405 (0.425) (0.475) (0.600) (0.616)
D. Weighted data
Full sample 7.086*** 3.381* 13.345*** 16.729*** 99, 613 1, 617 (1.706) (1.717) (1.806) (2.270)
Western and Northern Europe 7.491*** 3.097 15.526*** 18.146*** 37, 745 405 (1.731) (1.766) (1.897) (2.486)
D.2 Step deletion of countries from the control group
The figure below reports the point estimates along with 95% confidence intervals resulting from the difference-in-difference estimation in (1) performed on control groups resulting from the step deletion of each country one after the other. The countries iso-code are defined in Table A.
(a) Gatherings None AL AR AT AU BE BG BR BY CA CH CL CN CO CZ DE DK DO EC ES FI FR GR HU ID IE IL IN IT JP KE KR LV MA MX MY NG NL NO NZ PE PH PL PT QA RO RU SE SG SK TH TR UA US UY VE VN ZA Excluding country 0 2 4 6 8 10 12 14 16 18 20 22 Diff-in-Diff Estimate (b) Handshake None AL AR AT AU BE BG BR BY CA CH CL CN CO CZ DE DK DO EC ES FI FR GR HU ID IE IL IN IT JP KE KR LV MA MX MY NG NL NO NZ PE PH PL PT QA RO RU SE SG SK TH TR UA US UY VE VN ZA Excluding country 0 2 4 6 8 10 12 14 16 18 20 22 Diff-in-Diff Estimate (c) Closure None AL AR AT AU BE BG BR BY CA CH CL CN CO CZ DE DK DO EC ES FI FR GR HU ID IE IL IN IT JP KE KR LV MA MX MY NG NL NO NZ PE PH PL PT QA RO RU SE SG SK TH TR UA US UY VE VN ZA Excluding country 0 2 4 6 8 10 12 14 16 18 20 22 Diff-in-Diff Estimate (d) Curfew None AL AR AT AU BE BG BR BY CA CH CL CN CO CZ DE DK DO EC ES FI FR GR HU ID IE IL IN IT JP KE KR LV MA MX MY NG NL NO NZ PE PH PL PT QA RO RU SE SG SK TH TR UA US UY VE VN ZA Excluding country 0 2 4 6 8 10 12 14 16 18 20 22 Diff-in-Diff Estimate
E
Before-After comparison of misperceptions in the UK
The figure below displays the discrepancy between the norm and the individual perception of the norm in the UK before and after March 23. The horizontal line in the middle of the box characterizes the median. The upper (lower) ends of the box characterizes the 75th (25th) percentile. The upper (lower) ends of the vertical lines are the upper (lower) adjacent values. Points above (below) are outliers.
(a) Before -50 -25 0 25 50 75 100
Social gatherings Shaking hands Closing stores Curfew
(b) After -50 -25 0 25 50 75 100
F
Time-pattern of normative beliefs in the UK and the control
group
For each of the four policy measures, the figure below reports the day-fixed effects from individual normative beliefs in the UK and in control group countries, controlling for country-, age-, gender-, education-, and income-fixed effects, as as well as a measure of household composition. The results from difference-in-difference estimates of the effect of March 23 announcement on individual normative beliefs, available from the authors upon request, confirms that the announcement has a non-significant effect regarding both handshaking and social gatherings, and a small but statistically significant effect regarding stores closure and a total curfew.
(a) Social gatherings
-.03 -.02 -.01 0 .01 .02 Day FE 20 21 22 23 24 25 26 27 28 29 30 Day in March UK Control (b) Handshake -.06 -.04 -.02 0 .02 .04 Day FE 20 21 22 23 24 25 26 27 28 29 30 Day in March (c) Stores closure -.1 -.05 0 .05 .1 Day FE 20 21 22 23 24 25 26 27 28 29 30 Day in March (d) Total curfew -.2 -.1 0 .1 .2 Day FE 20 21 22 23 24 25 26 27 28 29 30 Day in March
G
Heterogeneity in the UK response to the lockdown
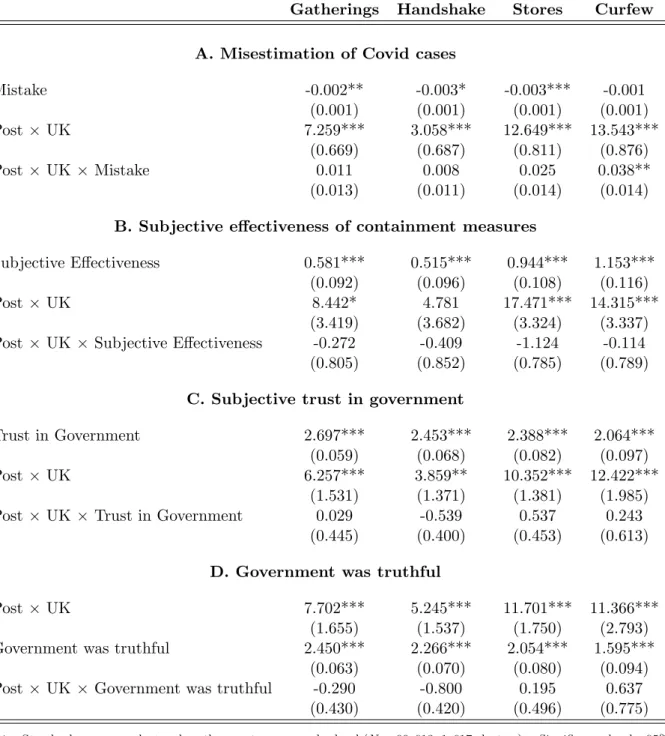
The Tables below provide the results from separate regressions in which we allow the DiD estimate in (1) to interact with observed individual covariates (Table E) and subjective variables (Table F). For each set of regressions, we report the coefficient of the corresponding variable, the resulting DiD estimate (Post × UK variable) as well as the interaction. The subjective variables come from the “Perceptions of government/public response and efficacy” part of the survey, and are measured as:
• perceivedeffectivnes: What do you think: How effective are social distancing measures (e.g., through a general curfew) to slow down the spread of the coronavirus? [5- point scale; 1 = Not at all effective; 2 = Not effective; 3 = Neither effective nor ineffective; 4 = Effective; 5 = Very effective]
• govtrust: How much do you trust your country’s government to take care of its citizens? [5-point scale; 1 = Strongly distrust; 2 = Somewhat distrust; 3 = Neither trust nor distrust; 4 = Somewhat trust; 5 = Strongly trust]
• govfact: How factually truthful do you think your country’s government has been about the coron-avirus outbreak? [5-point scale; 1 = Very untruthful; 2 = Somewhat untruthful; 3 = Neither truthful nor untruthful; 4 = Somewhat truthful; 5 = Very truthful]
For each variable, we generate dummy variables equal to 1 if the individual’s response is above the midpoint of the Likert scale, and 0 if it is below.
Table E: Heterogeneity of the DiD estimate according to individual covariates
Gatherings Handshake Stores Curfew
A: Gender (the direct effect is part of the model FE)
Post × UK 13.229*** 7.962*** 17.567*** 18.122***
(1.811) (1.735) (1.513) (2.273)
Post × UK × Female -3.600*** -2.967** -2.863** -2.563*
(1.025) (0.961) (1.042) (1.292)
B. Income bracket (the direct effect is part of the model FE)
Post × UK 6.142*** 3.193* 10.268*** 13.022***
(1.362) (1.480) (1.522) (2.224)
Post × UK × Income bracket 0.295 -0.014 0.633 0.223
(0.340) (0.312) (0.379) (0.525)
C. Years of education (the direct effect is part of the model FE)
Post × UK 9.301*** 4.999* 15.891*** 13.023***
(2.022) (2.400) (2.246) (3.173)
Post × UK × Education bin -0.111 -0.107 -0.172 0.053
(0.100) (0.126) (0.114) (0.164) D. Household size Household size 0.178*** 0.086 0.291*** 0.466*** (0.047) (0.050) (0.052) (0.056) Post × UK 6.498*** 2.854* 12.579*** 12.379*** (1.129) (1.254) (1.260) (1.581)
Post × UK × Household size 0.331 0.106 0.125 0.597
(0.320) (0.362) (0.372) (0.505)
Note. Standard errors are clustered on the country-age-gender level (N = 99, 613; 1, 617 clusters). Significance levels:∗5%,
Table F: Heterogeneity of the DiD estimate according to subjective perception variables
Gatherings Handshake Stores Curfew
A. Misestimation of Covid cases
Mistake -0.002** -0.003* -0.003*** -0.001 (0.001) (0.001) (0.001) (0.001) Post × UK 7.259*** 3.058*** 12.649*** 13.543*** (0.669) (0.687) (0.811) (0.876) Post × UK × Mistake 0.011 0.008 0.025 0.038** (0.013) (0.011) (0.014) (0.014)
B. Subjective effectiveness of containment measures
Subjective Effectiveness 0.581*** 0.515*** 0.944*** 1.153***
(0.092) (0.096) (0.108) (0.116)
Post × UK 8.442* 4.781 17.471*** 14.315***
(3.419) (3.682) (3.324) (3.337)
Post × UK × Subjective Effectiveness -0.272 -0.409 -1.124 -0.114
(0.805) (0.852) (0.785) (0.789)
C. Subjective trust in government
Trust in Government 2.697*** 2.453*** 2.388*** 2.064***
(0.059) (0.068) (0.082) (0.097)
Post × UK 6.257*** 3.859** 10.352*** 12.422***
(1.531) (1.371) (1.381) (1.985)
Post × UK × Trust in Government 0.029 -0.539 0.537 0.243
(0.445) (0.400) (0.453) (0.613)
D. Government was truthful
Post × UK 7.702*** 5.245*** 11.701*** 11.366***
(1.655) (1.537) (1.750) (2.793)
Government was truthful 2.450*** 2.266*** 2.054*** 1.595***
(0.063) (0.070) (0.080) (0.094)
Post × UK × Government was truthful -0.290 -0.800 0.195 0.637
(0.430) (0.420) (0.496) (0.775)
Note. Standard errors are clustered on the country-age-gender level (N = 99, 613; 1, 617 clusters). Significance levels:∗5%, ∗∗1%,∗∗∗0.1%.
Supplementary material (for referring purpose only)
H
Country variations in the containment stringency index
The stringency index is computed by Hale et al. (2020) as the sum of the policy indicators, adding an extra half-point if the policy is general rather than targeted, if applicable. The value is then rescaled by its maximum value to create a score between 0 and 100, with a missing value contributing 0.3. The figure below reports the change in the mean index from before to after March 24. The further to the right a country is, the larger was the change in the stringency index.
AL AR AT AU BE BGBR CACH CL CN CO CZ DE DK ECES FI FR GB GR HU ID IE IL IN IT JP KE KRMA MX MY NG NL NO NZ PE PH PT QA RO RU SESG SK TH TR UAUS UY VE VN ZA Country 0 20 40 60 Stringency Index
The vast majority of countries had very little change in that period. 85% of countries have a change in their stringency index that is not even half of the UK’s and 75% have a change in their stringency index that is a quarter of UK’s change. The change is very small in countries with large sample sizes in the survey, as the US (0.9925003), Germany (5.852), Sweden (0.831428), Brazil (2.578571), Switzerland (0), or Belgium (0). One notable exception is Mexico. Mexico closed schools on March 22, canceled public events, and put restrictions on gatherings. However, work from home requirements was enforced on March 26 and confinement was put into place a week later, on March 30.
I
Replication of Table 1 controlling for individual normative
be-liefs
Gatherings Handshake Stores Curfew
A. Full sample (N = 99, 613; 1, 617 clusters)
Post × UK 7.399*** 3.122*** 12.338*** 12.795***
(0.671) (0.663) (0.755) (0.829)
Lagged confirmed COV-19 cases p.c. 0.356 -7.424 -3.227 -5.922
(8.216) (8.175) (9.165) (10.320)
Lagged confirmed COV-19 deaths p.c. -266.647 -35.207 178.640 265.042
(143.899) (148.032) (179.054) (177.882)
Confirmed COV-19 cases p.c. -7.605*** -6.482*** -5.296*** -9.359***
(1.172) (1.239) (1.454) (1.859)
Confirmed COV-19 deaths p.c. 55.910*** 19.709 -33.913 -9.016
(14.358) (15.991) (19.694) (19.562)
Household size 0.185*** 0.091 0.296*** 0.433***
(0.047) (0.049) (0.050) (0.052)
Normative belief about Gathering 8.018***
(0.641)
Normative belief about Handshake 7.275***
(0.510)
Normative belief about Stores 9.741***
(0.303)
Normative belief about Curfew 12.550***
(0.295) B. Western and Northern Europe (N = 37, 745; 405 clusters)
Post × UK 7.972*** 4.232*** 13.536*** 13.497***
(0.775) (0.719) (0.972) (0.998)
Lagged confirmed COV-19 cases p.c. 0.516 -4.329 -13.502 -28.392*
(11.151) (10.103) (12.068) (13.461)
Lagged confirmed COV-19 deaths p.c. -364.036 -264.270 317.679 840.815**
(265.174) (223.381) (275.930) (297.682)
Confirmed COV-19 cases p.c. -5.556*** -2.932 -0.548 -7.080*
(1.581) (1.663) (2.670) (2.882)
Confirmed COV-19 deaths p.c. 109.038* 28.219 19.311 -40.415
(45.457) (38.502) (50.437) (57.746)
Household size 0.161* 0.213*** 0.208** 0.446***
(0.068) (0.063) (0.073) (0.081)
Normative belief about Gathering 9.459***
(0.826)
Normative belief about Handshake 6.934***
(0.636)
Normative belief about Stores 10.516***
(0.516)
Normative belief about Curfew 11.852***
(0.431)
J
Full results tables from robustness regressions
Table G: DiD estimates in the neighborhood of the discontinuity (data from March 22 and 24)
Gatherings Handshake Stores Curfew
A. Full sample (N = 49, 272; 1, 367 clusters)
Post × UK 5.422*** 2.826** 11.969*** 12.447***
(0.921) (1.046) (1.404) (1.163)
Lagged confirmed COV-19 cases p.c. 76.149 32.384 10.368 55.475
(53.745) (53.254) (61.976) (84.255) Lagged confirmed COV-19 deaths p.c. -709.442 -49.688 -243.160 476.192 (491.274) (496.624) (572.345) (687.533)
Confirmed COV-19 cases p.c. -19.765* -7.088 -13.336 -32.480*
(8.864) (9.460) (9.848) (13.725)
Confirmed COV-19 deaths p.c. 55.096 -12.194 31.456 -84.846
(95.326) (96.188) (108.342) (133.483)
Household size 0.190** 0.044 0.272*** 0.490***
(0.062) (0.070) (0.076) (0.076)
Constant 68.430*** 74.617*** 59.613*** 51.494***
(1.096) (1.227) (1.254) (1.414)
B. Western and Northern Europe (N = 20, 029; 362 clusters)
Post × UK 4.789*** 2.800** 11.279*** 11.590***
(0.949) (1.057) (1.538) (1.283)
Lagged confirmed COV-19 cases p.c. 258.288** 144.476 217.630 406.957** (87.466) (78.589) (140.199) (154.193) Lagged confirmed COV-19 deaths p.c. 576.443 2387.211* 175.888 1520.588 (1030.438) (951.784) (1835.821) (1848.473)
Confirmed COV-19 cases p.c. -10.555 25.440 -19.567 -33.729
(16.051) (14.412) (28.392) (30.994)
Confirmed COV-19 deaths p.c. -276.776 -668.379* 70.852 52.636
(314.309) (291.597) (586.458) (614.189)
Household size 0.217* 0.239* 0.335** 0.535***
(0.090) (0.098) (0.114) (0.137)
Constant 64.662*** 69.846*** 58.602*** 42.702***
(5.758) (5.204) (10.499) (8.971)
Table H: DiD Estimates using countries with no change in their lockdown policy over the period as a control group
Gatherings Handshake Stores Curfew
A. Full sample (N = 20, 533; 1, 211 clusters)
Post × UK 8.147*** 3.913*** 14.387*** 14.722***
(0.718) (0.699) (0.887) (0.897)
Lagged confirmed COV-19 cases p.c. -3.898 -14.335 -16.704 -29.954*
(11.650) (10.835) (12.969) (14.666)
Lagged confirmed COV-19 deaths p.c. -93.210 -77.843 703.419*** 1043.404***
(177.103) (167.831) (211.151) (218.352)
Confirmed COV-19 cases p.c. -6.795*** -7.320*** -6.286*** -14.685***
(1.537) (1.844) (1.875) (2.929)
Confirmed COV-19 deaths p.c. 71.849*** 6.043 12.734 84.375**
(18.441) (21.669) (28.542) (29.815)
Household size 0.126* 0.103 0.240*** 0.427***
(0.056) (0.064) (0.066) (0.068)
Constant 69.541*** 79.025*** 60.054*** 50.683***
(0.332) (0.403) (0.397) (0.551)
B. Western and Northern Europe (N = 7, 588; 315 clusters)
Post × UK 8.382*** 4.475*** 14.946*** 14.885***
(0.724) (0.679) (0.949) (0.933)
Lagged confirmed COV-19 cases p.c. -10.376 -18.420 -35.567* -56.212***
(12.362) (11.106) (13.752) (16.071)
Lagged confirmed COV-19 deaths p.c. -99.932 62.532 391.946 872.042*
(255.148) (226.923) (285.891) (339.995)
Confirmed COV-19 cases p.c. -6.479*** -4.189* -6.652** -17.863***
(1.917) (2.060) (2.325) (3.760)
Confirmed COV-19 deaths p.c. 128.929* 75.916 270.156*** 318.246***
(58.996) (49.921) (72.511) (91.732)
Household size 0.182* 0.230** 0.210* 0.486***
(0.091) (0.083) (0.096) (0.111)
Constant 70.452*** 82.878*** 59.715*** 50.522***
(0.698) (0.604) (0.847) (1.077)
Table I: Effect of a Lockdown on perceived norms on pooled data
Gatherings Handshake Stores Curfew
Panel A: Full sample (N = 99, 613; 1, 617 clusters)
Strict lockdown (stay at home) 2.721*** 0.855* 5.558*** 7.193***
(0.370) (0.418) (0.517) (0.540)
Lagged confirmed COV-19 cases p.c. 4.689 -6.420 6.123 6.358
(8.427) (8.429) (9.849) (11.198)
Lagged confirmed COV-19 deaths p.c. 11.490 118.298 605.512** 609.175** (155.188) (146.696) (201.843) (213.642) Confirmed COV-19 cases p.c. -9.525*** -7.927*** -8.643*** -10.738***
(1.257) (1.234) (1.619) (2.117)
Confirmed COV-19 deaths p.c. 68.238*** 27.850 -11.964 -7.983
(15.068) (16.091) (21.136) (21.470)
Household size 0.182*** 0.087 0.290*** 0.472***
(0.047) (0.049) (0.052) (0.055)
B. Western and Northern Europe (N = 37, 745; 405 clusters)
Strict lockdown (stay at home) 3.303*** 2.058*** 7.394*** 8.146***
(0.425) (0.475) (0.600) (0.616)
Lagged confirmed COV-19 cases p.c. 18.628 7.727 23.370 9.763
(12.270) (10.660) (13.910) (15.412) Lagged confirmed COV-19 deaths p.c. -53.981 -147.435 842.885** 1480.016***
(266.821) (220.918) (289.294) (322.226) Confirmed COV-19 cases p.c. -10.361*** -5.372** -6.289* -12.530***
(1.802) (1.650) (2.913) (3.183)
Confirmed COV-19 deaths p.c. 183.598*** 78.883* 143.176** 27.860 (50.628) (40.041) (54.450) (62.731)
Household size 0.158* 0.214*** 0.189** 0.460***
(0.071) (0.064) (0.072) (0.087)
Table J: DiD estimates using weighted data
Gatherings Handshake Stores Curfew
A. Full sample (N = 99, 613; 1, 617 clusters)
Post × UK 7.086*** 3.381* 13.345*** 16.729***
(1.706) (1.717) (1.806) (2.270)
Lagged confirmed COV-19 cases p.c. 12.429 -40.196 -6.319 23.645
(23.435) (24.120) (34.768) (34.362) Lagged confirmed COV-19 deaths p.c. -175.188 61.985 -125.354 -322.006 (443.363) (435.784) (546.836) (596.076)
Confirmed COV-19 cases p.c. -3.679 -4.792 0.678 -7.919
(3.750) (3.818) (5.236) (4.660)
Confirmed COV-19 deaths p.c. 24.948 76.710 6.382 6.603
(45.478) (47.838) (69.884) (72.368)
Household size 0.423** 0.372* 0.500* 0.756***
(0.149) (0.170) (0.207) (0.192)
Constant 67.114*** 75.460*** 58.679*** 50.351***
(0.816) (0.860) (0.987) (1.022)
B. Western and Northern Europe (N = 37, 745; 405 clusters)
Post × UK 7.491*** 3.097 15.526*** 18.146***
(1.731) (1.766) (1.897) (2.486)
Lagged confirmed COV-19 cases p.c. 1.007 -30.519 -55.669 -35.017 (20.535) (22.232) (36.467) (35.875) Lagged confirmed COV-19 deaths p.c. -237.564 35.994 -1296.854 -459.676 (618.567) (594.357) (821.596) (883.087)
Confirmed COV-19 cases p.c. -6.075 -1.653 0.875 -8.286
(3.664) (3.732) (6.483) (5.769)
Confirmed COV-19 deaths p.c. 98.473 164.416 284.337* 33.196
(97.343) (104.047) (141.527) (146.744)
Household size 0.170 0.344* 0.382 0.596**
(0.168) (0.171) (0.212) (0.229)
Constant 73.025*** 83.020*** 64.591*** 56.270***
(1.422) (1.419) (1.925) (2.062)
K
Robustness of the DiD estimates to a European control group
The figure below reports the point estimates along with 95% confidence intervals resulting from the difference-in-difference estimation in (1) on the control group made of Northern and Western European countries from which of each country is excluded one after the other. The countries iso-code are defined in Table A. (a) Gatherings None AT BE CH DE DK FI FR IE LV NL NO SE Excluding country 0 1 2 3 4 5 6 7 8 9 10 11 12 13 14 15 16 17 18 19 20 21 22 Dif-in-Diff Estimate (b) Handshake None AT BE CH DE DK FI FR IE LV NL NO SE Excluding country 0 1 2 3 4 5 6 7 8 9 10 11 12 13 14 15 16 17 18 19 20 21 22 Dif-in-Diff Estimate (c) Stores None AT BE CH DE DK FI FR IE LV NL NO SE Excluding country 0 1 2 3 4 5 6 7 8 9 10 11 12 13 14 15 16 17 18 19 20 21 22 Dif-in-Diff Estimate (d) Curfew None AT BE CH DE DK FI FR IE LV NL NO SE Excluding country 0 1 2 3 4 5 6 7 8 9 10 11 12 13 14 15 16 17 18 19 20 21 22 Dif-in-Diff Estimate