HAL Id: hal-02504761
https://hal.archives-ouvertes.fr/hal-02504761
Submitted on 18 Feb 2021HAL is a multi-disciplinary open access archive for the deposit and dissemination of sci-entific research documents, whether they are pub-lished or not. The documents may come from teaching and research institutions in France or abroad, or from public or private research centers.
L’archive ouverte pluridisciplinaire HAL, est destinée au dépôt et à la diffusion de documents scientifiques de niveau recherche, publiés ou non, émanant des établissements d’enseignement et de recherche français ou étrangers, des laboratoires publics ou privés.
Measurement of the carbon 14 activity at natural level
in air samples
A. Olivier, L. Tenailleau, Y. Baron, D. Maro, M. Fontugne
To cite this version:
A. Olivier, L. Tenailleau, Y. Baron, D. Maro, M. Fontugne. Measurement of the carbon 14 ac-tivity at natural level in air samples. Radioprotection, EDP Sciences, 2005, 40, pp.S791-S796. �10.1051/radiopro:2005s1-116�. �hal-02504761�
DOI: 10.1051/radiopro:2005s1-116
Measurement of the carbon 14 activity at natural level
in air samples
A. Olivier
1, L. Tenailleau
1, Y. Baron
1, D. Maro
2and M. Fontugne
31
Marine Nationale, École des Applications Militaires de l’Énergie Atomique, Département Groupe d'Études Atomiques, BP. 19, 50115 Cherbourg Armées, France
2
Institut de Radioprotection et de Sûreté Nucléaire, Laboratoire de Radioécologie de Cherbourg-Octeville, 50130 Cherbourg-Octeville, France
3
Laboratoire des Sciences du Climat et de l'Environnement, UMR 1572-CEA/CNRS, Domaine du CNRS, 91198 Gif-sur-Yvette, France
Abstract. The aim of the study was to measure the carbon 14 activity at natural level in air samples using
classical methods of radiochemistry and beta counting. Three different methods have been tested in order to minimise the detection limit. In the three methods, the first step consists in trapping the atmospheric carbon 14 into NaOH (1N) using a bubbling chamber. The atmospheric carbon dioxide reacts with NaOH to form Na2CO3. In the first method the Na2CO3 solution is mixed with a liquid scintillate and is directly
analysed by liquid scintillation counting (LSC). The detection limit is approximately 0.3 Bq.m-3 of air
samples. The second method consists in evaporating the carbonate solution and then counting the solid residue with a proportional gas circulation counter. The detection limit obtained is equivalent to the first method (0.36 Bq.m-3 of air samples). In the third method, Na2CO3 is precipitated into CaCO3 in presence
of CaCl2. CaCO3 is then analysed by LSC. This method appears to be the most appropriate, the detection
limit is 0.04 Bq.m-3 of air samples.
1. INTRODUCTION
Besides the natural cosmic-ray induced production of radiocarbon in the atmosphere, 14C also results from nuclear weapons testing and the nuclear power industry. The main part of the 14C discharged from nuclear reactor is produced through neutron-induced reactions and is released as airborne effluents through the ventilation system of the plant to the surrounding environment [1-2]
The atmospheric carbon 14 near the nuclear installations of the French Navy have to be measured from 2005. The laboratory of “Groupe d’Etudes Atomiques” have experimented a technique of carbon tracking in order to determine the efficiency of the method. Next, three techniques of atmospheric radiocarbon measurements have been studied. The aim was to detect the natural level in order to estimate the impact in the environment of the radiocarbon released by the nuclear installation.
2. EQUIPMENT AND METHOD 2.1 Forms of radiocarbon gases analysed
The emission rate and chemical composition of the released 14C depends on the type and capacity of a given reactor. Several publications discuss various aspects of 14C production rate of nuclear installations [1,3]. In this study, we investigated chemical forms such as CO2 and CH4.
S792 RADIOPROTECTION
2.2 Method of carbon 14 tracking
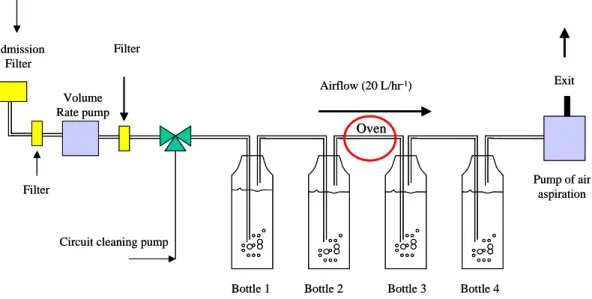
A carbon 14 collector (HAG 7000) made by SDEC France company is used for the trapping of the atmospheric carbon 14. The working principle is shown on the figure 1. Carbon 14 is trapped in a soda solution (1N) prepared a few hours before sampling to avoid the formation of sodium carbonate by air CO2 reaction. The CO2 is directly trapped into the first and the second bottles. The organic carbon is
oxidized in the oven by a palladium catalyst held at 450°C to form CO2 which is trapped in the third
and fourth bottles. The air is passed through NaOH bubblers at the rate of 20 L.hr-1. The liquid solution is collected weekly. After 1 week of bubbling, the components of the solution are sodium hydroxide and sodium carbonate.
Bottle 1 Bottle 2 Bottle 3 Bottle 4
Pump of air aspiration
Exit
Airflow (20 L/hr-1)
Oven
Circuit cleaning pump Volume Rate pump Filter Filter Admission Filter
Bottle 1 Bottle 2 Bottle 3 Bottle 4
Pump of air aspiration
Exit
Airflow (20 L/hr-1)
Oven
Circuit cleaning pump Volume Rate pump Filter Filter Admission Filter
Figure 1. Working principle of carbon 14 collector HAG 7000 (SDEC France).
2.3 Methods of carbon 14 measurement
2.3.1 Measurement of collected solution by liquid scintillation counting
The collected solution is analysed by time resolved liquid scintillation counting (TR-LSC) with a TriCarb ultra low-level scintillation beta spectrometer (Packard® 2770 TR/SL). The concept of the background reducing is based on a type of pulse shape/duration analysis [4]. The measurements are made in the French Navy's low level background laboratory at Cherbourg (Roule Laboratory).
We used the following procedure to set up the spectrometer for 14C activity measurements: • The counting geometry is a mixture of 1 mL of each bottle with 10 mL of scintillator placed
in a 20 mL PTFE low level vial. 1,2,4-trimethylbenzene (Hionic Fluor - Packard®) is chosen as the scintillator because of its slightly alkalinity (pH approximately 7.5). In an acidic medium, sodium carbonate reacts with acid and releases CO2 and therefore carbon 14 as 14CO2. The
vials are inserted in the Packard vial holders.
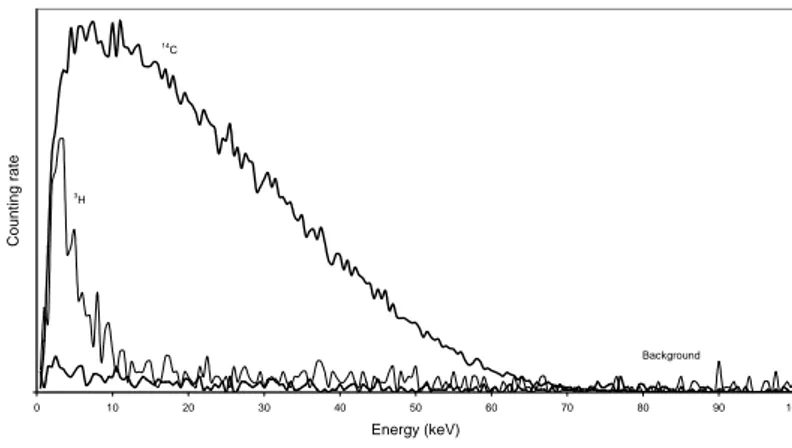
• For the selection of the standard and background samples, we decided to use carbonate sodium as the modern activity standard and as background level, we used soda solution (1N). • Spectra of modern standard and background were collected to determine the counting window for 14C measurement. The window was optimised by using the tSIE / AEC mode
(transform Spectral Index of the External standard / Automatic Efficiency Control) of the Packard Instrument and set to 10-70 keV in order to delete the interference of tritium, which gives a total efficiency of 75% (Figure 2).
• The variation of the quenching may cause changes of detection efficiency. The quench indicating parameter tSIE is measured for the different analysed samples.
• The data are collected for 12 hrs.
0 10 20 30 40 50 60 70 80 90 100 Energy (keV) Count ing rat e Background 14 C 3 H
Figure 2. Determination of counting window for 1 mL of collected solution with 10 mL of scintillator.
2.3.2 Measurement of calcium carbonate precipitate by liquid scintillation counting
In the first bottle, calcium carbonate is precipitated by the reaction of sodium carbonate and calcium chloride. Calcium carbonate precipitate is filtered, rinsed with distilled water and dried at 70°C. The measurement is made in the Roule Laboratory.
• The counting geometry is a mixture of 1 g of calcium carbonate with 10 mL of scintillator (PermaFluor - Packard®) placed in a 20 mL PTFE low level vial.
• For the selection of the standard, we decided to prepare calcium carbonate as the modern activity standard. Calcium carbonate standard is precipitated by the reaction of a mixture of sodium carbonate standard / sodium carbonate solution and calcium chloride solution. As background level, we used geological calcium carbonate.
• Spectra of modern standard and background were collected to determine the counting window for 14C measurement. The window was set to 18-70 keV in order to delete the interference of tritium, which gives a total efficiency of 23%.
• The variation of the quenching may cause changes of detection efficiency. The quench indicating parameter tSIE is measured for the different analysed samples.
• The counting time for each sample is 12 hrs.
2.3.3 Measurement of evaporated solution by gas proportional beta counting
A collected solution’s aliquot of the first bottle is evaporated on a stainless steel counting planchet (diameter 20 cm2) and then analysed with a gas proportional counter (Canberra® - NU20). The measurement is made in the Roule laboratory (low-background beta < 0.3 cpm for a 55 mm detector).
• The chamber is filled with counting gas made by 90% argon and 10% methane. • Counting efficiency for 14
C particle is determined by evaporation of the first bottle aliquot after addition of a small volume of modern standard Na2CO3. As background level, an identical
volume of sodium hydroxide 1N is evaporated. • The data are collected for a minimum of 12 hours.
S794 RADIOPROTECTION
3. RESULTS AND DISCUSSION
3.1 Efficiency of the tracking method of carbon 14
After one week of collection of air environment, the trapping efficiency of carbon 14 as 14CO2 is
determined for the first couple of bottles. Barium carbonate is precipitated by the reaction of sodium carbonate and barium chloride. The barium carbonate precipitate is filtered, rinsed with distilled water, dried at 70°C and weighed. From the weight of precipitate, we calculated the mass of tracking carbon and compared it with the quantity of collected CO2. The amount of CO2 present in the air
measured with a LICOR analyser of 2LRC was approximately 400 ppm that means 0.22 g of carbon per m3 of air. The collection is repeated several times. The efficiency of tracking is reported in Table 1. The percentages of efficiency higher than 100% can be explained by the variation of the amount of CO2 near the place of air collection. In fact, 87% of carbon as CO2 form is tracked in the first bottle.
Table 1. HAG7000 collector CO2tracking efficiency.
Collected volume (L) Theoretical mass of barium carbonate precipitate (g) Experimental mass of barium carbonate precipitate
in the first bottle (g)
Experimental mass of barium carbonate precipitate in the
second bottle (g) Tracking efficiency (%) 3348 12.12 11.02 1.04 100 3345 12.15 10.56 1.79 102 3335 12.01 10.51 1.82 102 3350 12.12 10.63 2.00 104
In order to determine the efficiency of carbon tracking as methane, we used a standard mixture of methane in nitrogen. The collection is repeated several times. The efficiency of oxidisation of organic carbon is 94% and 87% of carbon as CH4 form is tracked in the third bottle (Table 2).
Table 2. HAG7000 collector oven oxidizing efficiency.
Collected volume (L) Theoretical mass of barium carbonate precipitate (g) Experimental mass of tracked carbon in the
first bottle (g)
Experimental mass of tracked carbon in the second
bottle (g) Oven oxidizing efficiency (%) 100 0.88 0.73 0.07 91 100 0.88 0.75 0.10 97 200 1.77 1.49 0.20 95 300 2.65 1.97 0.43 91
3.2 Detection limit for the method of radiocarbon measurement
The detection limit is calculated for the different methods of measurement in the first bottle because of its high tracking efficiency of carbon 14 as CO2 form.
3.2.1 Measurement of collected solution by liquid scintillation counting
The variation of the quenching may cause changes of detection efficiency. The quench indicating parameter tSIE is measured for the different analysed samples. The tSIE parameter uses the interaction between the radioactivity from an external 133Ba source and the scintillator in the sample vial to determine quench level. The concentration of soda solution have no influence on the tSIE value and therefore no quenching correction is needed for collected solution (Table 3).
Table 3. tSIE parameter of different solutions analysed by LSC.
Sample Sample volume (mL) Scintillator volume (mL) tSIE
NaOH 1N 1 10 370
NaOH 0.6 N / Na2CO3 0.2 N 1 10 362
NaOH 0.28 N / Na2CO3 0.36 N 1 10 368
Na2CO3 0.5 N 1 10 367
Collected solution 1 10 381
The detection limit is calculated from the measurement of the background level in the energy window of the 14C (1.6 cpm). The calculated detection limit is 0.33 Bq.m-3 of collected air by application of the different parameters: a counting time of 720 min, a counting efficiency of 75%, a collected volume of 3.5 m3, a bottle volume of 160 mL and a tracking efficiency of 87% (bottle 1). The natural level of carbon 14 in air is 248 Bq/kg C [5] equivalent to 0.05 Bq.m-3.
3.2.2 Measurement of calcium carbonate precipitate by liquid scintillation counting
The quench indicating parameter tSIE is measured for 1 g of precipitate mixed with 10 mL of scintillator. The results are reported in table 4.
Table 4. tSIE parameter of different precipitates.
Sample Weight (g) Scintillator volume (mL) tSIE
Geological calcium carbonate 1 10 982
Precipitate of collected solution 1 10 1130
Standard precipitate of collected solution 1 10 1140
The tSIE of the precipitate obtained from collected solution are higher than the tSIE of the geological calcium carbonate. This is explained by the presence of 22% of calcium hydroxide in the analysed precipitate of collected solution. Indeed, the reaction of sodium hydroxide with CO2 is not complete
after 1 week (3.5 m3) of bubbling (Figure 3).
The detection limit is calculated from the measurement of the background level in the energy window 18-70 keV (1.8 cpm). The calculated detection limit is 0.04 Bq/m3 of collected air by application of the different parameters: a counting time of 720 min, a counting efficiency of 23%, a collected volume of 3.5 m3 and a calcium carbonate precipitate of 0.78 g (bottle 1). The detection limit is equivalent to the natural level of carbon 14 in air.
10 10,5 11 11,5 12 12,5 13 13,5 14 0 1000 2000 3000 4000 5000 6000 7000 8000 9000
Collected air volume (L)
pH
pH Bottle 1 pH Bottle 2
S796 RADIOPROTECTION
3.3.3 Measurement of evaporated solution by gas proportional beta counting
A collected solution’s aliquot of the first bottle is evaporated on a stainless steel counting planchet and then analysed with a gas proportional counter. Counting efficiency for 14C particles is determined by evaporation of the first bottle aliquot after addition of a small volume of modern standard Na2CO3.
As background level, an identical volume of hydroxide sodium 1N is evaporated. The counting efficiency is a function of the evaporated volume and varies between 3% to 13% (Figure 4).
0 2 4 6 8 10 12 14 16 18 0 0,1 0,2 0,3 0,4 0,5 0,6
Weight deposit Na2CO3 / NaOH (g)
Counting efficiency (
%
)
Figure 4. Counting efficiency as a function of deposit weight.
The calculated detection limit is 0.36 Bq.m-3 of collected air by application of the different parameters: a counting time of 12 hrs, a counting efficiency of 10%, a collected volume of 3.5 m3 and a deposit weight of 0.1 g (bottle 1).
4. CONCLUSION
The efficiency of carbon 14 tracking in soda solution by HAG7000 collector is 100%. The tracking of carbon as CO2 form occurs mainly in the first bottle (87%) and as organic form in the third bottle (87%).
The furnace oxidizing efficiency is near 94%.
Three techniques of carbon 14 measurement have been tested by collecting air environment. The direct analysis by LSC of collected solution in presence of scintillator gives a detection limit of 0.33 Bq/m3. The evaporation of a collected solution’s aliquot on a stainless steel counting planchet, analysed with a gas proportional counter, produces a detection limit of 0.36 Bq/m3. The most appropriate technique is the precipitation of calcium carbonate. The analysis of CaCO3 precipitate,
formed by adding calcium chloride to the collected solution, ensures to reach the natural level of atmospheric carbon 14 (0.05 Bq/m3).
References
[1] Kunz C., Carbon-14 discharge at three light water reactors. Health Physics 49, 1 (1985) 25-35. [2] Stenström K., Erlandsson B., Hellborg R., Wiebert A., Skog G., Vesanen R., Alpsten M., Bjurman B.,
A one-year study of the total air-borne 14C effluents from two Swedish light-water reactors, one boiling water- and one pressurized water reactor, Journal of Radioanalytical and Nuclear
Chemistry 198, 1 (1995) 203-213.
[3] Levin I., Kromer B., Barabas M., Münnich K. O., Environmental distribution and long-term dispersion of reactor 14CO2 around two German nuclear power plants, Heath Physics 54, (1988) 149-156.
[4] Van Cauter S., Three dimension spectrum analysis: A new approach to reduce background of liquid scintillation counters, Packard Applications Bulletin 006, (1986).
[5] Maro D., Fontugne M., Hatté C., Hebert D., Rozet M., 14C sources and distribution in the vicinity of the Hague nuclear processing plant: Part II-Marine environment, Radiocarbon 46, 2 (2004) 831-839.