Supplementary Materials for
Amino Acid Deprivation Inhibits TORC1 Through a
GTPase-Activating Protein Complex for the Rag Family GTPase Gtr1
Nicolas Panchaud, Marie-Pierre Péli-Gulli, Claudio De Virgilio*
*Corresponding author. E-mail: [email protected]
The PDF file includes:
Fig. S1. Loss of individual SEAC subunits does not substantially affect the growth of
cells at 30°C or eIF2
α phosphorylation after leucine starvation.
Fig. S2. Effects on TORC1 activity of various combinations of individual deletions
of SEAC subunit-encoding genes.
Fig. S3. Loss of Iml1-Npr2-Npr3 complex subunits, individually or in combination,
or expression of Gtr1
Q65Lor of Iml1
R943Arenders TORC1 activity partially
insensitive to leucine starvation.
Fig. S4. Iml1 physically interacts with Gtr1-TAP in the presence, but substantially
less in the absence, of Npr2 and Npr3.
Fig. S5. The conserved residue Arg
943in Iml1 is functionally important.
Fig. S6. Purified Iml1-His
6and Iml1
R943A-His
6preferentially bind bacterially
expressed GST-Gtr1 preloaded with GDP plus AlF
x.
Table S1. Strains used in this study.
Table S2. Plasmids used in this study.
References (30) to (34)
Published in "Science Signaling 6(277): ra42, 2013" which should be cited to refer to this work.
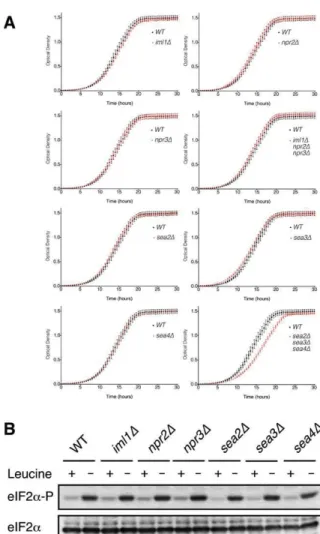
Fig. S1. Loss of individual SEAC subunits does not substantially affect the growth of cells at 30°C or
eIF2
α phosphorylation after leucine starvation. (A) Optical density was measured at 600 nm. As expected
based on their intrinsically low TORC1 activity (Fig. 1C), triple sea2¨ sea3¨ sea4¨ mutant cells
exhibited a slow growth phenotype (lower panel on the right). Data are means
±
S.D. from three
independent experiments. (B) Phosphorylation of eIF2
α (on Ser
51; eIF2
α-P) was assessed as previously
described (12) prior to (+) and following (-) a 60-min period of leucine starvation. One representative
immunoblot from three independent experiments is shown.
Fig. S2. Effects on TORC1 activity of various combinations of individual deletions of SEAC
subunit-encoding genes. Immunoblots (one of 3 is shown) detecting the extent of phosphorylation within the
terminus of Sch9 were used to quantify TORC1 activity (the ratio of hyperphosphorylated
[+P]/hypophosphorylated [-P] Sch9) presented in Fig. 1C.
Fig. S3. Loss of Iml1-Npr2-Npr3 complex subunits, individually or in combination, or expression of
Gtr1
Q65Lor of Iml1
R943Arenders TORC1 activity partially insensitive to leucine starvation. TORC1
activities (means + S.D.; n=3 independent experiments, assayed as in Fig. 1A) were assessed following 30
min of leucine starvation and normalized to the respective value in each strain before leucine starvation.
***P<0.001, **P<0.01 in Student’s t-test versus wild-type control (P-values are Holm-Bonferroni
adjusted).
Fig. S4. Iml1 physically interacts with Gtr1-TAP in the presence, but substantially less in the absence, of
Npr2 and Npr3. Lysates (Input) from exponentially growing wild-type and npr2¨ npr3¨ cells expressing
the indicated fusion proteins and TAP pull-down fractions were analyzed by immunoblotting using
anti-TAP or anti-myc antibodies. One representative immunoblot from three independent experiments is
shown.
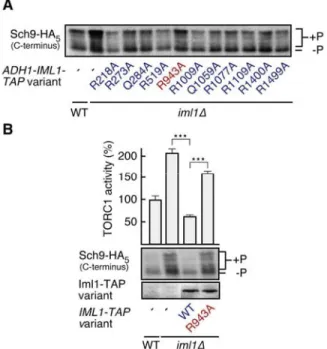
Fig. S5. The conserved residue Arg
943in Iml1 is functionally important. (A) Alanine scanning of
conserved arginine and glutamine residues in Iml1 indicates that Arg
943is important for the
TORC1-inhibitory activity of overexpressed Iml1-TAP (assayed as in Fig. 1A). One representative immunoblot
from two independent experiments is shown . (B) Effects of overexpression of Iml1-TAP and Iml1
R943A-TAP on TORC1 activity were assayed in three independent replicates (means + S.D. are shown). Fusion
protein expression was confirmed by immunoblot analysis (lower panel). ***P<0.001, in Student’s t-test
(P-values are Holm-Bonferroni adjusted).
Fig. S6. Purified Iml1-His
6and Iml1
R943A-His
6preferentially bind bacterially expressed GST-Gtr1
preloaded with GDP plus AlF
x. In vitro GST-pulldown experiments were performed with bacterially
expressed GST-Gtr1 preloaded with GDP alone (+/-) or GDP plus AlF
x(+/+) and either purified
Iml1-His
6or Iml1
R943A-His
6. One representative Western blot from two independent experiments is shown.
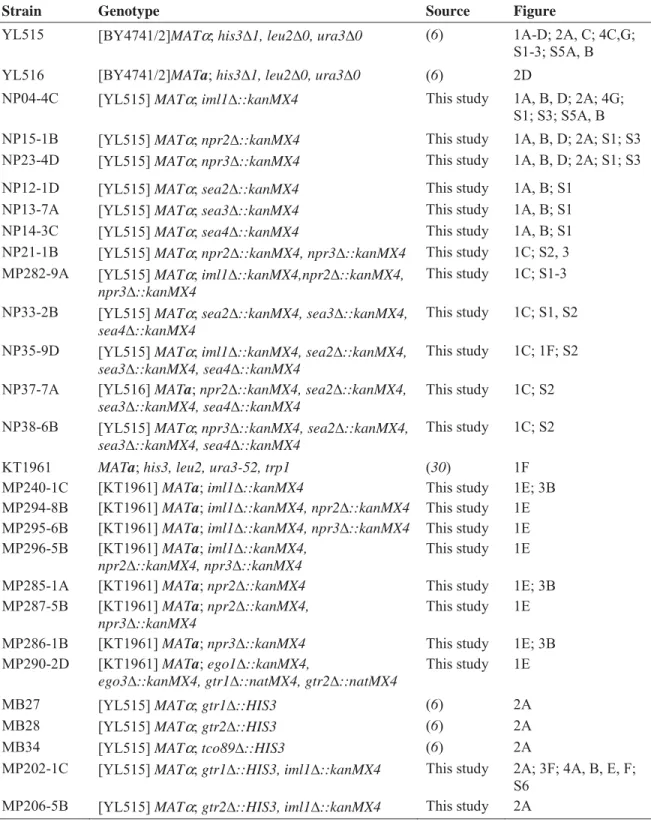
Table S1. Strains used in this study
Strain Genotype Source Figure
YL515 [BY4741/2]MATα; his3¨1, leu2¨0, ura3¨0 (6) 1A-D; 2A, C; 4C,G; S1-3; S5A, B
YL516 [BY4741/2]MATa; his3¨1, leu2¨0, ura3¨0 (6) 2D
NP04-4C [YL515] MATα; iml1¨::kanMX4 This study 1A, B, D; 2A; 4G; S1; S3; S5A, B NP15-1B [YL515] MATα; npr2¨::kanMX4 This study 1A, B, D; 2A; S1; S3 NP23-4D [YL515] MATα; npr3¨::kanMX4 This study 1A, B, D; 2A; S1; S3 NP12-1D [YL515] MATα; sea2¨::kanMX4 This study 1A, B; S1
NP13-7A [YL515] MATα; sea3¨::kanMX4 This study 1A, B; S1 NP14-3C [YL515] MATα; sea4¨::kanMX4 This study 1A, B; S1 NP21-1B [YL515] MATα; npr2¨::kanMX4, npr3¨::kanMX4 This study 1C; S2, 3 MP282-9A [YL515] MATα; iml1¨::kanMX4,npr2¨::kanMX4,
npr3¨::kanMX4
This study 1C; S1-3 NP33-2B [YL515] MATα; sea2¨::kanMX4, sea3¨::kanMX4,
sea4¨::kanMX4
This study 1C; S1, S2 NP35-9D [YL515] MATα; iml1¨::kanMX4, sea2¨::kanMX4,
sea3¨::kanMX4, sea4¨::kanMX4
This study 1C; 1F; S2 NP37-7A [YL516] MATa; npr2¨::kanMX4, sea2¨::kanMX4,
sea3¨::kanMX4, sea4¨::kanMX4
This study 1C; S2 NP38-6B [YL515] MATα; npr3¨::kanMX4, sea2¨::kanMX4,
sea3¨::kanMX4, sea4¨::kanMX4
This study 1C; S2
KT1961 MATa; his3, leu2, ura3-52, trp1 (30) 1F
MP240-1C [KT1961] MATa; iml1¨::kanMX4 This study 1E; 3B
MP294-8B [KT1961] MATa; iml1¨::kanMX4, npr2¨::kanMX4 This study 1E
MP295-6B [KT1961] MATa; iml1¨::kanMX4, npr3¨::kanMX4 This study 1E
MP296-5B [KT1961] MATa; iml1¨::kanMX4, npr2¨::kanMX4, npr3¨::kanMX4
This study 1E MP285-1A [KT1961] MATa; npr2¨::kanMX4 This study 1E; 3B
MP287-5B [KT1961] MATa; npr2¨::kanMX4, npr3¨::kanMX4
This study 1E MP286-1B [KT1961] MATa; npr3¨::kanMX4 This study 1E; 3B
MP290-2D [KT1961] MATa; ego1¨::kanMX4,
ego3¨::kanMX4, gtr1¨::natMX4, gtr2¨::natMX4
This study 1E
MB27 [YL515] MATα; gtr1¨::HIS3 (6) 2A
MB28 [YL515] MATα; gtr2¨::HIS3 (6) 2A
MB34 [YL515] MATα; tco89¨::HIS3 (6) 2A
MP202-1C [YL515] MATα; gtr1¨::HIS3, iml1¨::kanMX4 This study 2A; 3F; 4A, B, E, F; S6
MP206-5B [YL515] MATα; gtr2¨::HIS3, iml1¨::kanMX4 This study 2A
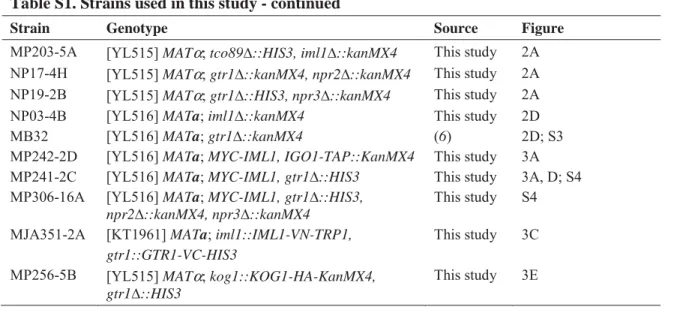
Table S1. Strains used in this study - continued
Strain Genotype Source Figure
MP203-5A [YL515] MATα; tco89¨::HIS3, iml1¨::kanMX4 This study 2A NP17-4H [YL515] MATα; gtr1¨::kanMX4, npr2¨::kanMX4 This study 2A NP19-2B [YL515] MATα; gtr1¨::HIS3, npr3¨::kanMX4 This study 2A
NP03-4B [YL516] MATa; iml1¨::kanMX4 This study 2D
MB32 [YL516] MATa; gtr1¨::kanMX4 (6) 2D; S3
MP242-2D [YL516] MATa; MYC-IML1, IGO1-TAP::KanMX4 This study 3A
MP241-2C [YL516] MATa; MYC-IML1, gtr1¨::HIS3 This study 3A, D; S4
MP306-16A [YL516] MATa; MYC-IML1, gtr1¨::HIS3, npr2¨::kanMX4, npr3¨::kanMX4
This study S4 MJA351-2A [KT1961] MATa; iml1::IML1-VN-TRP1,
gtr1::GTR1-VC-HIS3
This study 3C MP256-5B [YL515] MATα; kog1::KOG1-HA-KanMX4,
gtr1¨::HIS3
This study 3E
Table S2. Plasmids used in this study
Plasmid Description Source Figure
pRS413 CEN, HIS3 (31) 1D-F; 2A; 3A, B,
F; 4A, B, E, F; S1; S6
pRS414 CEN, TRP1 (31) 1E, F; 3B
pRS415 CEN, LEU2 (31) 1A-C, E, F; 2A-C;
3A, C; 4C, G; S5A, B; S1A, S2; S4
pRS416 CEN, URA3 (31) 1A-D, G; 2B-D;
3A, C; 4G: S1-S3; S5A, B
pJU1064 [pRS413] SCH9T570A-HA
5 (25) 1A-C, G; 2B-D;
4G; S2, 3; S5A, B pJU1058 [pRS415] SCH9T570A-HA
5 (25) 1D
pJU1030 [pRS416] SCH9T570A-HA5 (25) 2A; 4C
BG1805 2μ, URA3, GAL1p Open Biosystems
pNP1946 [BG1805] IML1- HIS6 This study 1D; 2C; 4G
pNP2094 [BG1805] NPR2- HIS6 This study 1D
pNP2095 [BG1805] NPR3- HIS6 This study 1D
pNP2106 [BG1805] NPR3- HIS6, ura3::HIS3 This study 1D
YCplac111 CEN, LEU2 (32)
pDK2698 [YCplac111] ADH1p-SYO1-(GA)5-3xEGFP (33)
pDK2712 [YCplac111] ADH1p-3xEGFP-(GA)5-RIX7 D. Kressler
pMP2118 [YCplac111] IML1p-IML1-(GA)5-3xEGFP, leu2::URA3
This study 1E, F; 3B pNP2350 [pRS416] IML1p-IML1-R943A-(GA)5-3xEGFP This study S3
pFLJ2286 [pRS416] NPR2p-NPR2-(GA)5-3xEGFP This study 1E; 3B
pFLJ2293 [pRS416] NPR3p-3xEGFP-(GA)5-NPR3 This study 1E; 3B
pMP2149 [pRS416] CYC1p-HHF2-Tdimer2(12), ura3::HIS3
This study 1F
YCplac33 CEN, URA3 (32)
pMB1393 [YCplac33] TetON-GTR1 (GTR1-WT) (6) 2B
pMB1394 [YCplac33] TetON-GTR1Q65L (GTR1-GTP) (6) 2B, D; S3
pMB1395 [YCplac33] TetON-GTR1 S20L
(GTR1-GDP) (6) 2B
pPM1621 [YCplac111] TetON-GTR2 (GTR2-WT) This study 2B
pPM1622 [YCplac111] TetON-GTR2Q66L (GTR2-GTP) This study 2B, C
pPM1623 [YCplac111] TetON-GTR2S23L (GTR2-GDP) (12) 2B, C
pPM1397 [YCplac111] TetON-GTR1 Q65L
(GTR1-GTP) This study 2C
pPM1398 [YCplac111] TetON-GTR1S20L (GTR1-GDP) This study 2C
pMB1344 [YCplac33] GTR1p-GTR1-TAP (6) 3A, D, E; S4
pMB1372 [YCplac33] GTR1p-GTR1Q65L –TAP (6) 3D, E
pRS425 2μ, LEU2 (34)
pFLJ2251 [pRS425] GAL1p-IML1 This study 3E
pJU650 [pRS416] GTR1p-GTR1 R. Loewith 3E; S4
pDK2261 [YCplac111] NSA1p-NSA1- HIS6-TEV-ProtA D. Kressler
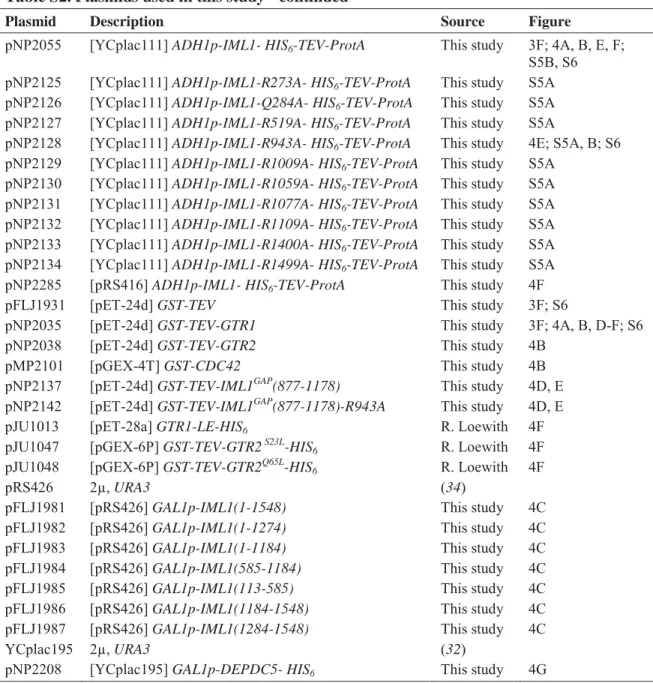
Table S2. Plasmids used in this study - continued
Plasmid Description Source Figure
pNP2055 [YCplac111] ADH1p-IML1- HIS6-TEV-ProtA This study 3F; 4A, B, E, F;
S5B, S6 pNP2125 [YCplac111] ADH1p-IML1-R273A- HIS6-TEV-ProtA This study S5A
pNP2126 [YCplac111] ADH1p-IML1-Q284A- HIS6-TEV-ProtA This study S5A
pNP2127 [YCplac111] ADH1p-IML1-R519A- HIS6-TEV-ProtA This study S5A
pNP2128 [YCplac111] ADH1p-IML1-R943A- HIS6-TEV-ProtA This study 4E; S5A, B; S6
pNP2129 [YCplac111] ADH1p-IML1-R1009A- HIS6-TEV-ProtA This study S5A
pNP2130 [YCplac111] ADH1p-IML1-R1059A- HIS6-TEV-ProtA This study S5A
pNP2131 [YCplac111] ADH1p-IML1-R1077A- HIS6-TEV-ProtA This study S5A
pNP2132 [YCplac111] ADH1p-IML1-R1109A- HIS6-TEV-ProtA This study S5A
pNP2133 [YCplac111] ADH1p-IML1-R1400A- HIS6-TEV-ProtA This study S5A
pNP2134 [YCplac111] ADH1p-IML1-R1499A- HIS6-TEV-ProtA This study S5A
pNP2285 [pRS416] ADH1p-IML1- HIS6-TEV-ProtA This study 4F
pFLJ1931 [pET-24d] GST-TEV This study 3F; S6
pNP2035 [pET-24d] GST-TEV-GTR1 This study 3F; 4A, B, D-F; S6
pNP2038 [pET-24d] GST-TEV-GTR2 This study 4B
pMP2101 [pGEX-4T] GST-CDC42 This study 4B
pNP2137 [pET-24d] GST-TEV-IML1GAP(877-1178) This study 4D, E
pNP2142 [pET-24d] GST-TEV-IML1GAP(877-1178)-R943A This study 4D, E
pJU1013 [pET-28a] GTR1-LE-HIS6 R. Loewith 4F
pJU1047 [pGEX-6P] GST-TEV-GTR2S23L-HIS6 R. Loewith 4F
pJU1048 [pGEX-6P] GST-TEV-GTR2Q65L-HIS6 R. Loewith 4F
pRS426 2μ, URA3 (34)
pFLJ1981 [pRS426] GAL1p-IML1(1-1548) This study 4C
pFLJ1982 [pRS426] GAL1p-IML1(1-1274) This study 4C
pFLJ1983 [pRS426] GAL1p-IML1(1-1184) This study 4C
pFLJ1984 [pRS426] GAL1p-IML1(585-1184) This study 4C
pFLJ1985 [pRS426] GAL1p-IML1(113-585) This study 4C
pFLJ1986 [pRS426] GAL1p-IML1(1184-1548) This study 4C
pFLJ1987 [pRS426] GAL1p-IML1(1284-1548) This study 4C
YCplac195 2μ, URA3 (32)
pNP2208 [YCplac195] GAL1p-DEPDC5- HIS6 This study 4G